- zotarolimus-eluting stent
- sirolimus-eluting stent
- diabetes
Abstract
Aims: Patients with diabetes mellitus have increased risk of in-stent restenosis after coronary stent implantation due to neointimal hyperplasia (NIH). The aim of this study was to use quantitative coronary angiography (QCA) and volumetric intravascular ultrasound (IVUS) to evaluate the effects of the sirolimus-eluting Cypher® stent (SES) and the zotarolimus-eluting Endeavor® stent (ZES) on angiographic late lumen loss and intima hyperplasia in diabetic patients.
Methods and results: In the DiabeDES III trial, 127 patients were randomised to SES or ZES stent implantation. Angiographic 10-month follow-up data were available in 105 patients, including 48 SES and 57 ZES treated patients. Angiographic endpoints were in-stent late lumen loss and minimal lumen diameter. IVUS endpoints included NIH volume and in-stent percent volume obstruction. Baseline clinical characteristics and lesion parameters were similar in the two groups. At 10-month follow-up, angiographic in-stent late lumen loss (0.14±0.37 mm vs. 0.74±0.45 mm, p<0.001) was reduced and minimum lumen diameter was higher (2.36±0.53 mm vs. 1.96±0.65, p<0.001) in the SES group as compared to the ZES group. As compared to the ZES group, NIH volume was significantly reduced in the SES group (median [interquartile range]: 0.0 mm3 [0.0 to 1.2] vs. 16.5 mm3 [6.2 to 31.1], p<0.001). In-stent% volume obstruction was significantly reduced in SES as compared to ZES (median [interquartile range]: 0.0% [0.0-0.7] vs. 13.0% [6.7-20.8], p<0.001).
Conclusions: In diabetic patients, the SES reduced angiographic late lumen loss and inhibited NIH more effectively than ZES.
Background
Diabetes mellitus is an important risk factor for poor outcome after percutaneous coronary interventions (PCI) using bare metal stents.1-3 Drug-eluting stents (DES) have shown to reduce restenosis and the need for repeat revascularisation in diabetic patients.4-6 Angiographic and intravascular ultrasound (IVUS) studies suggest increased late lumen loss7 and intimal hyperplasia8 as mechanisms underlying high restenosis risk. A more diffuse and accelerated form of atherosclerosis in diabetic patients, accompanied by small vessel size, long lesions and greater plaque burden, may contribute to the well-documented increased risk of restenosis after stent implantation in these patients. In terms of late luminal loss, randomised studies in diabetic patients with angiographic endpoints have shown a significant advantage after implantation of sirolimus-eluting stents (SES) compared to paclitaxel-eluting stents (PES).9-12 Also, reduced intimal hyperplasia has been documented in SES- compared to PES-treated diabetic patients.13 A subgroup analysis of the diabetic participants from the SIRTAX trial demonstrated lower rates of major adverse coronary events and target lesion revascularisation after two years in SES-treated patients14 and a recent meta-analysis found that SES was superior to PES in reducing the incidences of restenosis and target lesion revascularisation in patients with diabetes, with non-significant differences in terms of cardiac death, myocardial infarction, and stent thrombosis.15
It not yet determined, if a cobalt-based alloy stent coated with the antiproliferative agent, zotarolimus, and a phosphorylcholine polymer (Endeavor stent) might provide similar angiographic and clinical benefits as the SES in diabetic patents. Therefore, the present trial examined angiographic and IVUS outcomes of a zotarolimus-eluting coronary stent (ZES) versus SES in diabetic patients.
Methods
Study population
The SORT OUT III trial16 was a single-blind, all-comer superiority trial in patients with coronary artery disease randomised to treatment with the ZES or SES. The primary endpoint was a composite of major adverse cardiac events within nine months: cardiac death, myocardial infarction, and target vessel revascularisation. From May 2006 to March 2007, 127 patients with diabetes mellitus and angiographically significant coronary stenoses in native coronary arteries (vessel diameter 2.25-4.0 mm) were enrolled in a pre-planned substudy (the DiabeDES III study) of the Danish Organisation for Randomised Trials with Clinical Outcome (SORT OUT) III trial16 (Clinicaltrials.gov Identifier: NCT00660478). A flow diagram of the study is shown in Figure 1. Exclusion criteria were lesions in vein grafts and expected survival <1 year. All patients provided written, informed consent, and the local institutional review board approved the protocol. Patients were considered to have diabetes if received dietary treatment, oral antidiabetic medication or insulin.
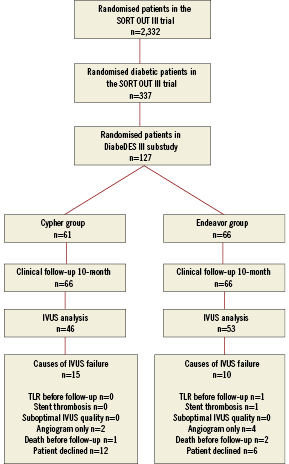
Figure 1. Flow diagram of the study. Enrolment in the DiabeDES III substudy was stopped at 127 patients because the sample size calculation already allows an analysis with those patients.
Randomisation, study lesion and intervention
Patients were randomly assigned to receive a SES (Cypher Select; Cordis, Johnson & Johnson, Warren, NJ, USA) or a ZES (Endeavor Sprint, Medtronic, Santa Rosa, CA, USA) by telephone contact to a computer-generated randomisation sequence in the SORT OUT III trial. Patients were stratified by hospital and by presence/absence of diabetes. The randomly assigned stent was implanted in all lesions treated. In multivessel interventions, lesion location in the left anterior descending coronary artery was selected as the study lesion. In combined circumflex and right coronary artery interventions, the right coronary lesion was used as the study lesion. If more than one lesion was treated in the same vessel, the proximal lesion was chosen as the study lesion. Only one lesion (study lesion) for each patient was analysed. Prior to the intervention, patients were treated with a 300-600 mg clopidogrel loading dose and continued treatment with aspirin 75 mg daily. Unfractionated heparin was given intravenously at the beginning of the procedure. Glycoprotein IIb/IIIa inhibitors were used at the operator’s discretion. After the intervention, clopidogrel 75 mg per day and aspirin 75 mg per day were continued for 12 months and lifelong, respectively.
Quantitative coronary angiography (QCA)
Coronary angiograms obtained at baseline, at completion of the stenting procedure, and at 10-month follow-up were analysed by use of a computer-based off-line analysis system (Qangio® XA 7.0; Medis, Leiden, The Netherlands). The QCA analyses were performed at a core laboratory (Aarhus University Hospital, Skejby, Denmark). All measurements were performed on angiograms recorded after intracoronary administration of nitroglycerine. The same single, worst-view projection was used. The contrast-filled non-tapered catheter tip was used for calibration. We measured lesion length, lesion minimal luminal diameter (MLD) and reference vessel diameter. Using post intervention and follow-up angiograms, we measured MLD in the stent and in the reference segments (including 5 mm proximal and distal to the stent). In-stent late lumen loss was calculated as MLD in-stent post-intervention minus MLD in-stent at follow-up. Stent thrombosis was assessed by use of the Academic Research Consortium definitions.17
IVUS imaging protocol and analysis
IVUS was performed after administration of 200µg intracoronary nitroglycerine. The IVUS system (Galaxy, Boston Scientific, Fremont, CA, USA) utilised a 40 MHz, 2.6 Fr IVUS catheter (Atlantis-Pro). Image acquisition using automated transducer pullback at 0.5 mm/s was performed from a point at least 10 mm distally to the stent to the aorto-ostial junction. Off-line analysis was performed with a commercially available programme for computerised planimetry (EchoPlaque, INDEC System, MountainView, CA, USA) by a core laboratory (Odense University Hospital, Denmark). All IVUS core laboratory analyses were performed blinded. Lumen, stent and elastic external membrane (EEM) cross-sectional areas (CSA) were measured within the stent.18 The proximal and distal stent edge was the most proximal and distal image CSA, respectively, within the stent. Neointimal hyperplasia (NIH) was calculated as stent minus lumen measures. Volume obstruction was defined as NIH volume divided by the stent volume multiplied by 100. Peri-stent plaque CSA was calculated as EEM CSA minus stent CSA in stented segments. Volumes were calculated using Simpson’s rule.
Study endpoints
The IVUS endpoints were in-stent NIH percentage volume and in-stent NIH volume. The angiographic endpoint was in-stent late lumen loss at 10-month follow-up. Secondary angiographic end points included the percentage stenosis at angiographic follow-up, the rate of restenosis (stenosis of more than 50 percent of the luminal diameter), and the in-stent minimal luminal diameter.
Statistical analysis
The statistical analysis was carried out using SPSS 18.0 (SPSS Inc., Chicago, IL, USA). Categorical data were presented as counts and percentages and compared by the Pearson Chi-Square test or the Fisher exact test. For continuous variables with a normal distribution, the mean ±1SD was reported. For variables not normally distributed, the median and interquartile ranges were reported. Continuous variables were compared using a Mann-Whitney test or a student’s t-test. Estimates of the differences between the groups (and associated 95% confidence interval) for the primary and secondary endpoints of interest are presented. The sample size calculation was based upon an estimated intima volume obstruction of 3% in the SES group and 8.5% in the ZES group with a SD of 10%, alpha error of 0.05, and a power of 80%. Thus, a minimum of 102 patients was pre-specified for enrolment. IVUS and angiographic data will only be available for patients returning for follow-up IVUS after 10 months. Patients without IVUS data were excluded from the intention-to-treat analysis. The reasons for dropouts and proportions for each group have been reported. Estimating the remaining non-available cases would, from a clinical point of view, be incorrect. For the clinical endpoints, the data set will be 100% completed.
Results
Clinical characteristics
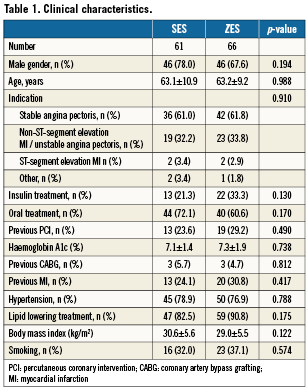
We randomised 127 patients to SES (n=61) or ZES implantation (n=66). Follow-up angiogram and IVUS were not performed for clinical or technical reasons in 22 patients (17.3%) (SES n=13; ZES n=9, p=NS): (i) one patient had a definite stent thrombosis after 135 days (ZES group) and target lesion revascularisation without IVUS, (ii) three patients died (ZES group; n=2 [one cardiac] and SES group; n=1) and (iii) six patients had only angiography performed at follow-up. Finally, eighteen patients declined to have the 10 month follow-up examination performed (SES group; n=12, ZES group; n=6) (Figure 1). Thus, follow-up angiograms were available in 105 (83%) patients (SES: n=48, ZES: n=57). The time interval between the index procedure and the follow-up did not differ significantly between the two groups SES 309.6±29.0 days vs. ZES 310.4±34.7 days, p=ns. The baseline characteristics of the completers were comparable to those not evaluated by IVUS and QCA at 10-month follow-up. Also, the baseline characteristics did not differ significantly between patients enrolled and not enrolled in the DiabeDES III sub study. Baseline clinical features are shown in Table 1.
Lesion and stent characteristics
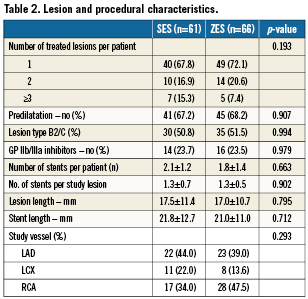
The lesion and stent characteristics are shown in Table 2. Baseline angiographic reference vessel size, minimal lumen diameter, diameter stenosis, stent size and stent length did not differ significantly between the two groups. Number of treated vessels was also similar; rate of predilation did not differ significantly between the SES- and the ZES-treated patients. In both groups, one fourth of the patients were treated with glycoprotein IIbIIIa inhibitor at the index procedure.
Angiographic outcomes
Angiographic measures are shown in Table 3; angiographic follow-up was obtained for 105 patients (83%), at a mean of 313.1±41.6 days. The angiographic primary endpoint, late luminal loss was smaller in the SES group (0.14±0.37 mm vs. 0.74±0.45mm, p<0.001) than in the ZES group. Also, the percentage stenosis at follow-up was reduced (18.9±13.9% in the SES group vs. 32.9±17.0% in the ZES group; p<0.001). The rate of restenosis, defined as luminal diameter stenosis of more than 50 percent, was 4.1% (n=2) in the SES group vs. 17.9% (n=10) in the ZES group (p=0.027). Cumulative distribution curves demonstrated a reduction in the degree of minimal lumen diameter (Figure 2) and stenosis (Figure 2) in the SES group as compared to the ZES group. Distributions were similar at baseline and immediately after stent placement. At follow-up, the distribution in the SES group was similar to the distribution immediately after stenting.
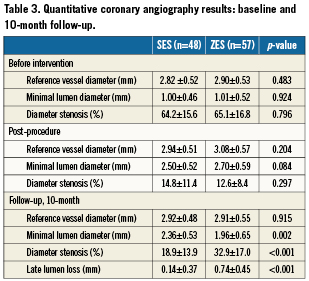
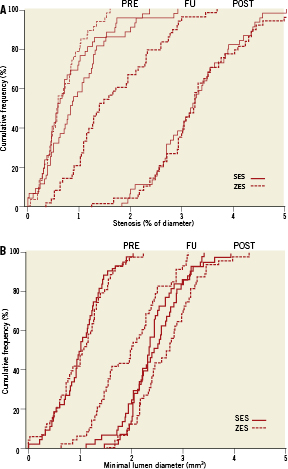
Figure 2. Cumulative distribution curve of (A) diameter stenosis before procedure, post-procedure and at follow-up, (B) minimal lumen diameter before procedure, post-procedure and at 10-month follow-up.
IVUS measurements
Intravascular ultrasound volumetric measures for patients with 10-month follow-up IVUS are shown in Table 4. Ten-month EEM, stent and lumen volumes were similar in the two groups.
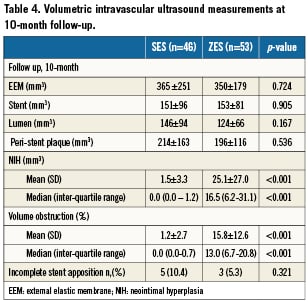
At 10-month follow-up no NIH could be detected in 33 (70%) of the SES compared with four (7.5%) of the ZES (p<0.001) patients. NIH volume (median interquartile range [IQR]: 0.0 mm3 [0.0-1.2] vs. 16.5mm3 [6.2-31.1], p<0.001), mean difference –23.6 mm3 (95% confidence interval [CI]: –31.5 to –15.8), p<0.001 and intimal volume obstruction (median [IQR]: 0.0% [0.0-0.7] vs. 13.0% [6.7-20.8], p<0.001) mean difference –14.7% (95% CI: –18.4 to –10.9), p<0.001 were significantly lower in SES compared with ZES (Figure 3). For insulin treated diabetic patient NIH volume (median IQR: 0.0% [0.0-1.9] vs. 16.4% [2.6-32.0], p<0.01) and volume obstruction (0.0% [0.0-1.0] vs. 13.8% [1.8-24.7], p<0.01) were significantly lower in SES treated patients. The same was seen in non-insulin treated diabetic patients where NIH volume (median IQR: 0.0% [0.0-0.4] vs. 16.5% [7.8-31.0], p<0.01) and volume obstruction (0.0% [0.0-0.3] vs. 12.1% [8.6-20.6], p<0.01) were significantly lower in SES compared to ZES treated patients.
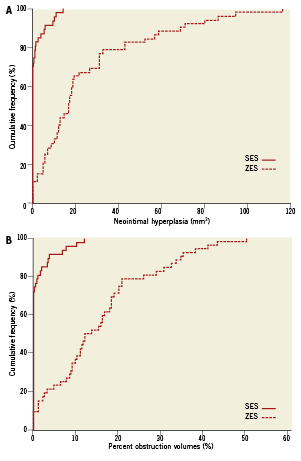
Figure 3. Cumulative distribution curve of (A) in-stent intimal hyperplasia volume at 10-month follow up, (B) percentage neointimal hyperplasia volume obstruction at 10-month follow-up.
At 10-month follow up incomplete stent apposition was observed in eight lesions (7.6%) (SES: n=5 [10.4%], ZES: n=3 [5.3%]: p=0.68). Incomplete stent apposition was seen in two patients presenting with STEMI (SES n=1 and ZES n=1) and two patients presenting with acute coronary syndrome (SES n=1 and ZES n=1) and the rest of the patients were treated for stable angina pectoris. Incomplete appositioned stent struts were not covered with neointimal hyperplasia.
Patterns of NIH distribution
NIH was covering 7.6±15.5% of the stent length in the SES group compared to 62.3±31.9% in the ZES stents (p<0.001) (median interquartile range: 0.0% [0.0-12.5] vs. 69.5% [35.7-92.3], p<0.001) mean difference –54.6% (95% CI: –64.9 to –44.4), p<0.001. Evaluating only stents with NIH, 27.1±18.3% of the stent length in the SES treated patients compared to 67.5±27.3% in the ZES treated patients (p<0.001) were covered. The analysis of the proximal and distal stent edges showed a significant difference between the two stent groups. NIH at the proximal stent edge was more often seen in Endeavor stents compared with Cypher stents (44.4% vs. 7.1%, p<0.001). The mean per cent NIH volume at the most proximal stent CSA was 16.7% in the Endeavor stent group compared with 0.8% in the Cypher stent group mean difference –15.4% (95% CI –31.9 to 0.16), p=0.052. At the distal stent edge NIH was more often seen in Endeavor stents compared with Cypher stents (33.3% vs. 4.8%, p<0.001). The mean percent NIH volume at the most distal stent CSA was 16.7% in the Endeavor stent group compared with 0.8% in the Cypher stent group (mean difference –9.5% [95% CI –14.6 to –4.3], p<0.001). Figure 4 demonstrates an example with diffuse intima hyperplasia involving the proximal stent edge.
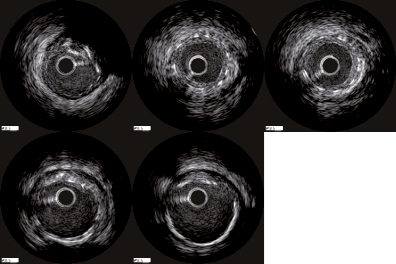
Figure 4. Example of in-stent intimal hyperplasia in an Endeavor stent: (1) proximal reference segment; (2) proximal stent edge with intimal hyperplasia; (3) mid stent with intimal hyperplasia; (4) distal stent edge; (5) distal reference segment.
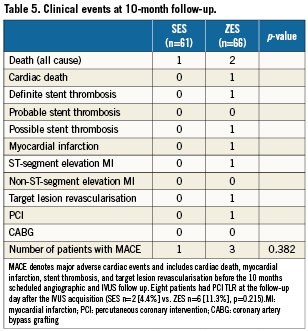
Clinical events
Ten-month clinical outcome were available in all patients (n=127, 100%). The incidence of major adverse cardiac events was low and did not differ in the two groups (Table 5). There was one definite stent thrombosis in the ZES group after 135 days. Three patients died during the follow-up period. One death was cardiac after 245 days, and thus a possible stent thrombosis.
Discussion
This is the first randomised multicentre angiographic and IVUS comparison of the SES versus the ZES in diabetic patients. We found that the NIH response differed between SES-treated and ZES-treated patients. Thus, the ZES generated more NIH, had more angiographic late lumen loss, and higher diameter stenosis at follow up compared to the SES.
Angiographic late lumen loss
In-stent late lumen loss reflects the degree of neointima formation and has been shown to correlate with development of restenosis after DES implantation19,20. In terms of late lumen loss, previous randomised angiographic studies in diabetic patients have shown a significant advantage in SES-treated patients compared to PES-treated patients.9-12 Similarly, the present study documented superiority of SES to ZES. In the ENDEAVOR II trial,21 the in-stent late lumen loss was 0.61±0.46 mm in the ZES-treated diabetic and non-diabetic patients, which is less than the 0.74±0.45 mm we found in our ZES-treated diabetic population. In the ENDEAVOR III trial,22 where only 30% of the patients had diabetes mellitus, the in-stent late lumen loss was 0.34±0.44 showing that diabetic patients have more late lumen loss than non-diabetic Endeavor stent treated patients.
Inhibitory effect on neointimal hyperplasia
The SES showed a significant inhibition of NIH compared with the ZES. No NIH could be detected by IVUS in 70% of the SES compared with 7.5% of the ZES. NIH is the main component of in-stent restenosis after stent implantation and reflects the degree of neointimal proliferation. 23 In the first DiabeDES trial13, where we compared the vascular response after SES or PES implantation; 24% of the Taxus stents were free from NIH and the median volume obstruction in PES was 7.5% compared to 13.0% in the ZES group in the present study. In SES treated patients the median volume obstruction was zero in both trials.13
The percent intimal free length of the stents, a measure of NIH homogeneity, measured 92.4% in the SES group compared to 37.7% in the ZES group. The NIH findings in the present study is concordant with the ENDEAVOR II24; III25,26 and IV27studies where percent NIH volume obstruction was 17.6%, 16.1% and 16.6%, respectively. In the TAXUS-I28, TAXUS-II29,30 and TAXUS-IV30 studies including diabetic and non-diabetic patients the NIH volume obstruction was 14.8%, 7.8% and 12.2%, respectively. In earlier IVUS studies the SES has been characterised by a near absence of measurable in-stent tissue23,31 after long term follow-up.32 The diabetic subpopulation in the RAVEL study33, the SES treated patients in the DIABETES Trial34, and the first DiabeDES trial showed a low percent IH volume obstruction, similar to the SES patients of the present study.13
The rate of clinical endpoints was low in both groups. A recent report from the Swedish Angiography and Angioplasty Registry35 showed that clinical restenosis in diabetic patients were twice as frequent in ZES than in the other DES types, in line with our finding of increased late lumen loss in after ZES implantation.
Limitations
Our randomised study requires scrutiny for using a surrogate endpoint for testing the efficacy of two different DES without being powered for clinical endpoints. Only percent NIH volume can be determined by follow-up IVUS. Percent NIH volume is a measure of efficacy, as detection of incomplete stent apposition; peri-stent remodelling and edge effects would require both post-implantation and follow-up IVUS. Angiographic in-stent late lumen loss, which was used, also only covers the stented segment and not the stent edges. A long term study with clinical follow up is needed in diabetic patients to confirm whether the differences in NIH translate into clinical outcome.
Conclusions
In diabetic patients, SES inhibited intima hyperplasia and reduced angiographic late lumen loss more effectively than the ZES.
Funding
The study was a pre-planned substudy of the SORT OUT III trial16 (Clinicaltrials.gov Identifier: NCT00660478). This work was supported by equal unrestricted grants from Medtronic and Cordis, Johnson & Johnson. Neither company had a role in study design or data collection, analysis, or interpretation. Neither had access to the clinical trial database or the opportunity to review the manuscript.
Conflict of interest statement
The authors have no conflict of interest to declare..