Abstract
Aims: Registry data have suggested higher than anticipated rates of scaffold thrombosis following bioresorbable vascular scaffold (BVS) implantation. We examined early neointimal growth and strut coverage in BVS to ascertain whether this was affected by clinical presentation.
Methods and results: Patients undergoing optical coherence tomography (OCT)-guided BVS implantation, either for stable angina (SA) or acute coronary syndrome (ACS), were recruited to this observational study. Repeat OCT was performed at follow-up (median 74 days), and scaffolds analysed at 1 mm longitudinal intervals for scaffold/flow area, scaffold apposition, neointimal growth and strut coverage. Twenty-nine BVS were included in the analysis (62% implanted following ACS). There were no differences in baseline patient/lesion characteristics. All BVS achieved >90% predicted scaffold area with only 1.64% of struts classified as incompletely apposed, compared with 0.47% at follow-up (p=0.006). Reductions in mean scaffold (–4.0%, p=0.01) and flow (–8.4%, p<0.001) areas were observed at follow-up, with larger reductions in mean flow area in stable patients (–14.5±14.2 vs. –4.9±7.9%, p=0.03). ACS patients had reduced neointimal growth (0.51±0.18 vs. 0.87±0.37 mm2, p=0.002), and increased percentage of uncovered struts (2.68±1.67 vs. 1.43±0.87%, p=0.015).
Conclusions: Early neointimal growth and strut coverage are reduced following ACS in patients receiving BVS. These results may, in part, explain the high rates of ST in registry data.
Abbreviations
BVS: bioresorbable vascular scaffold
CABG: coronary artery bypass grafting
DES: drug-eluting stents
ISA: incomplete scaffold apposition
MLA: minimal luminal area
MSA: minimal scaffold area
OCT: optical coherence tomography
PCI: percutaneous coronary intervention
SA: stable angina
Introduction
Bioresorbable scaffolds present a novel approach for the treatment of coronary artery disease. The Absorb bioresorbable vascular scaffold (BVS) revision 1.1 (Abbott Vascular, Santa Clara, CA, USA) is an everolimus-eluting bioresorbable polymeric scaffold1. BVS provide the established benefit of a metallic drug-eluting stent (DES), acute vessel support with associated drug delivery, but their unique composition permits full bioresorption. Theoretical long-term benefits include restoration of normal vasomotion, further repeat revascularisation, potential for non-invasive imaging and late lumen enlargement2.
Although clinical outcomes following BVS were excellent in early prospective studies3, recent registry data have shown higher than expected rates of scaffold thrombosis (ST) at six months4. The risk of ST may be influenced by a number of procedural and patient factors, including clinical presentation5. Indeed, percutaneous coronary intervention (PCI) for acute coronary syndrome (ACS) has been shown to increase the risk of early and late ST in DES6. This may be due to reduced strut coverage as a consequence of delayed or impaired healing7. Thus, implantation of a more biocompatible scaffold may facilitate neointimal growth and thereby increase strut coverage.
Optical coherence tomography (OCT) is an established intracoronary imaging technique that provides unparalleled imaging of the coronary arteries with high resolution (10-20 μm). OCT following BVS implantation provides accurate and reproducible data on measures of scaffold and vessel architecture8, permitting identification and quantification of scaffold underexpansion, incomplete strut apposition and neointimal formation9. The OCT substudy of ABSORB cohort B investigated 25 BVS implanted in a relatively simple lesion subset with the earliest follow-up at six months3. However, these patients presented with stable angina and there remain no studies assessing early neointimal growth and strut coverage in patients presenting with ACS.
In this study we sought to use OCT to examine early neointimal growth and strut coverage in patients undergoing BVS implantation for ACS or stable angina (SA) in a real-world setting. Additionally, we assessed temporal changes in scaffold expansion and flow areas, using existing definitions.
Methods
STUDY POPULATION AND PROCEDURAL DETAILS
Consecutive patients undergoing BVS implantation at a single centre, requiring further planned revascularisation for non-target, de novo, non-restenotic lesions were included in this non-randomised, observational study. Patients undergoing BVS implantation and not requiring further PCI during the study period were excluded. The indications for BVS implantation included age >18 years with either: 1) evidence of inducible ischaemia on non-invasive imaging or FFR <0.80 for patients with stable angina, or 2) symptoms associated with dynamic electrocardiographic changes and elevation of cardiac biomarkers. Culprit plaques in patients with ACS were defined by location of ECG changes combined with angiographic appearance (e.g., thrombus) at PCI. Contraindications included patients with a high risk of bleeding (including a history of gastrointestinal or urinary bleeding within six months, cerebrovascular accident within six months or intracranial haemorrhage at any time), inability to comply with 12 months of dual antiplatelet therapy, left main stem disease, saphenous vein graft disease or requirement for rotational atherectomy. A CONSORT flow diagram of the study is shown in Figure 1.
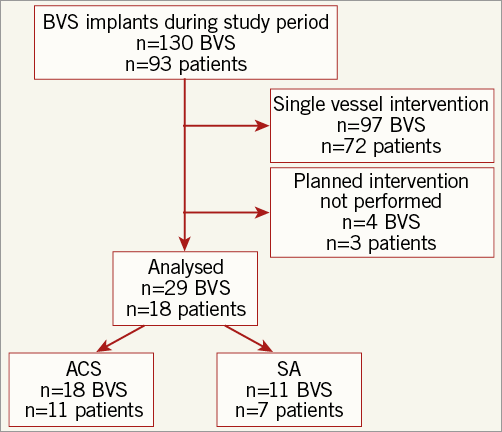
Figure 1. Study design.
All BVS implants were performed with OCT guidance (Dragonfly C7XR™; St. Jude Medical, St. Paul, MN, USA). Following administration of intracoronary glyceryl trinitrate, OCT imaging was performed and reference vessel diameter and area were measured <5 mm both proximal and distal to the shoulders of the diseased segment10 and these values used to guide BVS size selection. After scaffold deployment, OCT was used to identify underexpansion and incomplete scaffold apposition (ISA). This allowed post-dilation of the BVS where necessary. Post-dilatation was performed at the discretion of the operator. The target for OCT-guided deployment of the BVS was a mean scaffold area greater than 90% of the reference vessel area and minimal or no ISA. Implanted BVS were subsequently reassessed with OCT at the time of their non-target vessel planned PCI. Non-target, planned PCI is typically performed between eight and 12 weeks at our institution.
All patients were anticoagulated with 70-100 IU/kg of unfractionated heparin and received dual antiplatelet therapy (aspirin+either ticagrelor or clopidogrel at the operator’s discretion) for 12 months after implantation, with aspirin 75 mg daily to continue indefinitely. All received standard post-PCI care including statins, beta-blockers and angiotensin-converting enzyme inhibitors, where appropriate.
QUANTITATIVE CORONARY ANGIOGRAPHY
Quantitative coronary angiography (QCA) analysis was performed on angiographic images using CAAS 5.10.2 software (Pie Medical Imaging BV, Maastricht, The Netherlands). For each patient, the treated and peritreated regions (defined as a length of 5 mm proximal and distal to the scaffold edge) were analysed. Measurements were taken for the minimal luminal diameter, reference vessel diameter, minimal luminal area and reference vessel area as calculated by the interpolation method.
OPTICAL COHERENCE TOMOGRAPHY ANALYSIS
Analysis of OCT data was performed offline on a LightLab Imaging workstation (St. Jude Medical). Scaffold OCT measurements were performed at 1 mm longitudinal intervals, starting at the first proximal frame where BVS struts encircled (360°) the luminal contour. This methodology allowed accurate co-registration between baseline and follow-up OCT pullbacks. Regions where scaffolds overlapped with another BVS or a metallic stent were excluded. Minimal luminal area (MLA) was calculated for each lesion, while reference vessel area and diameter were calculated by averaging proximal and distal reference measurements11.
As polymeric struts appear as a dark core surrounded by a light border on OCT (Figure 2), the border may become indistinguishable from surrounding tissue on follow-up images following neointimal growth. For this analysis, a strut was defined as covered when strut thickness was >150 μm on the follow-up OCT images12 (Figure 3). The strut core area was the combined area of the dark core of each strut seen in the frame both at baseline and follow-up. The strut area, only assessed at baseline, was the area bounded by the light border for all struts seen in the frame. For apposition, struts were considered incompletely apposed when >50% of the abluminal strut surface was not in contact with the endoluminal surface or over side branch vessels3. Incomplete scaffold apposition area was defined as the area delineated by the endoluminal contour of the vessel and the abluminal surface of any incompletely apposed struts.
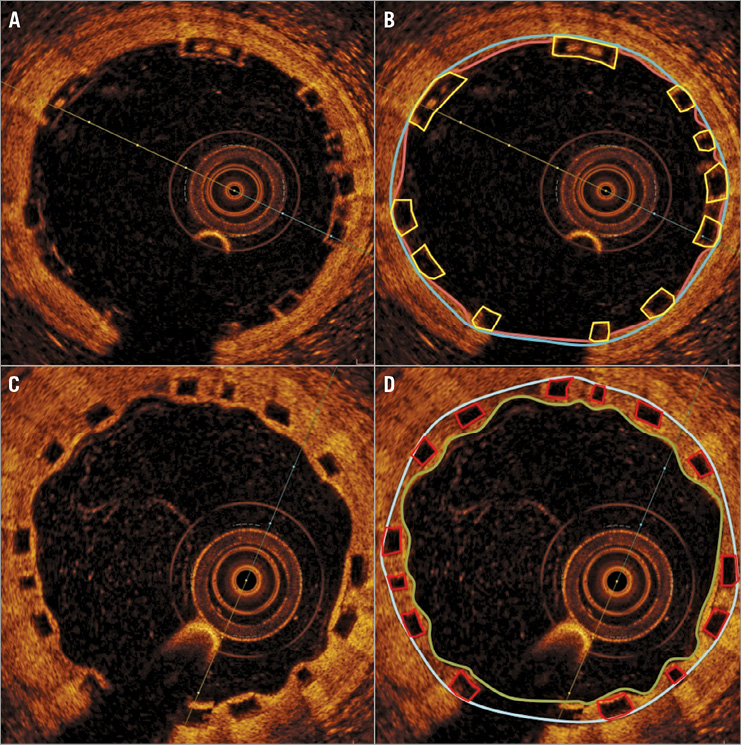
Figure 2. Measures of scaffold and flow areas. Implanted scaffold at baseline (A) with corresponding frame measurements (B). Scaffold area is defined as the area enclosed by the blue line, with luminal area bounded in pink. Differences between these areas can result from prolapse of the vessel wall between struts. Flow area is obtained by subtracting the strut area (enclosed in yellow) from the luminal area. Follow-up images of the scaffold (C) with corresponding measures (D). The luminal area is bounded by the green line and is equal to flow area in the absence of intraluminal defects, such as thrombus or incompletely apposed struts (Figure 3). The scaffolded area is enclosed by the blue line. The neintimal growth area is obtained by subtracting the luminal area and the strut core area (in red) from the scaffolded area.
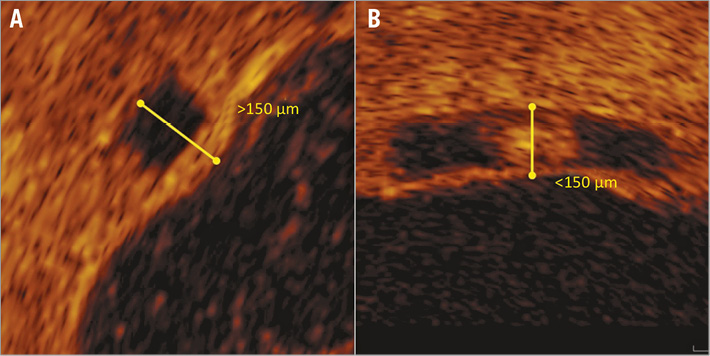
Figure 3. Assessment of strut coverage. A single BVS strut seen at follow-up (A), where the distance from the abluminal surface of the dark core to the endoluminal surface is >150 μm (yellow line), meaning the strut is covered. In an uncovered strut (B), the same measurement is <150 μm.
Measures of scaffold expansion and flow areas were also performed on each frame, including scaffold area, luminal area, flow area and neointimal growth area (Figure 2). Scaffold area was defined as the area enclosed by an interpolated line connecting the midpoint of the abluminal sides of the dark strut core area to each other. At baseline, this area is identical to the luminal area, except when there is either plaque prolapse visible between struts (quantified as prolapse area) or ISA. Measures of adequate scaffold expansion at baseline included percentage residual area stenosis (1–[minimal flow area/reference vessel area]×100) and both mean and minimal scaffold area (MSA), being compared with average reference vessel area. Additionally, both scaffold eccentricity index and scaffold symmetry index were calculated, based on previous definitions13. Flow area was defined as the area of the vessel occupied by blood, being a derived measure (Figure 4). At baseline, flow area was calculated as (luminal area–[intraluminal strut area+intraluminal defects]), while at follow-up it was calculated as (luminal area–intraluminal defects). The luminal area follows the endoluminal contour of the vessel and at baseline includes scaffold struts. Thus, flow area is the most comparable measure between baseline and follow-up3. Neointimal growth area at follow-up is calculated as (scaffold area–[luminal area+strut core area]). The mean prolapse area at baseline is subtracted from the mean neointimal growth area to provide a corrected neointimal growth area, on a per scaffold basis.
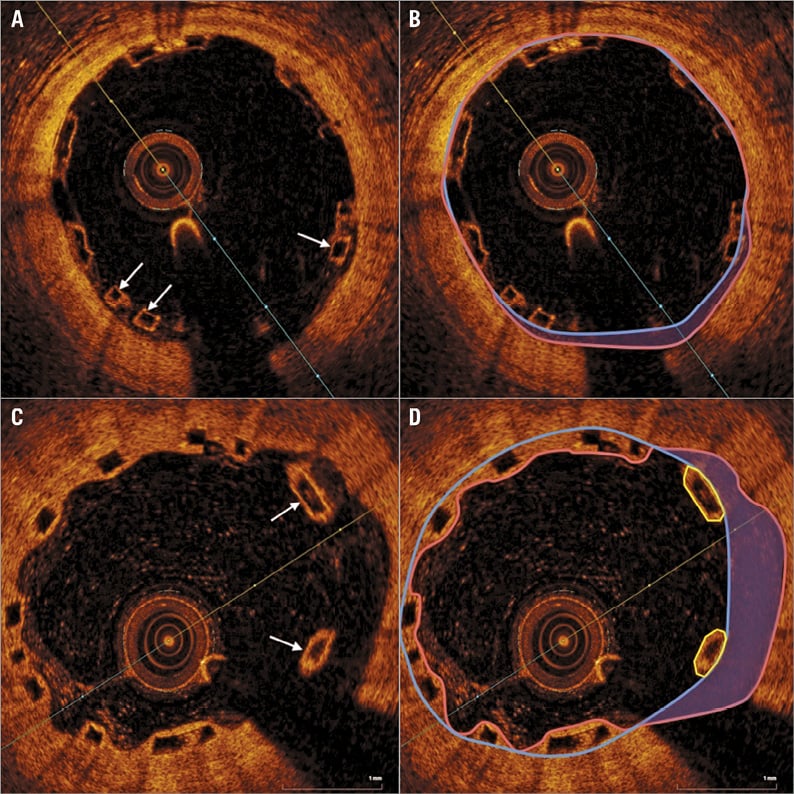
Figure 4. Incomplete scaffold apposition at baseline and follow-up. At baseline (A), struts are incompletely apposed (arrows). Panel B shows the ISA area shadowed in purple with the luminal area enclosed within a pink line. Flow area includes ISA area. At follow-up (C), incompletely apposed struts are seen (arrows). Flow area again includes the shadowed ISA area (D), with the incompletely apposed strut area (enclosed within yellow lines) subtracted from luminal area to calculate flow area.
STATISTICAL ANALYSIS
Continuous, normally distributed variables are expressed as mean (SD) and compared using the Student’s t-test, while non-normally distributed data are expressed as median (Q1-Q3) and compared using the Mann-Whitney U test. Categorical variables are expressed as counts (percentage) and compared using Fisher’s exact test. Power calculations based on existing data3 suggested a sample size of 11 scaffolds per group to detect a 25% reduction in neointimal growth area (α=0.05, β=0.8). All calculations were two-tailed with p<0.05 being considered statistically significant. All analyses of scaffold measures were performed on a “per scaffold” basis, unless otherwise stated. All statistical analyses were performed in SPSS, Version 22.0 (IBM Corp., Armonk, NY, USA).
Results
PATIENT AND PROCEDURAL DEMOGRAPHICS
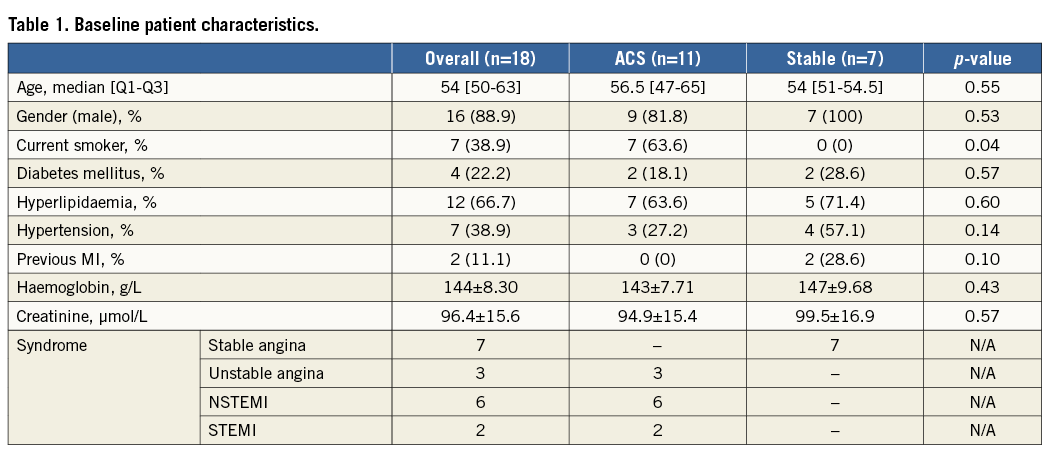
During the study period 130 BVS were implanted. Twenty-nine BVS implanted in 18 patients were included in the study. One hundred and one patients who did not return for a planned, staged procedure were excluded from the analysis. The baseline patient characteristics are presented in Table 1. Patients were predominantly male (88.9%) with a median age of 54 (50-63) years. Follow-up OCT imaging was performed at a median of 74 (61-89) days. No major adverse cardiovascular events, including ST, were reported during the study period.
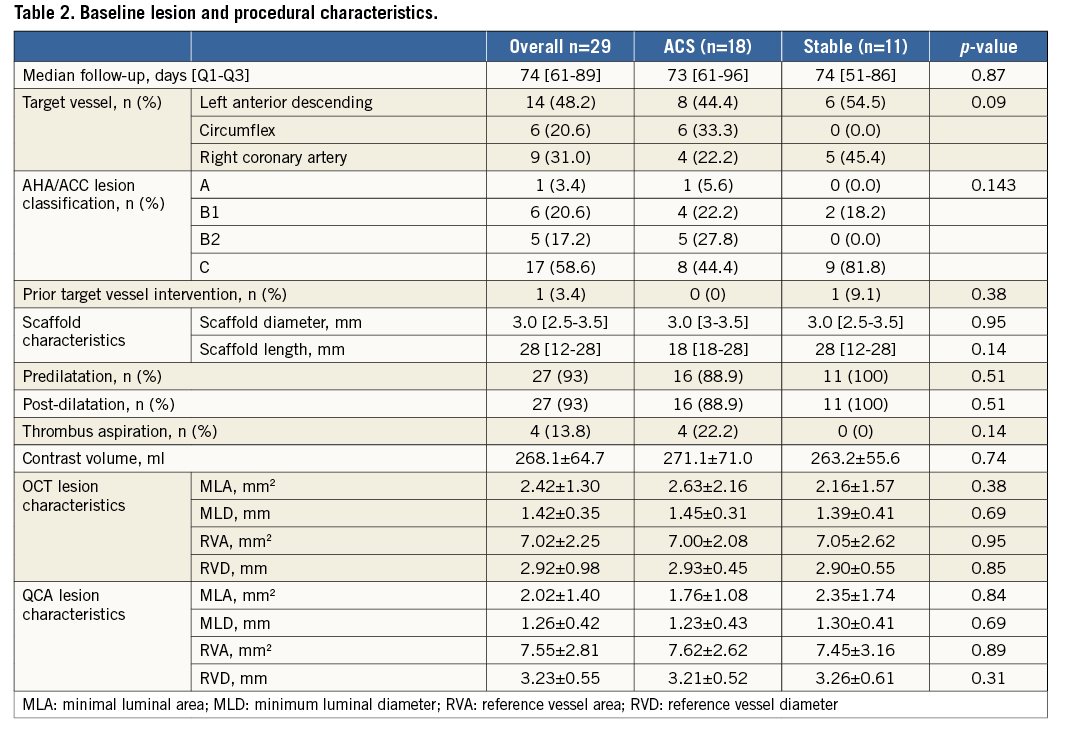
Full details of the baseline procedural and lesion characteristics are presented in Table 2. The median implanted scaffold diameter was 3.0 (2.5-3.5) mm, with a length of 28 (12-28) mm. On OCT, lesion MLA was 2.42±1.30 mm2 with the reference vessel area being 7.02±2.25 mm2. Patients presenting with STEMI (two) contributed four lesions (22%) to the analysis, those presenting with NSTEMI (six) contributed 10 lesions (56%), whilst those presenting with unstable angina (three) contributed four lesions (22%).
Overall, 1,339 OCT frames were analysed (670 frames at baseline, 669 at follow-up), identifying 10,253 BVS struts (5,002 at baseline, 5,251 at follow-up). There was no significant difference between the number of struts per scaffold at baseline and follow-up (172.5±44.6 vs. 181.1±55.6, p=0.13).
ASSESSMENT OF SCAFFOLD IMPLANTATION
OCT measures immediately following BVS implantation are presented in Table 3. Minimal scaffold area at baseline was 98.8% of the reference vessel area, with all BVS having a mean scaffold area >90%. Only one patient had evidence on OCT imaging of a distal edge dissection. This was treated with a second BVS. Post-deployment scaffold eccentricity index was 0.88±0.03 and symmetry index 0.19±0.06, demonstrating excellent and symmetrical scaffold expansion. Acute gain was 1.85±0.47 mm with no significant difference between ACS and stable cohorts (1.86±0.52 vs. 1.84±0.42 mm, p=0.93).
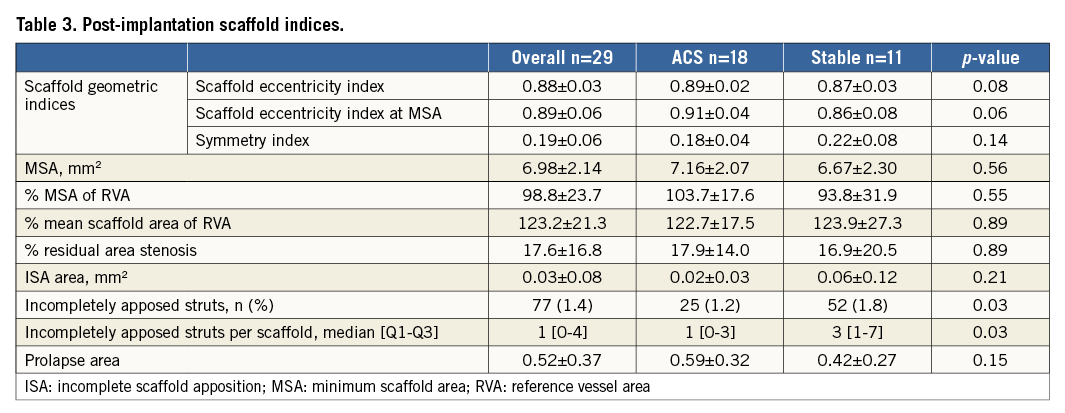
Rates of ISA at baseline were low, with only 77 (1.64%) struts classified as incompletely apposed. The number of incompletely apposed struts per scaffold ranged between 0 and 19 (median 1 [0-4]) with 10 (34.5%) scaffolds displaying no evidence of ISA. The number of incompletely apposed struts was lower in ACS (25 vs. 52 struts, p=0.03), although ISA area was similar (p=0.21).
TEMPORAL CHANGES IN SCAFFOLD AND FLOW MEASURES
Changes in scaffold and flow areas between baseline and follow-up in the overall population (n=29), regardless of ACS or SA presentation, are presented in Table 4. Overall, there were significant reductions in mean and maximal scaffold area between baseline and follow-up, with corresponding reductions in mean (–8.4%, p<0.001) and maximal (–9.3%, p<0.001) flow areas (Figure 5). The reduction in mean flow area was more prominent for patients with SA (–14.5±14.2 vs. –4.9±7.9%, p=0.03). However, minimal scaffold area was not significantly reduced (–3.4%, p=0.23) and was similar between ACS and SA patients (p=0.21). Overall lumen loss at follow-up was 0.09±0.19 mm. Lumen loss was not significantly different between ACS and stable cohorts (0.09±0.21 vs. 0.11±0.18 mm, p=0.88).
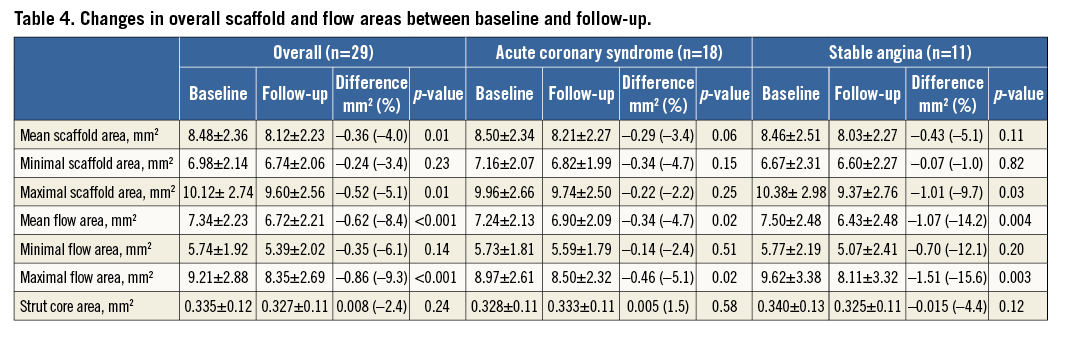
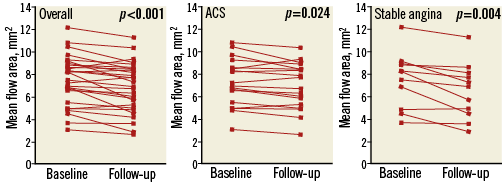
Figure 5. Change in mean flow area between baseline and follow-up. Change in mean flow area between baseline and follow-up for every scaffold in the analysis (A), separated into those patients with acute coronary syndrome (ACS) (B) and stable angina (C).
Of the 19 (66%) scaffolds which exhibited ISA at baseline, only 8 (27.5%) had ISA at follow-up. One additional scaffold had acquired ISA at follow-up. The percentage of incompletely apposed struts between baseline and follow-up reduced (1.64 vs. 0.47%, p=0.006), although ISA area did not change (0.03±0.08 vs. 0.04±0.10 mm2, p=0.93). There was no difference in the number of incompletely apposed struts between ACS and SA patients (0.4 vs. 0.6%, p=0.58).
NEOINTIMAL GROWTH AND STRUT COVERAGE
Neointimal growth was 1.17±0.35 mm2, reducing to 0.65±0.32 mm2 when corrected for baseline tissue prolapse in the overall population studied. In total, 114/5,251 (2.17%) struts remained uncovered, with 0-14 (median 2 [1-5]) uncovered struts per scaffold. However, there were clear differences in neointimal growth between patient cohorts, as shown in Table 5. BVS implanted in ACS had reduced neointimal growth (0.51±0.18 vs. 0.87±0.37 mm2, p=0.002), resulting in an increase in the percentage of uncovered struts (2.68±1.67 vs. 1.43±0.87%, p=0.015) (Figure 6).
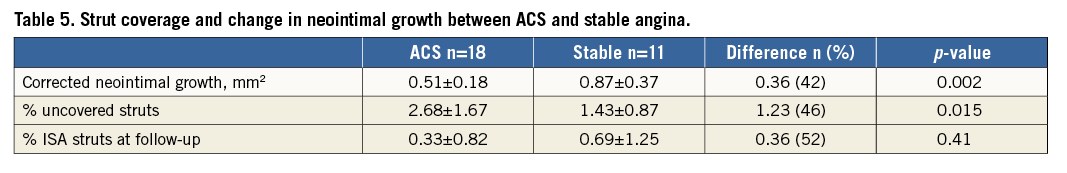
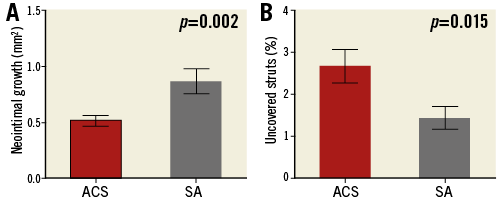
Figure 6. Neointimal growth area and strut coverage in ACS versus SA. Neointimal growth (A) and strut coverage (B) in patients presenting with acute coronary syndrome (ACS) and stable angina (SA).
Discussion
In this study we sought to examine early neointimal growth in patients undergoing OCT-guided BVS implantation for either ACS or SA in a “real-world” population. In both cohorts we found that OCT guidance was associated with excellent measures of BVS expansion and low rates of ISA immediately following implantation. At early follow-up, mean and maximal scaffold/flow areas were reduced, with the largest reductions seen in patients presenting with SA. Neointimal growth was significantly reduced in ACS compared with SA, leading to a greater percentage of uncovered struts at follow-up. These data suggest that reduced neointimal growth occurs following ACS presentation, despite a more biocompatible device being utilised and implanted under optimal conditions.
We found that OCT-guided BVS implantation was associated with excellent measures of scaffold expansion and that the percentage of incompletely apposed struts immediately post deployment was lower than previous studies examining BVS implanted under angiographic guidance14. These measures are effectively surrogates for implantation technique and suggest that the BVS in our population were optimally delivered. Although the clinical implications of post-implantation ISA remain debated, incomplete device expansion is a determinant of ST5 and ISA often coexists. The polymeric construct of the BVS precludes aggressive post-dilatation and oversizing; therefore, BVS selection and aggressive predilatation are critically important for optimal BVS expansion15 when compared with metallic stents. Our data demonstrate that this can be achieved using OCT guidance and high rates of pre/post-dilatation, potentially leading to improved clinical outcomes. The importance of optimal BVS implantation was recently highlighted in a series of cases of BVS thrombosis, with both early underexpansion and malapposition being commonly observed16.
Patients presenting with ACS are known to be at an increased risk of ST at long-term follow-up17. The mechanisms for ST in this patient cohort are diverse, but probably include delayed arterial healing, lack of strut endothelialisation, and an ongoing pro-inflammatory and thrombogenic state, coupled with enhanced platelet reactivity18. Our findings of reduced neointimal growth following ACS presentation are consistent with previous studies in metallic DES, which have shown delayed healing after myocardial infarction7. Although the drug coating of stents is intended to inhibit proliferation and migration of vascular smooth muscle cells, it may also increase tumour necrosis factor-α expression in endothelial cells, resulting in a more pro-thrombotic environment18. Furthermore, the high affinity of these lipophilic antiproliferative agents for the lipid-rich, necrotic core of ACS ruptured plaques ensures chronic retention of the drug in the arterial tissue19,20. These observations may also go some way to explaining the increased ST rates in the GHOST-EU registry, where around 47% of patients received BVS following ACS4.
In our study we found a relative increase in the percentage of uncovered struts observed at 74 days in patients presenting with ACS (2.68±1.67 vs. 1.43±0.87%, p=0.015). However, strut coverage is an ongoing process linked to vessel healing and re-endothelialisation, which has the potential to improve with the passage of time. Previous studies in patients with stable angina who underwent implantation of BVS revision 1.1 support this concept, showing that only around 1% of BVS struts remained uncovered at six months14. Nevertheless, experience in metallic DES should inform us that “full” coverage cannot be guaranteed in all patients, with uncovered struts still observed up to two years following DES implantation21. Thrombus initiation is considered a highly localised event and so, whilst the absolute number of uncovered struts observed in our study may be small, these regions may still have the potential to produce ST. The clinical significance of these findings may be more important in patients presenting with ACS, who are known already to be at a higher risk of both early and late ST6. Although our results should only be considered hypothesis-generating, they suggest that BVS implantation following ACS should only be considered if dual antiplatelet therapy can be adequately maintained.
Study limitations
Although significant efforts were made to co-register OCT pullbacks at baseline and follow-up, small longitudinal mismatches may inevitably have occurred that might have affected the overall results. Results have been analysed on a “per scaffold” basis to ensure these mismatches do not affect the outcome. OCT analysis was performed every 1 mm throughout the scaffolded segment, potentially missing very small areas of ISA or uncovered struts. However, previous OCT studies have frequently used this methodology14, and there are no existing data to suggest a more detailed analysis would have produced different results. Whilst neointimal growth is the most likely cause for strut coverage at follow-up, other mechanisms for strut coverage may exist, including fibrin deposition, and the ability of OCT to discriminate between these tissue types is limited. Finally, this was a non-randomised, observational study of a small number of patients who had already received a BVS at their index procedure. The nature of patients requiring further revascularisation may have introduced a selection bias to the study. The final results should therefore be interpreted in this light and be considered hypothesis-generating, with the clinical relevance determined by future studies.
Conclusions
Neointimal coverage is reduced at early follow-up in patients undergoing BVS implantation for ACS, despite optimal scaffold deployment. These results are hypothesis-generating but are consistent with previous studies on DES, and suggest that recommendations for dual antiplatelet therapy following BVS implantation should continue to follow regimens for metallic DES at the present time.
| Impact on daily practice Even after optimal BVS implantation using OCT guidance, neointimal growth is reduced in patients with ACS in a similar fashion to findings documented for metallic DES. Clinicians should therefore be as wary of early cessation of dual antiplatelet therapy for BVS as they would be for metallic DES, as vessel healing may be incomplete, potentially increasing the risk of ST. |
Conflict of interest statement
N. West has acted as a consultant for Abbott Vascular. S. Hoole has acted as a consultant for St. Jude Medical and Abbott Vascular. The other authors have no conflicts of interest to declare.