Introduction
Fully bioresorbable everolimus-eluting vascular scaffolds (BVS; Abbott Vascular, Santa Clara, CA, USA) are a novel approach to treating coronary lesions. The ABSORB cohort A and cohort B trials investigated the implantation of 3 mm BVS, up to a maximum length of 18 mm, in simple lesions only.1,2 The implantation of overlapping BVS in longer lesions has not previously been reported.
Although the initial results in ABSORB cohort A were very promising, it was found that the main limitation of the BVS (BVS 1.0) was a premature reduction in radial strength.3-7 Through several design modifications, primarily aimed at maintaining the structural integrity of the BVS for longer, excellent results were obtained in ABSORB cohort B at six months.8-10 This second generation BVS (BVS 1.1) is now the subject of a large, international, multicentre, ABSORB EXTEND single arm study with the aim of recruiting over 1,000 patients from over 50 centres worldwide. As part of this study, a 50 patient substudy will be conducted to assess the outcomes of overlapping BVS in the treatment of long lesions, with the use of optical coherence tomography (OCT) at both baseline and follow-up.
Firstly, we report our initial experiences of the different types of overlap achievable with the BVS through implantation in an in vitro phantom model followed by 2-dimensional (2D) and 3-dimensional (3D) OCT imaging (frequency domain OCT [FD-OCT]). Secondly, we report our experiences of some of these overlap methodologies in a healthy porcine coronary artery model at 28 and 90 days to assess the neointimal response and strut coverage. Thirdly, we report our initial findings in humans from four of the first five patients to have had implantation of overlapping BVS from the ABSORB EXTEND single arm study. Baseline angiographic, intravascular ultrasound (IVUS), 2D and 3D FD-OCT reconstructions of the varying types of overlapping BVS will be demonstrated. Lastly we report our revised OCT methodology protocol for the assessment of the overlapping BVS at baseline and subsequent angiographic and OCT follow-up, in order to assess the coverage of the overlapping BVS. Since the overlapping BVS segment area is highly complex, the standard OCT assessment of the BVS, which has previously been performed in the ABSORB cohort A and B trials,3,7,10 is not possible and a new methodology is therefore required.
BVS
The BVS revision 1.1 (Figure 1) is a balloon expandable device consisting of a polymer backbone of Poly-L (racemic)-lactide (PLLA) coated with a thin layer of a 1:1 mixture of an amorphous matrix of Poly-D, L (racemic)-lactide (PDLLA) polymer, and 100 micrograms/cm2 of the anti-proliferative drug everolimus. The PDLLA allows for the controlled release of everolimus, 80% of which is eluted within the first 30-days. The elution rate, tissue concentration and dose density of everolimus are similar for both the BVS and the XIENCE V everolimus-eluting stent (EES). Both PLLA and PDLLA are fully bioresorbable. The polymer is degraded via hydrolysis of the ester bonds in the backbone. The resulting poly-lactide low molecular weight oligomers eventually leave the polymer matrix and are hydrolysed and metabolised through the pyruvate and Kreb energy cycles in the surrounding tissues and blood. Small particles, less than 2 µm in diameter, are phagocytosed by macrophages. According to preclinical studies, the time for complete bioresorption of the polymer backbone is approximately two years.9
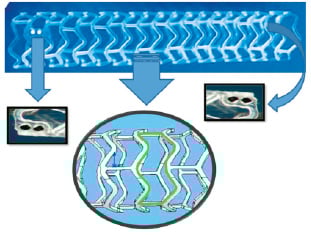
Figure 1. The BVS 1.1 device. Two platinum markers can be seen clearly on the left side; the corresponding platinum markers on the other side of the BVS 1.1 are located posteriorly. The green zone represents the cell area which was reduced in size during the design modification from BVS 1.0 to 1.1.
Two platinum markers (Figure 1) located at each BVS edge allows for the accurate visualisation of the radiolucent BVS during coronary angiography and OCT. The cell area in the pattern of the BVS was reduced in size during the design modification from BVS 1.0 to 1.1 in order to give maximum and more uniform support to the vessel wall (Figure 1)8.
Bench testing (in vitro phantom model) and implantation in a porcine model
Bench testing
A commercially available OCT M2 system (ImageWire™; LightLab Imaging Inc., Westford, MA, USA) was used for imaging. The OCT probe was stripped down with the removal of the fibre-optic imaging core (150 microns in diameter) from the OCT probe. The fibre-optic imaging core was subsequently directly inserted into the guidewire lumen of the BVS deployment catheter. This helped to maintain the near perfect central position of the imaging core within the phantom model, with the consequential benefits of avoiding potential imaging artefacts.
A perspex (Plexiglas®) tube with an internal diameter of 3.5 mm and filled with contrast, kept at a temperature of 37 degrees Celsius to approximate human body conditions, was used as the phantom model to bench test the overlapping BVS. The transparent nature of the phantom model allowed us to directly visualise the longitudinal position of the imaging core of the OCT probe relative to the overlap of the BVS struts, thereby allowing the acquisition of cross-sectional 2D OCT images of the entire overlap region (online moving image). The cross-sectional images of the overlapping BVS struts were acquired at 15.4 frames/sec, with the fibreoptic imaging core being pulled back at a speed of 0.1 mm/sec.
Overlapping 3.0 mm diameter BVS, 18 mm in length, were implanted in the phantom model in three different overlapping configurations (described below) to best replicate the types of overlap that could potentially be achieved in human implantation.
“Interdigitating or adjacent positioning struts without overlap” of two adjacent BVS (Figures 2A-2D): this involved the near perfect positioning of the two BVS devices adjacent to each other, through very careful positioning of the platinum markers so that they were sited side by side, with each BVS virtually “slotting” into the other. As illustrated, 2D and 3D OCT imaging showed the uniform distribution of struts without gap or “stacking” of struts.
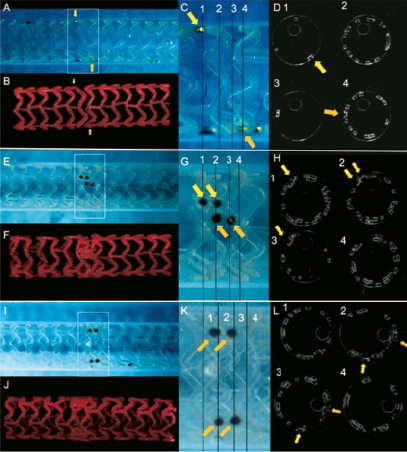
Figure 2. Outer appearances of the overlapping BVS in a phantom model (A, E and I), 3D reconstruction of OCT (B, F, J), magnified image of outer appearances (C, G and K) and corresponding cross-sectional OCT images (D, H and L) are presented. Yellow arrows indicate platinum marker positions. The upper panel represents “inter-digitating” or “adjacent positioning” of the BVS without overlap. The middle and lower panels represent the two differing forms of “complete overlap” that can be achieved. Note in the lower panel, there are a reduced number of stacked struts as compared to the middle panel –this is because in the lower panel, the platinum markers are positioned at 90 degrees to each other, this causes the majority of the overlapped struts to be positioned in the cell area between the struts rather than being stacked on top of each other.
“Complete overlap with multiple numbers of stacked struts” of two adjacent BVS (Figures 2E-2H): OCT imaging shows struts clearly overlapped and completely superimposed on each other (“stacked struts”) thereby forming a total strut thickness of at least 300 microns in these stacked strut regions. In the phantom model, this kind of overlap was achieved through the overlapping of the platinum markers as demonstrated (Figures 2E and 2G).
“Complete overlap with reduced numbers of stacked struts” of two adjacent BVS (Figures 2I-2L): this was a standard overlap with rotation of the BVS platinum markers so that they were positioned 90 degrees to each other. This allowed an overlap, but reduced the number of stacked struts, as many of the would be overlapping struts in one BVS tended to slot into the cell space between the strut of the other BVS. Using this approach, most of the BVS strut thicknesses at the overlap were maintained at 150 microns, with fewer areas with stacked struts. In the phantom model, this kind of overlap was achieved through the positioning of each of the BVS markers at right angles to each other.
Implantation in an animal model
From the benchwork experimentations, we elected to test in a non-diseased porcine coronary artery model the two types of complete overlap achievable that best represented single or stacked strut appearances.
Overlapping BVS were implanted in the coronary arteries of healthy swine. After 28 and 90, days the segments implanted with overlapped BVS were harvested and scanning electron microscopy undertaken. Results indicated that in the complete overlap with multiple stacked struts, each with a thickness of at least 300 microns, (Figure 3A) there was a somewhat delayed endothelialisation at 28 days. Conversely, in the complete overlap with reduced number of stacked struts, thereby minimising the thickness of struts with a thickness of 300 microns with most struts having a thickness of 150 microns, endothelialisation appeared to be almost complete at 28 days (Figure 3B). At 90 days however, all forms of the overlap tested in the porcine model were fully covered and endothelialised (Figure 3C).
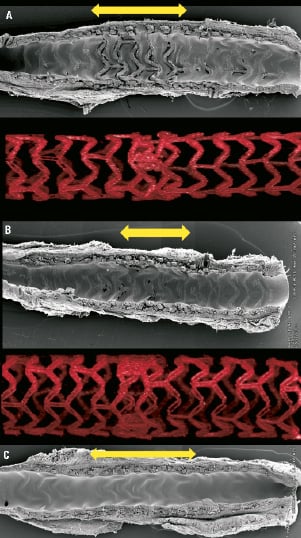
Figure 3. Scanning electron microscopic images acquired from healthy porcine coronary models representing the two forms of complete overlap of BVS. Delayed endothelialisation at 28 days is seen with multiple numbers of stacked struts at the overlap (corresponds to Figure 2E-2H) (a). Almost complete endothelialisation at 28 days is seen with reduced numbers of stacked struts at the overlap (corresponds to Figure 2I-2L) (b). However at 90 days complete endothelialisation was seen with both overlapping types (c). Yellow arrows indicate overlapped segments.
Replicating the forms of bench-tested overlapping BVS in humans
Trying to intentionally achieve any of the three overlapping BVS we have bench-tested during conventional percutaneous coronary intervention (PCI) is highly difficult and is more likely to occur by chance. With the “interdigitating” or adjacent positioning of BVS during conventional PCI, the main risk is leaving a gap (“geographical miss”)11 between the BVS with the consequential risk of restenosis. With the other two techniques, either type of complete overlap will occur only by chance as the markers need to be positioned at 90 degrees to each other in order to reduce the number of stacked struts, something that would be practically unachievable during conventional PCI.
Implantation in humans - case examples from the ABSORB EXTEND single arm study
Case 1: “Complete overlap with multiple number of stacked struts” (Figure 4)
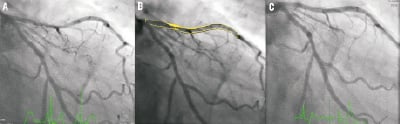
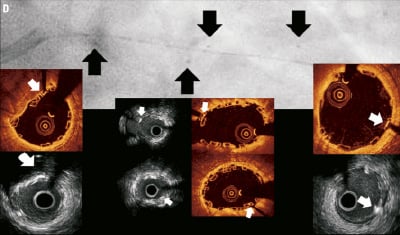
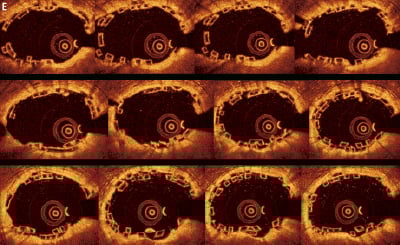
Figure 4. Case 1: “Complete overlap with multiple stacked struts” Coronary angiography revealed a long lesion in the proximal-mid LAD (A), interpolated RVD at MLD of 2.3 mm (B) and the final angiographic result post overlapping BVS implantation (C). OCT and IVUS identified the proximal, overlapping and distal platinum markers (D) - black arrows indicate the position of the markers seen on coronary angiography and white arrows the position of the markers seen on OCT and IVUS imaging. Consecutive OCT images across the overlap (pullback speed 20 mm/sec) (E) reveals multiple configurations of struts with numerous stacked struts seen.
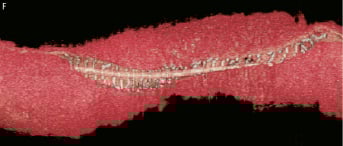
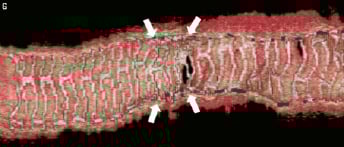
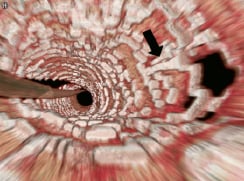
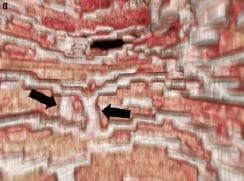
Figure 4 (cont). Three-dimensional volume rendered images of OCT images of the vessel, with guidewire shadow (F), internal longitudinal view of the vessel showing the 4 mm overlap (G), a fly-through view (proximal-distal) of the vessel at the overlap (H) and a close up view of the vessel wall at the area of overlap (I). White arrows (G) represents the edge of each respective overlapping BVS, note the side branch (septal branch) which marks the location of one end of the overlap in all views. Black arrows (H, I) represents the overlap in the fly-through view.
A 66-year-old gentleman presented with stable angina (Canadian Cardiovascular Society angina Class II), he was an ex-smoker and had no other comorbidities. Coronary angiography demonstrated a significant long lesion, of at least 24 mm in length, in the proximal LAD, with quantitative coronary angiography (QCA) revealing an interpolated reference vessel diameter (RVD) at the minimal lumen diameter (MLD) of 2.33 mm. Proximal and distal Dmax of the intended implantation site were 2.50 mm each, which made this vessel suitable for implantation with two overlapping 3×18 mm BVS devices.12 Predilatation was undertaken with a 2.5 mm balloon and two overlapping 3×18 mm BVS were implanted with at least 4 mm of overlap. Mild under-deployment of the BVS at the overlap was noted (Dmin 2.35 mm of deploying balloon) which required post-dilatation with the BVS deploying balloon to higher pressures. Post-implantation, IVUS and OCT imaging were carried out. Off-line 3D reconstruction and volume rendering of the OCT images were undertaken (INTAGE Realia; KGT, Tokyo, Japan), the methodology of which has previously been described.13 As illustrated, the IVUS and OCT imaging clearly shows the complete overlap with multiple stacked struts as previously demonstrated in the bench and animal model.
A further example of complete overlap with multiple stacked struts is illustrated online (online Appendix).
Case 2: “Combination of interdigitating and complete overlap” (Figure 5)
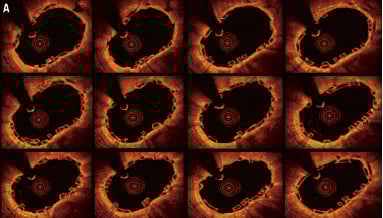
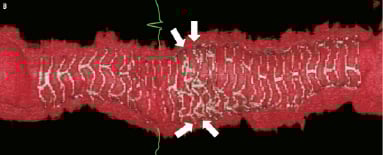
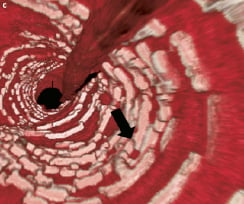
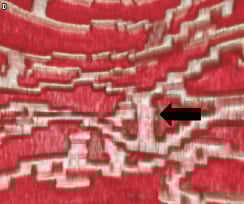
Figure 5. Case 2: Combination of “complete overlap” and “interdigitating struts without overlap.” Consecutive OCT images across the overlap (pullback speed 20 mm/sec) (A) showing overlapping BVS struts with a small number of stacked struts. Longitudinal view of the vessel in 3D OCT (B). White arrows show the edge of each BVS with “interdigitating struts” at the upper margin and “complete overlap” at the lower end with the struts positioned in the cell area of the other BVS thereby reducing the number of stacked struts. Virtual fly-through view (proximal-distal) (C) with black arrow indicating overlapped segment and a close up view of the overlap (D) with black arrow indicating same position of overlap. The guidewire can clearly be seen (B). Note the “drop-out” in the strut resolution to the left of the overlap (B), this is an artefact due to a premature cardiac beat, a potential problem when slower pullback speeds of the FD-OCT probe are used.
A 78-year-old male presented with stable angina (Canadian Cardiovascular Society angina Class III). He was an ex-smoker with no other risk factors. Coronary angiography demonstrated asingle lesion in the obtuse marginal vessel, 14 mm in length with a 90% diameter stenosis (RVD 2.5 mm). Predilatation with a2×15 mm balloon was performed without complication and a3.0×18 mm BVS was deployed. Because of incomplete lesion coverage after initial BVS deployment, a second 3.0×18 mm BVS was deployed more distally overlapping with the first. No post-dilatation was performed and the patient made an uneventful recovery.
The area of overlap was calculated to be 2.7 mm by 2D OCT and when visualised on 3D OCT, the upper portion of the overlap appeared to be “interdigitating” and the lower part appeared to be completely overlapping with the struts of one BVS positioned within the cells of the other BVS (Figure 5B), thereby reducing the number of stacked struts.
Case 3: “Adjacent positioning of the BVS with minimal overlap” (Figure 6)
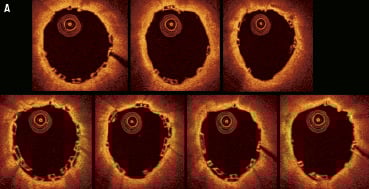
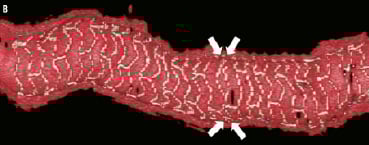
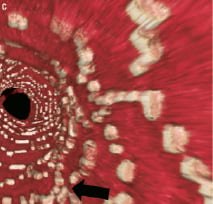
Figure 6. Case 3: BVS with minimal (0.5 mm) overlap. Consecutive OCT images across the overlap (pullback speed 20 mm/sec) (A). The OCT images show a few stacked struts in 4-5 OCT frames only. Longitudinal section of the vessel (B), white arrows show the edge of each BVS positioned with approximately 0.5 mm of overlap. Fly-through view (proximal-distal) (C) with black arrow indicating the minimal overlapped segments.
A 74-year-old female, with a history of hypertension and a previous myocardial infarction four months previously, presented with unstable angina (Braunwald Classification Class II). Coronary angiography identified a single lesion in the proximal RCA, 27 mm in length with a maximum of 90% diameter stenosis (RVD 2.8 mm) and TIMI 1 flow. Predilatation was successfully performed with a 2×20 mm balloon and two overlapping BVS (3.0×18 mm) were subsequently deployed in the proximal RCA (maximum pressure 14 atm). No post-dilatation was performed.
2D and 3D OCT appeared to show an example of adjacent positioning of both BVS with a very minimal (0.5 mm) overlap between the two adjacent BVS in the proximal RCA.
2D OCT assessment of the overlap in humans
The 2D assessment of the non-overlapping BVS at baseline and follow-up has previously been conducted in the ABSORB cohort A and B studies.3,7,10 As part of the OCT substudy in the ABSORB EXTEND single arm study, OCT assessment of the overlapping BVS will be performed by an independent core laboratory. However, given the complexities of the overlapping struts as shown in the case examples, with the varying and unique patterns of strut distribution and stacking seen from frame to frame (Figure 7), the standard OCT methodology for assessing simple lesions cannot be applied to the overlap. It is therefore necessary to include all the frames in the overlap to allow for the accurate baseline and follow up assessment. This is in contrast to the assessment of non-overlapping segments from the Absorb cohort A and B trials, where frames occurring every 1 mm were routinely analysed. Dependent on the length of the overlap, this will proportionately increase or decrease the number of frames for analysis.
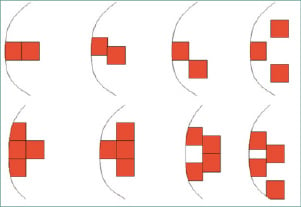
Figure 7. Illustration to demonstrate the varying appearances of the stacked BVS struts seen on OCT analysis. Stacked struts and stacked strut clusters (collections of struts all apposed to each other) are shown.
The nomenclature and principles of analysis of OCT frames, previously applied to the shorter lesions in ABSORB cohort A and B, will be maintained for the overlap frames at both baseline and follow up (Table 1). However, in most cases, the methodology will vary slightly to reflect the complexities in strut distribution seen at the overlap. The study investigators will be aware that the frames analysed are from the overlap and that these frames will be investigated separately, as compared to the non-overlapped segments.
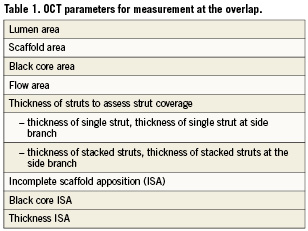
The following OCT parameters, with a brief description of the methodology, will be analysed for the overlap.
1. Lumen area (Figure 8)
This is calculated in the conventional way as with a simple, non-overlapping lesion. The internal vessel contour is drawn around with multiple correction points using the OCT software which then, through a process of “splining,” automatically draws in the lumen which the operator can adjust so that it corresponds to the lumen contour. Of note is that the lumen contour on baseline OCT images will always be drawn behind (i.e., abluminally) the struts, even if they are embedded (Figure 8b –see struts in 12 o’clock position) on follow-up OCT, the lumen contour will be drawn behind the struts if they are uncovered only.
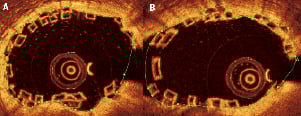
Figure 8. Lumen area in an overlapping BVS segment. The lumen area is drawn in the conventional way by following the contours of the lumen in non-bifurcating (A) and bifurcating (B) vessels.
2. Scaffold area (Figure 11)
The scaffold area, as the name suggests, is the area contained within the BVS frame and in non-overlapping lesions, is usually a circular area drawn around all the abluminal sides (“back side”) of the BVS struts. The scaffold area is an important concept for bioresorbable scaffolds, as changes can signal losses in material radial strength or structural integrity. Unfortunately drawing the scaffold area at the overlap can potentially be difficult, given that there are multiple stacked struts clusters (collections of struts all apposed to each other) and the operator potentially not knowing around which struts to draw the scaffold area.
The OCT image of a BVS 1.1 strut consists of a “black core” area surrounded by a “white frame” (Figure 9). The white frame is interpreted to comprise an area of backscatter from the surfaces of the BVS strut, whereas the black core is interpreted as representing the completely radiolucent bulk material. The BVS strut thickness is approximately 150 microns. When the strut becomes covered at follow-up (Figure 9), the black core area remains translucent. However, trying to identify the white frame with reliability is difficult and subjective. In the overlap situation, where the struts are either apposing each other or even embedded in the vessel wall, trying to again identify the white frame with reliability is also difficult (see case examples). Conversely, long-term animal studies have shown that the black core area seen on OCT, although replaced by proteoglycans upon bioresorption of the polymer, retains its shape and translucency on OCT at up to two years follow-up;9 the black core area is therefore a constant point of reference to measure from.
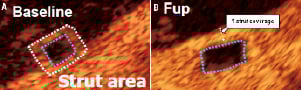
Figure 9. Characteristics of BVS 1.1 strut at baseline and six month follow-up (case example form ABSORB Cohort B). At baseline, each strut consists of a black core surrounded by a white frame (A). At six-month follow-up (b) the black core remains intact, however when the strut becomes covered, trying to identify the white frame is not possible with reliability as demonstrated (B).
We therefore recommend that the scaffold area be measured from the abluminal side of the black core area. Wherever the struts (either single strut of part of a stacked strut cluster) appose the vessel wall, the contour line of the scaffold area is drawn around the abluminal side of the black core for those particular struts, with a correction point marked at the halfway position of the abluminal black core border (Figure 10). The computer software can then use these correction points to create the scaffold area through the splining process as previously described. The rationale being that the BVS delivers its radial strength through areas of the scaffold in apposition to the vessel wall, and any overlapping struts not apposing the vessel wall will deliver their radial strength to the vessel wall through their apposition to struts which already appose the vessel wall.
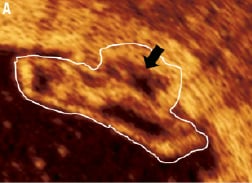
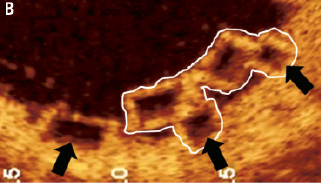
Figure 10. Methodology of drawing the scaffold area around the single strut, the stacked struts and stacked strut clusters of the BVS. The scaffold area is drawn around the abluminal side of the black core area in a single strut. In a stacked strut cluster (A), the scaffold area is drawn around the abluminal side of the black core area (black arrow) at each strut that apposes the vessel endothelium (A, B), as these are points of scaffolding to the vessel. White boundaries indicate a stacked strut cluster.
In situations where a strut or strut cluster is seen to be not apposing the vessel wall, the scaffold area is drawn around the abluminal side of the black core of the struts that are the nearest to the vessel wall (Figure 11). Struts not apposing the vessel wall at the overlap do not necessarily imply incomplete scaffold apposition (ISA); this is more likely to be related to either the strut being located at a side branch, or it being part of a stacked strut cluster that typically is apposing the wall on the next few OCT frames.
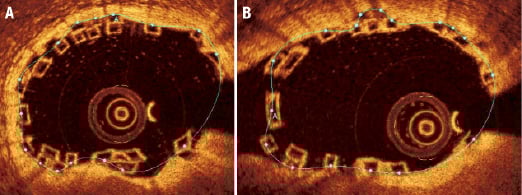
Figure 11. Scaffold area in the overlapping BVS in the main-branch (A) and side-branch (B). (A) This is drawn from the “backside” (i.e., abluminal side) of the black core area of the outermost strut or stacked strut cluster (at the point of all the struts apposing the vessel endothelium) apposing the vessel wall. Where there does not appear to be any apposition of a single strut or stacked strut cluster to the vessel endothelium, the contour of the scaffold area continues to follow the outermost (most abluminal) scaffold strut or stacked strut cluster.
It should be noted that only one correction point per strut is required for the computer software to create, through the process of splining, the scaffold area when performing the OCT analysis of the overlap. (Figure 11). Whilst placing two correction points per strut may make the scaffold area more agreeable to the eye, i.e., it being more circular, we have found that the actual differences in terms of the scaffold area appears to be insignificant as illustrated (Figure 12).
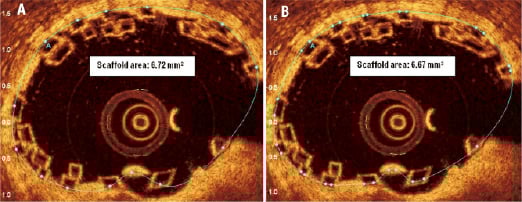
Figure 12. Scaffold area requires one correction point per black-core area to allow the computer software to create the scaffold area through a process of “splining.” One (A) or two correction points (B) can be placed for each black-core area. Although a more smoother and visual appealing scaffold area is seen with two markers per black core area –the actual difference in terms of scaffold area is not significant.
3. Black core area (Figure 13)
The black core area for each frame is calculated as illustrated. This is used for calculating the “flow area” as described below.
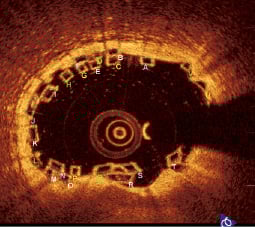
Figure 13. Black core area. Each single strut or stacked strut cluster has its individual black core area measured to calculate the strut area for each OCT image at the overlap.
4. Flow area (Figure 14)
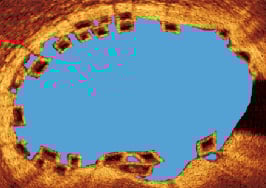
Figure 14. Flow area. As illustrated – this is the lumen area minus the strut area.
Effectively the flow area is the area of the vessel where blood flows through. This is calculated as the lumen area minus the black core area. Theoretically, the area occupied by the white frame of the BVS strut should also be subtracted from the flow area; however, because of the unreliability of measuring the white frame area as previously described, this has been omitted from the flow area calculation. As the flow area will be calculated at baseline and follow-up, the white frame area in both the baseline and follow-up flow areas will effectively cancel each other out when the difference in flow area is calculated. At follow up, if all the struts are covered, the flow area will equal the lumen area. If, however, all the struts are not covered, the flow area will equal lumen area minus uncovered black core/white frame areas.
5. Thickness of single struts and thickness of stacked struts to assess strut coverage (Figure 15)
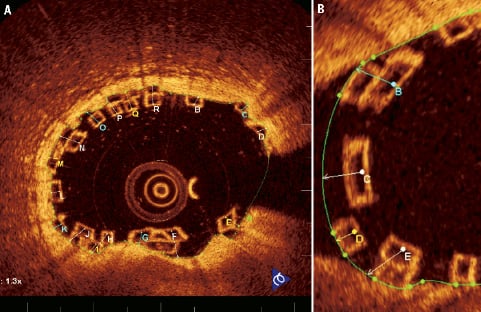
Figure 15. Thickness of single struts and thickness of stacked struts in a non-bifurcating (A) and bifurcating (B) vessel. Green area represents the lumen area boundary.
The thickness of struts is taken from the midpoint of the endoluminal side of the black core area in single struts to the lumen area boundary (thickness of single strut), from the midpoint of the most endoluminal strut in stacked strut clusters to the lumen area boundary (thickness of stacked struts) and also from the endoluminal side of a stacked strut cluster to the lumen area boundary, when more than 50% of the more abluminal strut is not covered by the more endoluminal strut.
In side branches this principle is maintained for both single struts (thickness of single strut at side branch) and stacked strut clusters (thickness of stacked struts at side branch) with the thickness measured to the presumed lumen area boundary.
At follow-up OCT, the thickness of the covered single or stacked struts will have a positive value in covered struts, whilst uncovered struts will continue to have a negative value as was seen at baseline.
6. Black core ISA and thickness ISA (Figure 16)
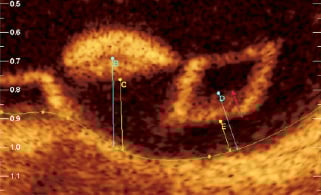
Figure 16. Black core ISA and thickness ISA. The “black core ISA” (B, D) and the “thickness ISA” (C, E) are clearly demonstrated. Note the black core ISA is taken from the abluminal side of black core ISA where the border is very clear –the red arrow indicates a zone from the abluminal white frame to the black core area where the margin of the black core cannot be clearly be defined. The black core area should therefore not be measured from within this zone.
Incomplete scaffold apposition (ISA) is measured both at baseline and follow-up to assess for procedural or late acquired ISA. As the black core area is constant, all ISA measurements will be made from here.
The “thickness ISA” is measured from the abluminal side of the white frame zone to the lumen area boundary. The black core ISA is measured from the abluminal side of the black core area, where the margin is very clear (Figure 16), to the lumen area boundary as illustrated.
Discussion
Based on the benchwork and subsequent data from the animal model, it would appear that either the “interdigitating position” or complete overlap with reduced number of stacked struts would be the ideal solutions in order to ensure more rapid endothelialisation at the overlap. By using these methods, the number of stacked struts would be minimised, remembering that each stacked strut has a minimum thickness of 300 microns as opposed to a single strut thickness of 150 microns, and that the evidence from the animal model suggests that these stacked struts would potentially be at risk of delayed endothelialisation. However, both of these overlapping techniques cannot be performed angiographically with reliability, and are more likely to occur by chance rather than by procedural technique as previously described.
The occurrences of reduced endothelialisation at the overlap has previously been described with overlapping metallic drug eluting stents (DES).14,15 Finn et al 200514 showed in a rabbit iliac artery model that both overlapping sirolimus (SES) and paclitaxel (PES) eluting stents demonstrated evidence of a persistent inflammatory response, fibrin deposition and delayed endothelialisation. With overlapping metallic DES, damage or cracking of the polymer16,17 can potentially occur at the overlap with the consequent risk being persistent foreign body inflammation. In clinical practice however, the evidence for a lack of endothelialisation at the overlap with metallic DES is more controversial. Some studies have suggested an association between higher number of uncovered struts and adverse events18,19 and other studies have failed to make this association20,21 or even suggested differences in coverage pattern (but not in the number of uncovered struts) dependent on the type of DES implanted.21
With the BVS 1.1, the polymer is both bioresorbable and biocompatible, thereby the scaffold will gradually bioresorb from six months to 24 months and the inflammatory response to the polymer should be minimal.9 Thus the polymer and scaffold substrates are removed, theoretically eliminating the risk of late stent (“scaffold”) thrombosis.
Based on the results of the benchwork and animal models, perhaps the more practical and pragmatic solution in implanting overlapping BVS is positioning each BVS very close to each other and ensuring only a small territory of overlap occurs between each BVS i.e., minimal overlap as shown in case 3. This would potentially minimise the numbers of stacked struts, limit the risk of a gap occurring between the BVS and theoretically increase the rate towards complete endothelialisation. The outcomes from the OCT substudy in the ABSORB EXTEND single arm study investigating the overlap are therefore awaited with interest.
Acknowledgements
The first author wishes to acknowledge the support of The Dickinson Trust Travelling Scholarship Fund, Manchester Royal Infirmary, Manchester, England, UK.
Conflict of interest statement
J. Powers, L.L Perkins and R.J. Rapoza are employees of Abbott Vascular. R. Virmani has received research support from Medtronic AVE, Abbott Vascular, Atrium Medical, OrbusNeich Medical, Terumo Corporation, Cordis Corporation, BioSensors International; and is a consultant for Medtronic AVE, Abbott Vascular, W.L. Gore, Atrium Medical, Arsenal Medical, and Lutonix. The remaining authors have no conflict of interest to declare.
Online data supplement
Moving image. Demonstration of the phantom model used to assess the overlapping BVS. The recording on the right shows the pullback of the OCT fibreoptic imaging core and the recording on the left demonstrates the corresponding OCT images obtained during the pullback.
Figure M. 3D OCT demonstrating a virtual fly-through (proximal-distal) of the vessel (pullback speed of FD-OCT probe 10 mm/sec). The treated lesion was 28 mm in length with a maximum of 60% diameter stenosis (RVD 2.5 mm) and TIMI 3 flow; two overlapping BVS (3.0×18 mm) were successfully deployed (maximum pressure 14 atm). No post-dilatation was performed. The overlap in the mid RCA can clearly be visualised (6 mm) with multiple stacked struts.