Abstract
The success and continued rapid clinical integration of transcatheter valve technologies relies on imaging modalities to guide safe and effective device deployment. In particular, cardiac imaging, using both echocardiography and CT, is an integral resource for the multidisciplinary team. These modalities can provide valuable insight for the proceduralist at each stage of transcatheter-based valve insertion, as they can be used reliably to define the anatomy of interest and its relationship to surrounding structures, determine accurate device sizing, assess patients for valve-in-valve procedures, and screen for adverse features or procedural contraindications. We provide an overview of some of the key aspects of the use of CT and echocardiography in the context of transcatheter aortic valve replacement (TAVR), as well as transcatheter mitral valve replacement (TMVR).
Role of echocardiography (transthoracic and transoesophageal)
Echocardiography, in the context of transcatheter aortic valve replacement (TAVR) and transcatheter mitral valve replacement (TMVR), is the primary imaging modality for the diagnosis and quantification of valvular heart disease1,2. It is also vital in preprocedural assessment, intraprocedural guidance and post-procedural evaluation.
Echocardiography is integral to establishing an accurate valvular diagnosis, severity, mechanism and adequate patient selection for transcatheter procedures. Although transthoracic echocardiography (TTE) is typically the first imaging study obtained for assessment of myocardial and valvular structure and function3, transoesophageal echocardiography (TEE) offers markedly improved spatial resolution, aiding in the evaluation of patients with suboptimal image quality. In addition, preprocedural TEE assessment with 3D imaging and multiplanar reformatting3 provides valuable information for TAVR and TMVR planning and procedural guidance4,5.
There is a growing movement for a minimalist TAVR approach, to decrease the need for a hybrid room, general anaesthesia and periprocedural TEE. Although this approach has been shown to be safe and continues to gain momentum, selective use of TEE continues to be quite useful to confirm, or at times adjudicate, immediately prior to implantation, features of the aortic root complex such as annular dimensions, coronary height, extent of calcification, etc. (Figure 1)4. This can be valuable, particularly in situations where the image quality of preprocedural computed tomography (CT) scanning is suboptimal. TEE can also aid in the positioning of the stiff wire and TAVR prosthesis, and help to visualise the valve deployment during the procedure. Immediately after TAVR deployment, TTE or TEE can evaluate TAVR prosthesis leaflet mobility and positioning (Moving image 1), and screen for wall motion abnormalities as well as detect potential complications such as paravalvular regurgitation (PAR) (Moving image 2), pericardial effusion or, more rarely, coronary artery occlusion, and device embolisation or annulus rupture4. During and after deployment, TTE/TEE can also detect other dynamic effects on the right ventricular function and mitral valve. Assessment of mitral regurgitation severity pre/post TAVR is important, as lower placement of the TAVR prosthesis can cause worsening mitral regurgitation6-8.
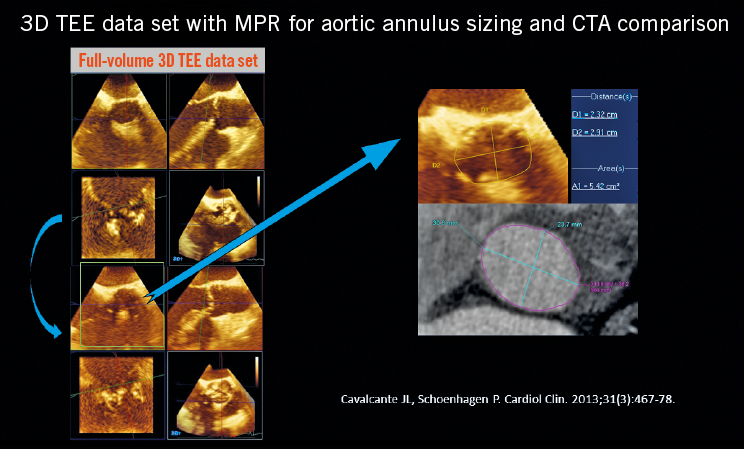
Figure 1. Use of 3D TEE to define and size the aortic annulus.
With regard to TMVR, TEE is also very helpful for planning, procedural guidance and follow-up. A three-dimensional, en face (surgical) mitral valve view allows exquisite visualisation of the MV pathology. In addition, post-processing of 3D TEE data sets not only provides mitral annulus and leaflet modelling, but also allows serial measurements (Moving image 3). Intraprocedural TEE in TMVR can guide: a) the ideal transapical access location by verifying the site where apical invagination occurs with surgical poking, with an ideal perpendicular trajectory towards the mitral annulus, while avoiding papillary muscle; b) placement of stiff wire and bioprosthesis; c) assessment of LVOT obstruction; d) assessment of MV leaflet mobility and residual regurgitation/stenosis4. There are some limitations to intraprocedural TEE. TEE requires some degree of patient sedation, which can be haemodynamically challenging in certain patients with decompensated heart failure from severe AS. Nonetheless, in the clear majority of cases, TEE is safe and well tolerated. Furthermore, TEE data acquisition, post-processing and procedural guidance require dedicated advanced training and expertise which is not widely available.
The role of periprocedural TTE is more limited given the typical patient set-up with sterile chest field protection, probe cover, supine position and potentially increased radiation to the operator. Although the use of TTE in TAVR is becoming more common, it is unclear whether this will have any effects on the detection of potential complications4.
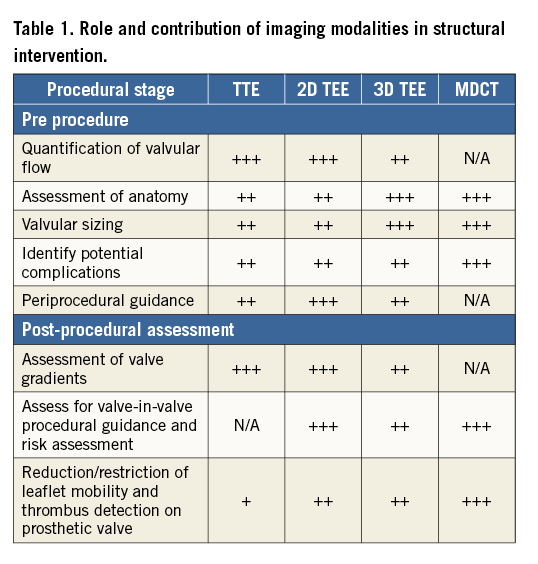
Echocardiography, in particular TTE, is obtained to assess longitudinal valve/ventricular function and to detect any complications following implantation4,5. For midterm to long-term follow-up, echocardiography is used to monitor valve function and any late complications including decreased leaflet mobility and colour flow paucity, both of which have been associated with transcatheter valve thrombosis (Figure 2, Moving image 4), and PAR (Moving image 2). Table 1 outlines the use of TTE, 2D and 3D echocardiography, as well as multidetector computed tomography (MDCT). It lists the role of each modality preceding, during and after structural intervention, and indicates the utility of each modality at each of these stages.
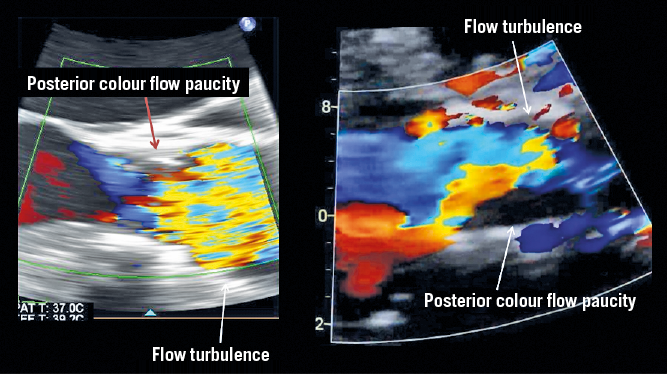
Figure 2. Demonstration of flow paucity and turbulence in association with leaflet thrombosis.
Role of CT
ASSESSMENT OF ANATOMY
The high spatial resolution of CT is used to define the anatomy of the valve annulus and other cardiac structures that are the target of device implantation. This includes assessment of valve leaflets, presence of calcification and proximity of structures at risk of occlusion by device implantation.
AORTIC ANATOMY
Valve leaflets can be assessed readily using CT with cine imaging demonstrating leaflet motion. This application of CT is valuable for identifying bicuspid aortic valves (BAV). The incidence of BAV within the community is 1-2% and the condition is associated with premature aortic valve disease, most commonly aortic stenosis9. TAVR is becoming increasingly common in cases of BAV (up to almost half of the patients in a recent Chinese registry10). TAVR has also been found to have lower success rates in BAV, with a higher occurrence of aortic root injury and paravalvular leak when compared to patients with tricuspid aortic valves11.
Preprocedural CT can be helpful to classify BAV morphology based on the number of commissures and raphes present. Figure 3 illustrates a bicuspid aortic valve using CT. Thanks to the great anatomical detail afforded by CT, those in the field have gained increasing awareness of the complex anatomical variability associated with bicuspid valve morphology. The Sievers classification has been referenced for over a decade, but specific patterns identifiable on MDCT do not appear to fit within the system12. Recently, the term bicuspid tricommissural aortic valve morphology has been introduced as an intermediary of sorts between a tricuspid valve and bicuspid valve with a median raphe. This has been historically referred to as an acquired bicuspid valve, but there is now fairly broad consensus that this condition is a congenital abnormality13. With the introduction of the latest-generation transcatheter heart valves (THV), it would seem that this type of valve morphology can be well treated with TAVR11. Continued investigation into the role of TAVR in tricommissural bicuspid valve disease and the traditional Sievers Type 1 bicuspid valve disease is needed either in large-scale registries or in a trial setting to advance our understanding of the current place of TAVR in these patients and how best to size THV in these underlying valve morphologies.
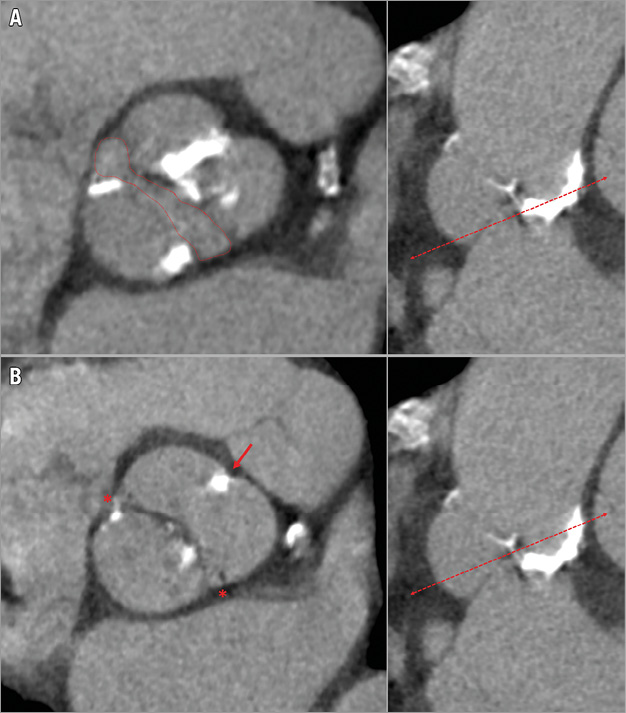
Figure 3. Type 1 bicuspid aortic valve. A) The fish-mouth valve opening (red dotted line). B) The presence of two commissures (red asterisk) with a raphe (thick red arrow).
MITRAL ANATOMY
The mitral valve has distinct landing zone characteristics which can also be defined by CT. Mitral annular calcification can be readily identified on CT and can be described as localised or extensive and encroach onto leaflets. With any transcatheter device, success relies on capture and sealing, and extensive calcification is a relative contraindication to percutaneous valve deployment, as it is felt to impact negatively on device sealing. Leaflet anatomy and length can also be determined in the mid-diastolic phase, as well as distance from the papillary muscle to the leaflets14.
ANNULAR SIZING, DEVICE SELECTION
AORTIC VALVE SIZING
Accurate and, most importantly, reproducible measurements of the aortic and mitral annulus are essential to optimise sizing and reduce complications related to TAVR. MDCT-based annular measurements are required to guide device selection including optimisation of device size; excessive oversizing carries the risk of causing rupture, with a consequently high mortality rate15. Undersizing also has notable drawbacks as it can lead to paravalvular leak or regurgitation, which is also associated with significant morbidity and mortality16-20. Preprocedural MDCT to size the annulus has been shown to reduce the incidence of overall mortality and morbidity, including annular rupture21 and PAR22.
The aortic annulus is not a clearly defined anatomical structure but rather a virtual plane at the base of the aortic valve leaflets, defined by the hinge points of the semilunar cusps of the aortic valve. It is most commonly ovoid with up to 5 mm mean difference between the short and long axes23. Due to this predominantly elliptical shape, 3D imaging with CT and 3D TEE facilitates accurate measurement of the area and perimeter of the annulus using a virtual basal plane that is a ring-like structure defined by the junction of the hinge points of each cusp (Figure 2)24. Annular area can vary in size at the different stages of the cardiac cycle. However, end systole, generally at phase 20-40%, corresponds to the largest annular area and should be utilised for annular sizing25. Importantly, phase selection should not be made on the basis of their labelling, but rather by selecting the phase with the best image quality before mitral valve opening.
After selection of the correct phase that is reflective of end systole, double-oblique multiplanar reconstruction (MPR) allows alignment of the hinge points of the aortic cusps and initial identification of the basal ring. Subsequently, the hinge points can be further brought in-plane by rotation on the axis perpendicular to the ring to ensure that they all lie on the plane of the virtual ring24. With the virtual ring defined, post-processing software can allow calculation of the ring’s area, perimeter and cross-sectional diameters (Figure 4). The basal ring also becomes a reference to define other structures, including coronary heights and left ventricular outflow tract (LVOT) length, both of which are important markers of adverse outcomes. Notably, the use of this technique is highly reproducible using both inter- and intra-reader correlation. A segmentation tool can also be used to estimate the geometrical orifice area. This measurement is commonly larger than echocardiography-defined valve area, ranging up to 17% larger in area26,27.
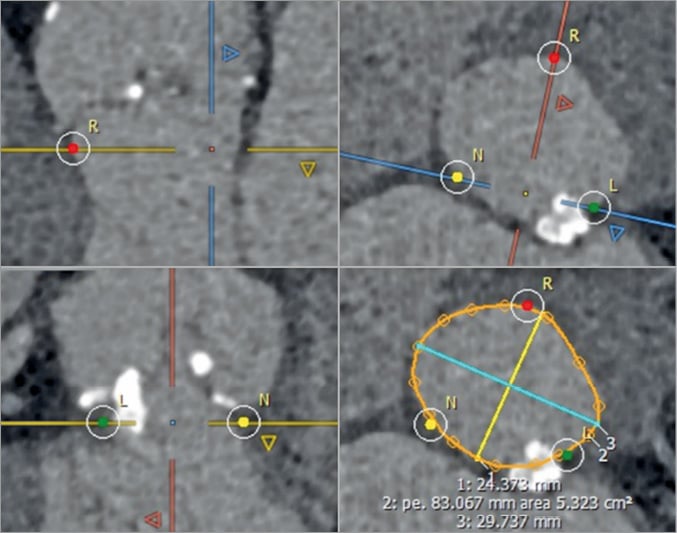
Figure 4. Identification of the hinge points of the three aortic cusps that define the annular plane. Maximal and minimal diameters, annular perimeter and area are measured. A harmonic contour is drawn (orange line) to include the protruding part of the annular calcification. R: right cusp; L: left cusp; N: non-coronary cusp
MITRAL ANNULAR SIZING
With the advent and progression of TMV repair or replacement, MDCT has also demonstrated utility in defining mitral annular anatomy and area. As with the aortic valve, correct sizing is essential for appropriate patient selection and device sizing. Rupture is less of a concern as the devices to date are self-expanding, but undersizing does increase the risk of PAR and embolisation. In comparison to the aortic valve, the mitral annulus has a saddle configuration and is larger, with greater variation in its annular area. Moreover, in patients with conditions leading to TMVR, such as mitral regurgitation and left ventricular dilatation, the mitral annular dimensions are further enlarged, ranging from 11 to 20 cm² versus the 7 to 10 cm2 seen in normal subjects28. Hence, measurement of valve size by CT is more diverse. The non-planar shape of the mitral valve annulus contributes to the challenge of reliably and consistently defining the mitral annular area; use of 2D imaging techniques is limited as they rely on accurate orientation23. Defining the anterior border of the mitral valve shows inconsistency and so also has limited reproducibility29. Use of 3D segmentation has been shown to measure the annular area accurately and is reproducible30. This is achieved by defining the LV long axis and, in the corresponding short-axis view, manually placing seeding points. The seeding points are placed with stepwise rotation every 22.5° along the insertion of the posterior mitral leaflet and along the fibrous continuity. This gives a 3D acquired saddle-shaped annulus. In conjunction with this technique, it is important to note that use of the saddle-shaped annulus to define the area has limitations, as selecting a device the size of the saddle-shaped annulus may lead to LVOT obstruction. To address this problem, exclusion of the apparatus anterior to the medial and lateral trigones to create a “D-shaped” annulus has been incorporated (Figure 5). The trigones themselves are defined from where the anterior mitral valve leaflet separates from the atrioventricular junction to follow the fibrous continuity8. Once defined, the anterior aortic peaks and aortomitral continuity are excluded. In addition to the overall area and circumference, the trigone to trigone distance, the septal to lateral distance and the intercommissural line are defined. Notably, the use of this D-shaped model of the mitral annulus holds several advantages over saddle-shaped measurements. It is a reproducible method with low interobserver variability. Also, there is less risk of device projection into the LVOT8.
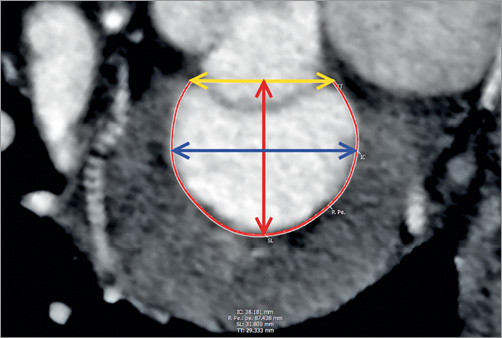
Figure 5. En face view of a segmented “D-shaped” mitral annulus. The yellow double-headed arrow represents the trigone to trigone distance (TT), the blue double-headed arrow illustrates the intercommissural distance (IC) and the red double-headed arrow depicts the septal to lateral distance (SL). The thin red line represents the insertion of the posterior mitral leaflet.
PREPROCEDURAL ANGLE PREDICTION
Successful valve deployment relies on accurate positioning with the use of fluoroscopy perpendicular to the native valve. Preprocedural CT can provide equivalent views corresponding to C-arm angulation giving the proceduralist a “road map” for per-procedural fluoroscopy.
In TAVR, coplanar angulation can be achieved using MPRs, with rotation around the virtual annular plane until the oblique plane that corresponds to the desired orthogonal plane is achieved31. Plane segmentation can guide optimal angle (caudal or cranial) that corresponds to fluoroscopic projection – presenting an anatomical “road map” of what one can expect to see for coaxial deployment at corresponding C-arm angles32.
In mitral valve procedures, coplanar angulation can also be calculated to assist device implantation33. Angles can provide views that correspond with the virtual lines that transect the annular plane, the septal to lateral line and trigone to trigone line (Figure 6). The trigone to trigone line generally corresponds to a C-arm angulation that is not clinically practical. A separate en face angle can also be commonly provided. This angle can guide the proceduralist for perpendicular deployment of devices by providing a procedural path. Preprocedural CT can also present the proceduralist with a virtual coronary sinus wire to define the patient-specific relationship between the coronary sinus and P2 so that the proceduralist will be able to use a coronary sinus wire at the time of the procedure to help with valve deployment33.

Figure 6. Patient-specific coplanar fluoroscopic angulations for the aortic and mitral valve. Following segmentation of the mitral annulus (in red) and of the aortic annulus (in pink), multiple coplanar fluoroscopic angles can be determined to enable a view perpendicular to these structures (red and pink dotted curves). In this example, the angle needed to generate a “septal-to-lateral” view is depicted, and allows a perfect alignment of the SL line.
PREVENTING COMPLICATIONS
Preprocedural CT can identify patients at risk of complications, particularly obstruction to adjacent structures, and the risk of rupturing surrounding tissue. These complications carry a high morbidity and mortality rate, and planning with CT has seen reduction in intraprocedural complications.
The proximity of the coronary vessels to the aortic annulus can be assessed prior to TAVR. With transcatheter heart valve implantation, the calcified native valve leaflets are displaced to the sinus of Valsalva, potentially occluding the coronary ostium. Occlusion of the coronary arteries by the prosthesis has a high mortality rate, estimated fatal in 40.9% of cases within 30 days34. A higher risk of obstruction was observed among women, with use of balloon-expandable devices and in valve-in-valve procedures. Measured by CT, coronary heights from the annular ring equal to or less than 12 mm in a male and 11 mm in a female were predictive of increased risk of occlusion. In addition, a diminished cross-sectional diameter of the sinus of Valsalva less than 30 mm was also predictive of an increased risk of occlusion.
Another potential complication during device deployment in TAVR is rupture of the annulus. Aggressive oversizing with balloon-expandable devices, as well as LVOT calcification (Figure 7), is associated with an increased risk of intraprocedural rupture35. CT can minimise the risk of annular rupture with correct sizing15, in particular identification of a more circular annulus which is more prone to rupture from oversizing36.
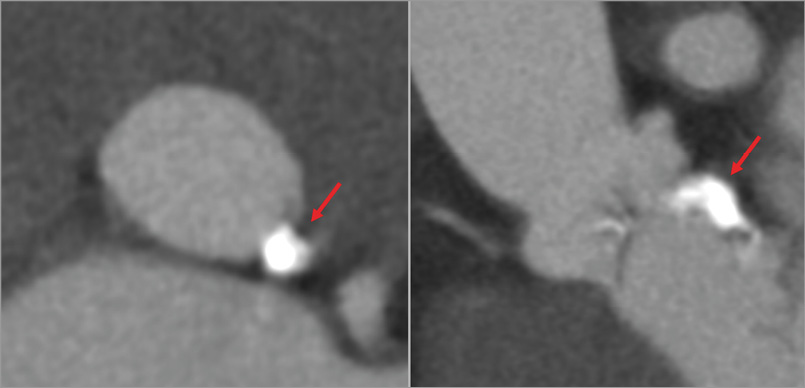
Figure 7. Extensive annular and subannular calcification (red arrows), not however protruding into the LVOT.
CT can also readily identify calcification on valves and annular structures. In aortic valve assessment, leaflet calcification and the presence of subvalvular calcification can be identified. Presence and distribution of subannular calcification is of particular relevance due to the association with annular rupture37. It has been shown that oversizing the annulus by greater than 20% by area in the setting of moderate/severe subannular calcification, particularly when below the non-coronary cusp, increases the risk of annular rupture.
In mitral procedures, LVOT obstruction is a major complication with significant morbidity and high mortality38. The relative position of the mitral annulus, in combination with unsuitable anatomy, can result in flow limitation or obstruction from implantation of a prosthetic MV. There are high-risk features which can be identified on CT, including anatomical relationship of the aortomitral angle, the LV size, configuration of the interventricular septum, and the device itself. The angle between the mitral outflow and the LVOT long axis (aortomitral angle) is at greater risk when the angle is increased - near parallel angles pose minimal risk whereas perpendicular angulation poses maximal risk. Smaller left ventricular size also poses a risk of LVOT obstruction as it may not be able to accommodate an implanted valve. In addition, hypertrophy at the basal septum can accentuate the aortomitral angle and subsequently diminish the LVOT area. Lastly, an implanted device can protrude into the LVOT and limit the cross-sectional area of the LVOT.
CT can be used to model the device deployment and segment the residual LVOT with a virtual TMVR stent in place, which creates a neo-LVOT bound by the septum and the deployed transcatheter valve39. The cross-sectional area of the neo-LVOT (Figure 8) can then be predicted, including the role of the aortomitral angle, LV size and basal hypertrophy on the overall risk of obstruction. However, no discrete LVOT area has been defined at which the risk of obstruction increases. The influence of loading conditions, residual LV function, and the integrity of the chordal apparatus remains unclear. In addition, the phase of the cardiac cycle is important as minimal LVOT area occurs at end systole, though this may have no influence on obstruction as maximal flow occurs in early to mid systole.
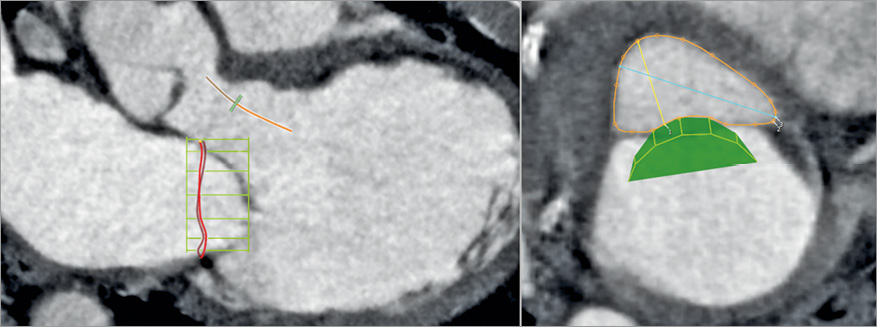
Figure 8. Virtual positioning of a mitral valve device to predict the risk of LVOT obstruction. The three-chamber view (right image) demonstrates the effect a mitral prosthetic device (green mesh) positioned within the mitral annulus would have on the geometry of the LVOT. The view perpendicular to the LVOT centreline (left image) is used to measure the “neo-LVOT” residual area, here largely sufficient at more than 5 cm².
VALVE IN VALVE
CT can be used in patients prior to transcatheter valve implantation inside an existing surgical prosthetic valve that no longer functions adequately (valve-in-valve [VIV] procedure)40. The key concern in such a procedure is the risk of coronary occlusion, which carries a high mortality risk and can occur due to occlusion by the prosthetic valve leaflets being displaced by the deployed transcatheter valve. Importantly, the risk of coronary occlusion in VIV is fivefold to sevenfold greater than in native aortic valve TAVR. When the existing dysfunctional prosthetic valve is a stentless one, a virtual ring can be defined and the coronary heights and sinus of Valsalva dimensions indicate the risk of occlusion. However, when the dysfunctional prosthetic valve is stented, the stent struts can be used as landmarks to determine the risk of coronary occlusion: when coronary ostia lie above the stent posts there is no risk of occlusion but, if they lie below the stent posts, then a virtual prosthesis to coronary distance can be derived (Figure 9)41. To do so, the surgical stent posts are tracked up to the level of the coronary ostia indicating the degree of tilting of the device. A circular ring is then placed at the level of both the left and right coronary ostia with the centroid defined by the centre of the three surgical stent posts. The size of the ring is set to mimic the hypothesised size of the future THV. Following this, a measurement is taken from the margin of the ring to the coronary ostium. There is a low risk of occlusion with a distance >6 mm, a moderate risk if the distance is 3-6 mm and a high risk of coronary occlusion if the distance is less than 3 mm42. In a recent analysis of the VIVID registry, it was shown that the valve to coronary (VTC) distance was highly predictive of risk of coronary occlusion in a matched cohort, with a shorter VTC distance independently associated with coronary obstruction (OR 0.22 per 1 mm increase; 95% CI: 0.09 to 0.51; p<0.001), with an optimal cut-off level of 4 mm best predicting this complication (AUC 0.943; p<0.001) (Ribeiro et al [TCT-678], presented at TCT 2016, Washington, DC, USA).
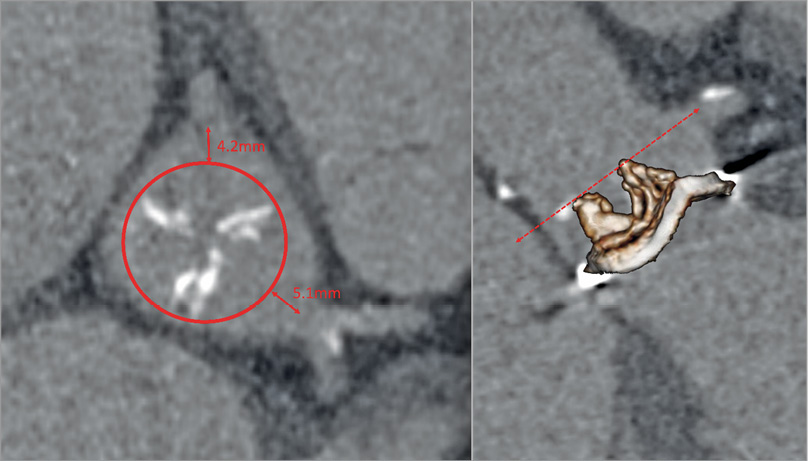
Figure 9. Modelling the risk of coronary obstruction in a valve-in-valve case with a stented prosthetic aortic valve (here a 25 mm Mitroflow; Sorin Group [now LivaNova], Milan, Italy). The virtual transcatheter valve to coronary distance (VTC – red double-headed arrows) is obtained by placing a simulated 20 mm prosthetic heart valve [PHV] (red circle) centred on the prosthetic valve at the level of the coronary ostia. The VTC in this case is 4 mm for the right coronary artery and 5 mm for the left main.
THROMBUS DETECTION AND POST-IMPLANT ASSESSMENT
Post-procedural CT is a highly useful tool to assess compromise to valve function. Commonly, such dysfunction is caused by thrombus formation associated with leaflet thickening and fibrous ingrowth on the transcatheter valve leaflets. Thrombus tends to develop on the aortic side and can be observed on CT as a predominantly hypodense structure with an attenuation less than the ventricular septum43. Early hypo-attenuated leaflet thickening (HALT) has also been described, corresponding to hypodense thickening of the prosthetic leaflets combined with reduced valve motion. It has been shown to resolve with anticoagulation and may reflect thrombus formation44,45 (Figure 10).
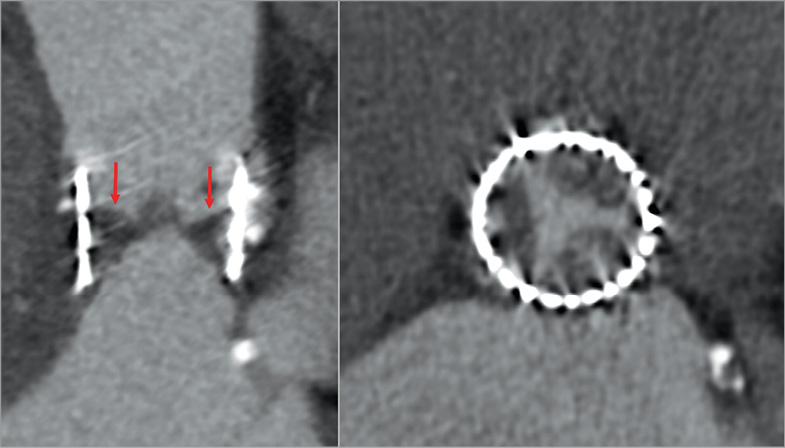
Figure 10. Leaflet thrombosis three months after a TAVR procedure, with severe hypo-attenuated leaflet thickening (HALT; red arrows) visualised as a hypodense thickening of the aortic side of the valve. The axial view (left image) demonstrates an involvement of all three cusps.
CT can identify leaflet thickening or calcification post implantation as well as insufficient leaflet coaptation by measuring the valve residual opening area in end diastole46. With retrospective acquisition, cine CT images can allow assessment of valve motion and identify limited leaflet opening47. Though CT can aid in diagnosis of thrombus, its utility in post-implant screening remains undefined.
While primarily diagnosed by echocardiography, MDCT can be helpful at times to provide an understanding of patient-specific mechanisms of PAR and help plan treatment. Discriminating between PAR and dehiscence can be difficult, though dehiscence is commonly larger and can be associated with suture breakdown and infective endocarditis. In contrast, PAR results from malposition of the device to the annulus48, often due to subannular calcification49.
Conclusion
Imaging modalities are an integral component of transcatheter device deployment and imagers are an essential part of the multidisciplinary team. Transcatheter device insertion relies on multimodality imaging preceding, during and following implantation. High-quality imaging is vital for accurate diagnosis, as well as for screening patients for heightened risk of procedural complications, and provision of accurate measurement for appropriate device deployment. In addition, imaging is critical for the identification of complications during and after the procedure.
Conflict of interest statement
P. Blanke and J. Leipsic are consultants for Edwards Lifesciences and HeartFlow Inc and provide CT core lab services for Edwards Lifesciences, Medtronic, Neovasc, GDS, and Tendyne Holdings for which they receive no direct compensation. J. Leipsic has stock options in HeartFlow Inc. J.L. Cavalcante receives investigator-initiated grant support from Medtronic Inc. The other authors have no conflicts of interest to declare.
Supplementary data
Moving image 1. TEE clip of a 3D full-volume data set with multiplanar reformatting.
Moving image 2. Multiple TEE clips of different patients showing different locations of paravalvular aortic regurgitation.
Moving image 3. Degenerative mitral valve - Barlow’s disease.
Moving image 4. TTE indicating leaflet thrombosis and TEE for suspected leaflet thrombosis.
Supplementary data
To read the full content of this article, please download the PDF.
Degenerative mitral valve - Barlow’s disease. A) Transoesophageal mid-oesophageal 4-chamber views at 0 degrees. The P2 scallop is redundant and billowed consistent with Barlow’s pathology. B) Transesophageal mid-oesophageal 4-chamber views at 134 degrees. The P2 scallop is prolapse with eccentric anteriorly directed regurgitation. C)Transoesophageal 3D en face image of the mitral valve with prolapse involving P1 and P2 scallops. D) Geometric model of the mitral valve with prolapse involving P1 and P2 as shown by the red colouring. A: anterior; AL: anterolateral; P: posterior; PM: posterior medial.
TTE indicating leaflet thrombosis and TOE for suspected leaflet thrombosis. Top panels: Patient is post-TAVR status presenting for routine 30-day follow-up visit. Transthoracic echocardiogram shows reduced posterior leaflet mobility (arrow) with flow turbulence, colour Doppler flow paucity (arrow) and mildly increased transvalvular gradients. All findings supportive of prosthetic valve leaflet thrombosis. Bottom panels: A different patient who underwent transoesophageal echocardiogram for suspected leaflet thrombosis has similar findings of reduced leaflet mobility and flow turbulence with normal transvalvular gradients.
TEE clip of a 3D full volume data set with multiplanar reformatting. The patient received TAVR with a Medtronic CoreValve 29mm bioprosthesis. Note normal leaflet motion and delivery wire still present through the new bioprosthesis.
Multiple TEE clips of different patients showing different locations of paravalvular aortic regurgitation. Bottom right:- Quantification of paravalvular aortic regurgitation using multiplanar reformatting from full volume TEE data set with colour Doppler and measurement of 3D vena contracta area.
