Abstract
Aims: Angiographic ectasias and aneurysms in stented segments have been associated with late stent thrombosis. Using optical coherence tomography (OCT), some stented segments show coronary evaginations reminiscent of ectasias. The purpose of this study was to explore, using computational fluid-dynamic (CFD) simulations, whether OCT-detected coronary evaginations can induce local changes in blood flow.
Methods and results: OCT-detected evaginations are defined as outward bulges in the luminal vessel contour between struts, with the depth of the bulge exceeding the actual strut thickness. Evaginations can be characterised cross-sectionally by depth and along the stented segment by total length. Assuming an ellipsoid shape, we modelled 3-D evaginations with different sizes by varying the depth from 0.2-1.0 mm, and the length from 1-9 mm. For the flow simulation we used average flow velocity data from non-diseased coronary arteries. The change in flow with varying evagination sizes was assessed using a particle tracing test where the particle transit time within the segment with evagination was compared with that of a control vessel. The presence of the evagination caused a delayed particle transit time which increased with the evagination size. The change in flow consisted locally of recirculation within the evagination, as well as flow deceleration due to a larger lumen – seen as a deflection of flow towards the evagination.
Conclusions: CFD simulation of 3-D evaginations and blood flow suggests that evaginations affect flow locally, with a flow disturbance that increases with increasing evagination size.
Introduction
Drug-eluting stent (DES) implantation has revolutionised the treatment of coronary artery disease by dramatically reducing the rates of target lesion revascularisation, as compared to bare metal stent implantation. However, shortly after the introduction of DES, late stent thrombosis (LST) emerged as a major concern related to their use. Subsequent autopsy reports and in vivo imaging studies have suggested a number of mechanisms, including incomplete endothelialisation/uncovered struts, chronic inflammation, and stent malapposition, possibly triggered by the antiproliferative drugs and durable polymers1-4. Although newer-generation DES have significantly reduced the rate of LST, concern still exists for the patients who received a first-generation DES, not least as emerging data indicate a continued risk of LST over time with these devices5,6. Identification of reliable predictors that can be assessed with an accurate imaging technology is therefore needed.
Intravascular optical coherence tomography (OCT) has an ultra-high resolution of 10 µm allowing an in vivo histology-like evaluation of intracoronary stents including strut coverage and apposition, as previously validated7. Although the presence of uncovered and malapposed struts has been associated with LST8, OCT relatively often demonstrates the presence of these features even in lesions from asymptomatic patients at up to very long-term follow-up9. This suggests that additional mechanisms may be involved in causing these adverse events and, indeed, neoatherosclerosis was recently proposed as an additional potential cause of LST10,11. Using OCT in DES at follow-up after implantation, we have observed that some stented segments show outward bulging –“coronary evaginations”– of the luminal contour between struts (Figure 1A)9,12. Previous in vivo and computer-simulated haemodynamic studies have demonstrated that severe arterial dilations, such as aneurysms of the aorta, cerebral vessels and coronary arteries, are accompanied by changes in blood flow and shear stresses13-15. It has also been proposed that these features may be responsible for adverse events related hereto, namely ischaemia due to thrombosis and/or dissection14,15. Although the evaginations observed by OCT in DES are smaller than the aneurysms encountered in, e.g., Kawasaki’s coronary vasculitis with luminal diameters up to 28 mm13, it may be hypothesised that these evaginations –analogous to other vessel dilations– may cause disturbances in coronary haemodynamics, which may in turn promote local thrombogenicity. The purpose of this study was therefore to explore, using computational fluid-dynamic (CFD) simulations, whether OCT-detected coronary evaginations can induce local changes in blood flow and, if so, whether this varies for different evagination sizes.
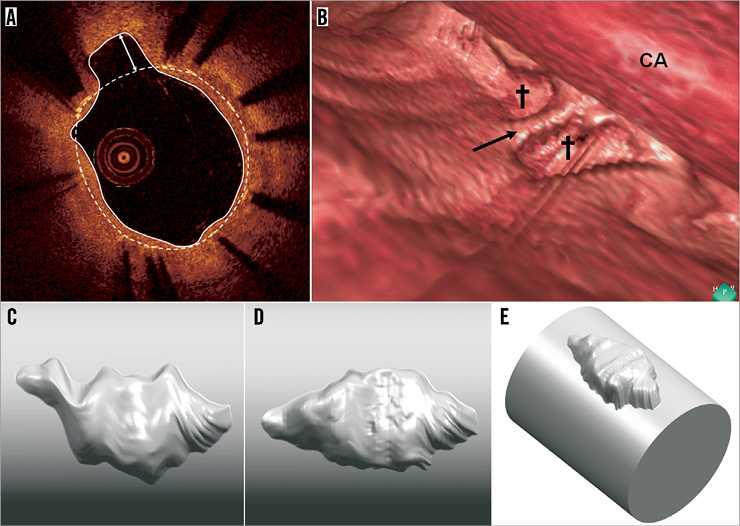
Figure 1. OCT-detected evagination. A) shows a cross-section of a stent where struts are visualised as bright spots with dorsal shadowing. The stent area is demarcated by the white dashed line connecting the endoluminal surfaces of struts. At 11 o’clock, the luminal contour (white trace line) creates an outward bulge in the vessel wall between struts. Since the maximum depth of the bulge (white double-headed arrow) is greater than the actual strut thickness, it is termed a coronary evagination. B) shows a 3-D reconstruction of a vessel segment with two evaginations (crosses) separated by a strut (black arrow). CA: OCT catheter. C and D show a 3-D reconstructed evagination before (C) and after (D) compensation for catheter rotation. In E, the evagination in D has been merged with a cylindrical vessel.
Methods
The study was set up in two steps beginning with the CFD simulation of a three-dimensional (3-D) reconstructed evagination obtained in vivo from a patient (referred to as “actual” evagination), yielding results which motivated additional flow simulations in modelled evaginations of varying sizes.
DEFINITION AND 3-D RECONSTRUCTION OF AN ACTUAL EVAGINATION
OCT-detected evaginations are defined in the cross-sectional view as outward bulges in the luminal vessel contour between struts, where the maximum depth of the bulge exceeds the actual thickness of the strut (Figure 1A). Accordingly, evaginations can be characterised quantitatively by a depth and an area. Evaluation of entire OCT pullbacks shows that evaginations are often present over several consecutive frames – something appearing as focal outward bulges on 3-D reconstructions (Figure 1B). In order to define how to computer-model evaginations, we selected an actual evagination representing a typical geometry as observed in ~300 previously studied evaginations, and reconstructed the 3-D geometry from a set of consecutive OCT slices. Each slice was expressed in a cylindrical coordinate system taking the centre of the stent as origin. The luminal vessel contour including the luminal evagination contour was given coordinates derived from a series of radii measured at one degree increments along the circumference of the vessel. The rotation of the vessel relative to the OCT catheter during pullback, mainly related to cardiac motion, was compensated for by first determining in each slice the vector pointing from the lumen centre to the evagination centroid, and, secondly, aligning the vectors throughout the slices using MATLAB® (MathWorks, Natick, MA, USA). In this way, we obtained a surface of the evagination, which was converted into a volume using Geomagic Studio® (Geomagic Solutions, Morrisville, NC, USA) and finally merged in Unigraphics NX (Siemens PLM Software, Plano, TX, USA) with a cylindrical vessel 3.55 mm in diameter according to the size of the original vessel. Figure 1C and Figure 1D show this 3-D reconstruction before and after compensation for catheter rotation, and Figure 1E shows the final result after merging with the cylindrical vessel.
COMPUTER MODELLING OF EVAGINATIONS
From this 3-D reconstruction and for simplicity, it is reasonable to assume an ellipsoid 3-D shape for the subsequent assessment of local flow changes in evaginations of varying sizes. These ellipsoids were modelled to protrude with no offset from a straight cylindrical vessel, meaning that the distance between the centreline of the vessel and the horizontal centreline of the evagination equals the vessel radius. The ellipsoid evaginations were inserted right at the inlet of the cylindrical vessel using SolidWorks (Dassault Systèmes SolidWorks Corporation, Waltham, MA, USA) (Figure 2A), and the obtained geometries were imported into COMSOL Multiphysics (COMSOL® Inc., Stockholm, Sweden) for the CFD simulations. For all simulations, the length of the vessel segment was 10 mm and the diameter 3 mm. For the evaluation of the effect of different evagination sizes on blood flow, we varied for each simulation the principal axes of the ellipsoids as follows: the depth was varied at 0.1 mm increments beginning from 0.2 mm up to 1 mm, with the width always equalling twice the depth of the evagination (Figure 2B). The length of the evagination was varied from 1 mm up to 9 mm, at 1 mm increments. The rationale for using these values and increments was based on the range of depths and lengths of ~300 studied evaginations (Figure 3). In order to compensate for the sharp edge between the cylinder and the ellipsoid which does not occur in vivo and which may lead to unwanted artefacts in CFD, we introduced a smoothing fillet with an arbitrary radius amounting to 10% of the evagination depth (Figure 2B). Considering the symmetry of the evagination and vessel, the simulation was performed for half of the geometry only.
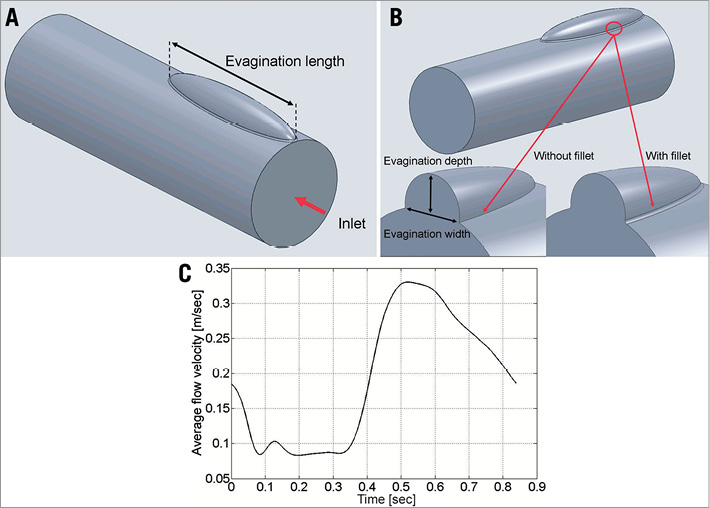
Figure 2. Modelling of evaginations and flow velocity. A) and B) show an example of a modelled elliptic evagination used in the simulations. The geometry is characterised by a length (A), a depth and a width (B). The sharp edge between the ellipsoid and the cylindrical vessel was compensated for by the insertion of a smoothing fillet (B). C) shows the flow velocity curve used in the simulations.
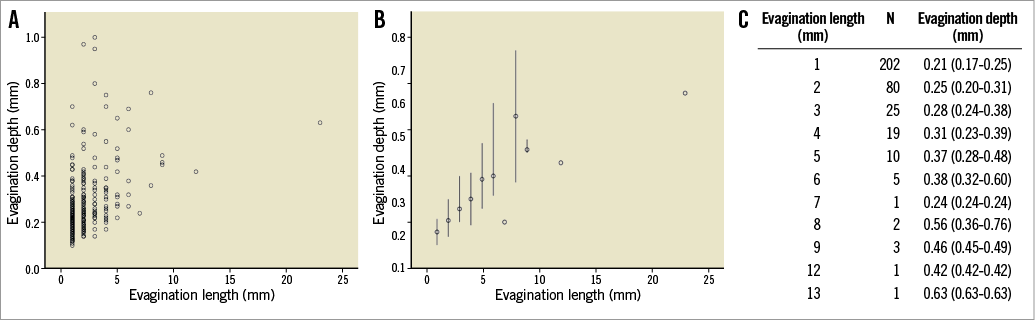
Figure 3. We previously studied 254 lesions implanted with DES at a follow-up time of 1 year (117 lesions), 2 years (49 lesions) and 5 years (88 lesions). The maximum length of consecutive cross-sections containing evaginations was calculated and the maximum depth within that specific “cluster” of cross-sections with evaginations was analysed. A) shows the depth and length of each studied evagination; B) shows the median depth (and range) of evaginations of a certain length whereas the table in C specifically shows the number and depth of evaginations of a certain length.
Assessment of haemodynamics in evaginations
MODELLING OF BLOOD FLOW
We used an average flow velocity curve (Figure 2C) attained by superimposition of coronary flow data from 23 patients assessed at steady state (without adenosine infusion) in non-diseased left anterior descending arteries. The flow velocity curves included the entire cardiac cycle with an average duration of 0.84 sec, corresponding to a heart rate ~71 beats/min. The average peak flow velocity amounted to 33 cm/sec. Doppler signals were measured using ComboWire® guidewires (Volcano Corp., San Diego, CA, USA) equipped with a miniaturised Doppler probe located at the tip and connected to a ComboMap® interface (Volcano Corp.) able to visualise and route incoming Doppler signals. The Doppler-derived instantaneous peak velocity signals were digitised at a sample frequency of 500 Hz using a NI cDAQ-9172 system equipped with a NI 9206 A/D-converter module (National Instruments, Austin, TX, USA). Signal averaging was performed using MATLAB (MathWorks). All recordings were obtained in the setting of another study, and were previously approved by the local ethics committee.
COMPUTATIONAL FLUID-DYNAMIC SIMULATION CONDITIONS
In the actual evagination, the Reynolds number at peak forward flow did not exceed 355 (Reynolds number based on blood density=1,060 kg/m3; blood viscosity=3.5 mPa·s; vessel diameter=3.55 mm; peak flow velocity=33 cm/sec), and therefore the flow was treated as laminar and computed using the Navier-Stokes equations for incompressible flow. The frequency spectrum of the flow curve shown in Figure 2C exhibits a strong peak at the fundamental frequency of the heartbeat, i.e., 1.19 Hz, and two other peaks of negligible amplitude at the second and third harmonic frequency. Using the Womersley theory16, we concluded that viscous effects dominate and that a Poiseuille flow can safely be assumed at the inlet of the vessel. A fully developed parabolic velocity profile was therefore set as inlet boundary condition. A zero-pressure zero-viscous-stress boundary condition was defined at the outlet. No-slip and slip boundary conditions were imposed at the vessel wall and the symmetry plane, respectively. The geometry was discretised with an automatically generated tetrahedral mesh comprising two boundary layers at the vessel wall (sweeping of a cross-sectional mesh along the vessel was not possible due to the presence of the evagination). A smooth initialisation of the time-dependent simulation was achieved by computing initial values for the flow in the vessel for a stationary situation with an inlet velocity of 18.5 cm/sec (Figure 2C, time=0 sec). Both the stationary and time-dependent computations used a PARDISO direct solver.
PARTICLE TRACING
Since the change in flow (pattern and velocity) with varying evagination dimensions cannot be quantified numerically using computational models, we performed a “particle tracing” test. This test model consists of simulating the release of a certain number of passive tracer particles (zero mass) at the inlet of the vessel and subsequently collecting them at the outlet. The passage of each particle can be characterised by the transit time, defined as the time elapsed from the moment a particle is released at the inlet until the particle has reached the outlet. Subsequently, one can derive the number and percentage of “delayed particles”, i.e., the number of particles that have a longer transit time as compared to a certain reference. As reference, we used the transit time of the slowest released particle in a control vessel without evagination. Accordingly, the transit time for each particle was determined and used as surrogate for the change in flow pattern and velocity in relation to the increase in evagination size by assessing the percentage of delayed particles.
Based on the results from the actual evagination, we concluded that particles located closer to the luminal centre are not affected by the evagination. We therefore released particles in six layers parallel to the vessel surface where the first layer was placed at an offset of 20 μm from the vessel wall and the remaining ones at 100 μm increments (Figure 4A). The percentage of delayed particles was determined for each layer separately. Accordingly, a certain particle in a layer was considered delayed when its transit time was longer than the transit time of the slowest particle in the corresponding layer of the control vessel. To eliminate the arbitrariness in selecting the radial position of the different layers, we combined the results from each layer to one single value, namely delayed particles (DP):
![]()
where n denotes the index of the layer and rn its radius, and l and d denote the length and the depth of the simulated evagination, respectively. This can be understood as integrating the orange area in Figure 4B over one complete revolution around the vessel centreline. Finally, we normalised DPl,d with the maximum DPl,d of all tested configurations:
![]()
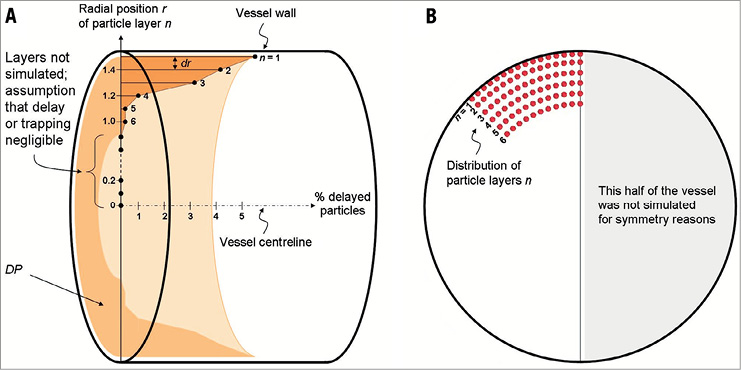
Figure 4. Set-up for the particle tracing test. The cylinder in panel A represents a modelled vessel (evagination omitted for simplicity) in which the vessel centreline is added as an x-axis. Along the y-axis, representing the vessel radius (1.5 mm), the distance from the centreline and the radial position (r) of various particle layers (n) is indicated. Accordingly, the layer closest to the vessel wall (n=1) is positioned 1.48 mm from the centreline, i.e., 20 µm from the vessel wall, with subsequent layers placed at 100 µm increments from the vessel wall towards the centreline (dr denotes the distance between two adjacent layers). Since particles closer to the centre of the vessel were not affected by the actual evagination, we included only layers 1-6 in the simulation of flow in modelled evaginations (B). To eliminate the arbitrariness in selecting the radial position of the different layers, we combined the results from each layer (% delayed particles) to one single value, namely delayed particles, DP (light orange volume), represented by the integration of the dark orange area over one revolution around the vessel centreline. The DP of each evagination size was then normalised to the maximum DP in the entire sample.
The particle tracing simulation was performed with the COMSOL Multiphysics software using the described flow velocity data. The total simulation time was set to four seconds, encompassing almost five cardiac cycles. The first cycle was used as a run-in period, after which sets of particles were released 100 times at a constant rate during the second cardiac cycle. The total simulation time of four seconds was chosen to allow sufficient time for all the released particles to reach the outlet in the control vessel. Time stepping in the time-dependent simulation was a critical issue since we had to deal with particles sticking to the wall due to numerical inaccuracy. By enforcing a maximal time step of five milliseconds, we ensured that the number of sticking particles did not exceed 0.5% for any layer. Sticking particles were excluded from the analysis.
Results
ASSESSMENT OF HAEMODYNAMICS IN THE ACTUAL EVAGINATION
The actual evagination measured (length×width×depth) 3.2 mm×1.5 mm×0.65 mm. Computational modelling of blood flow in terms of the particle tracing test revealed a local affection of flow through the vessel with evagination as compared to a control vessel without (Moving image 1). The flow closer to the luminal centre of the vessel appeared not to be affected by the evagination (Moving image 1). The change in flow consisted mainly of recirculation within the evagination, which occurred during the period in the cardiac cycle encompassing maximum speed and maximum flow deceleration (Figure 2C, Figure 5). The testing of a modelled evagination with dimensions comparable with the actual evagination (3.0 mm×1.2 mm×0.6 mm), but in a 3 mm vessel, showed qualitatively a similar flow behaviour with regard to the occurrence of recirculation (Figure 5), confirming that the model assumptions of vessels with evaginations were appropriate. Taken together, these findings motivated the further exploration of the impact of varying evagination size on local flow behaviour.
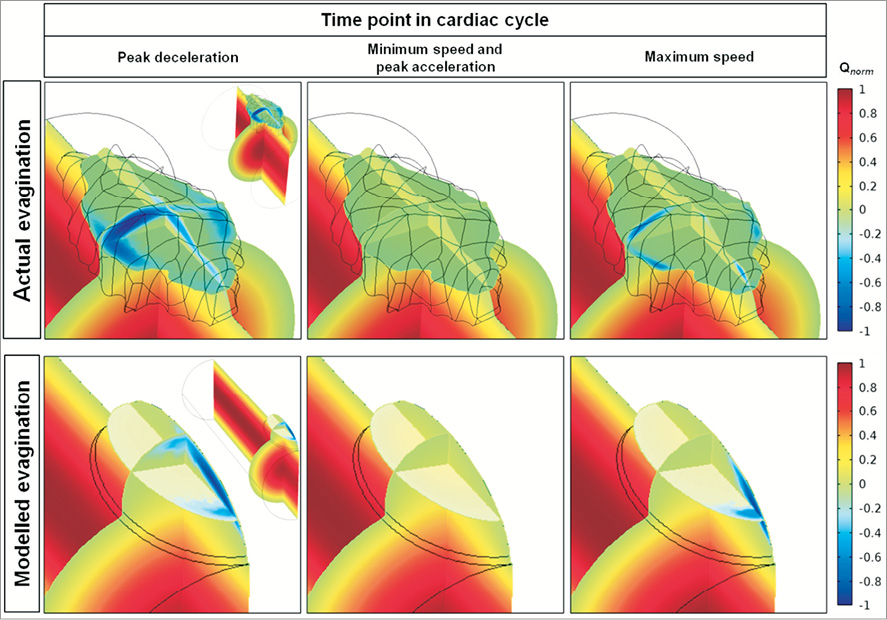
Figure 5. Change in flow induced by the actual and corresponding modelled evagination. The normalised flow velocity (Qnorm) is expressed in colour where red represents the maximum velocity of forward flow; green, flow stagnation (velocity=0); and dark blue, maximum velocity of backward flow. The vessel with an actual evagination is shown in the upper panels and the corresponding vessel with modelled evagination is shown in the lower panels, at different times in the cardiac cycle (in Figure 2C: peak deceleration=0.048 sec; minimum speed=0.198 sec; peak acceleration=0.41 sec; maximum speed=0.52 sec). The inlet is located closest to the viewer. For orientation purposes, zoomed-out images of the respective vessels are shown in the right corners of the upper and lower left panels. The flow velocity is shown in three dimensions by transsection of the evagination longitudinally (along the length of the vessel axis), cross-sectionally, and horizontally (at half the depth of the evagination). Accordingly, flow velocity is highest at the centre of the vessel and zero close to the vessel wall. Backward flow and thus recirculation is evident close to the luminal surface at the proximal half of both evaginations. As seen by the black mesh, the actual evagination displays an irregular surface.
ASSESSMENT OF HAEMODYNAMICS IN MODELLED EVAGINATIONS
A total of 81 vessels with modelled evaginations of different sizes were assessed. The particle tracing test showed that the number of particles being delayed on their passage through the vessel segment with evagination as compared to the control segment –expressed as the normalised DP– increased with increasing evagination size (Figure 6A). In addition, there was a tendency towards depth playing a greater role in local affection of flow in certain shorter evaginations compared to some longer evaginations, as evidenced by the asymmetrical change in DP (Figure 6A). To evaluate this more closely, we selected the simulated depth where this effect was most pronounced, namely 1 mm, and plotted the magnitude of normalised DP against the evagination length (Figure 6B, solid line). This showed more clearly the slight increase in the number of delayed particles in shorter evaginations at this depth followed by a small decrease and then an almost linear increase with increasing evagination length. By inspection of the animated particle trajectories of the individual particle tracing tests, we observed that recirculation prevailed in shorter evaginations (1-3 mm), whereas the flow deceleration and deflection increased with evagination length and depth (Moving image 2). Based on these qualitative findings, the course of the solid curve in Figure 6B may be explained by two components, namely deceleration due to larger lumen, which increases the transit time linearly with evagination length and depth, and recirculation, which is most pronounced at lengths below 4 mm. The solid curve in Figure 6B can thus be decomposed into two curves: a flow deceleration curve (dotted line), obtained by setting the intercept at zero and adjusting the slope to obtain a tangential contact to the more linear part of the original normalised DP curve, and a recirculation curve (dashed line), obtained by subtracting the deceleration curve from the original normalised DP curve. By comparison of Figure 6A and Figure 6B we observed that the dip in DP in the colour plot is the point where recirculation becomes irrelevant based on the graph in Figure 6B (at evagination length 4 mm, where the decrease in overall DP [solid line] has stagnated and where the DP caused by recirculation [dashed line] approximates 0). This specific point was determined for various evagination depths, as shown by the crosses in Figure 6A, which could be more or less approximated by a straight line. Accordingly, for evaginations located to the left of this line, recirculation is the predominant mechanism to explain the increase in number of delayed particles, whereas the asymptotic dashed curve represents the cut-off for evagination sizes above which recirculation can be observed for at least one particle once during one cardiac cycle.
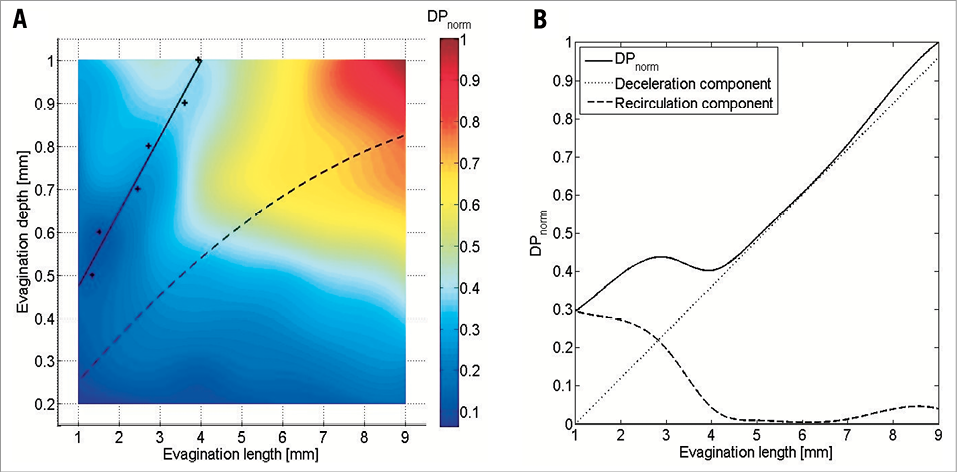
Figure 6. Results of the particle tracing test. A) shows the normalised number of delayed particles (DPnorm) in modelled vessels with evaginations of varying sizes as compared to a control vessel without evagination. The increase in DPnorm generally increases with increasing evagination size; however, there is a tendency towards a relatively greater increase for deep evaginations (0.7-1.0 mm) even at smaller lengths (2-4 mm). This is most pronounced at 1 mm depth. B) shows the result after plotting DPnorm for depth 1 mm against the evagination length (solid line) showing more clearly the increase in DP followed by a decrease and then again an increase. According to particle trajectory lines (Moving image 2), the initial increase is represented by recirculation, whereas the subsequent increase is more related to the flow deceleration due to the larger lumen at the evagination, seen as a deflection of flow towards the evagination. The solid line can thus be decomposed into a deceleration (dotted line) and a recirculation component (dashed line). Determination of the point where the recirculation component becomes irrelevant for various evagination sizes (crosses in A) yields the linear solid curve in A, whereas the asymptotic dashed curve represents the cut-off for evagination sizes above which recirculation can be observed for at least one particle at least once in the cardiac cycle (dashed curve determined by inspection of the animated particle trajectories).
Discussion
In the present study, we assessed the potential influence of coronary evaginations on blood flow with the following main findings. 1) Computational modelling of flow in a 3-D reconstructed vessel with an actual evagination showed that the presence of the evagination affects flow locally by inducing both a general flow deceleration due to a larger lumen, seen as a deflection of flow towards the evagination, as well as recirculation of flow within the evagination. 2) The use of a modelled ellipsoid evagination of similar dimension to an actual evagination demonstrated similar changes in flow. 3) The affection of flow as measured by the number of “delayed simulated particles” appeared to increase with increasing evagination size.
THE EFFECT OF EVAGINATIONS ON BIOMECHANICAL CONDITIONS
It is generally accepted that biomechanical conditions play an important role in the genesis and development of vascular disease17-19. As expressed by the triad of Virchow, disturbances in blood flow may lead to stasis and thereby thrombosis20. This is the first computational flow study to describe the magnitude of stasis by particle tracing within the newly described morphological finding of coronary evaginations. Compared to previous reports on haemodynamic investigations of vascular aneurysms13,21,22, we observed similar flow disturbances in the region of evaginations in terms of stagnation and flow reversal, suggesting that, although relatively small compared to true aneurysms, coronary evaginations have the potential to affect blood flow and may thus be of clinical relevance. As compared to the study of haemodynamics in aortic aneurysms, which is typically performed in selected individual cases15,21, we estimated more broadly how the magnitude of flow disturbance varies with incremental changes in evagination lengths and depths, based on data obtained from an in vivo study employing OCT. The flow disturbance appeared to increase with increasing evagination sizes. Specifically, we observed a non-linearity in flow alteration with a transient relatively larger increase for short evaginations at greater depths as compared to longer evaginations (Figure 6), apparently due to an inconsistent variation in the magnitude of flow reversal and deceleration at different evagination sizes. The cause of this non-linearity can only be speculated, and one possibility may relate to the geometrical shape of the evaginations. The gradual increase in depth in short evaginations is relatively larger in relation to the length as compared to longer evaginations. Thus, the former acquire a somewhat “saccular” shape sooner than the latter, which remain “fusiform” until the depth is increased relatively more. Although a specific relationship between the severity of flow disturbance and ectasia size and shape had not been established previously, haemodynamic simulations of individual aortic aneurysms suggest that saccular aneurysms generally affect flow relatively more than those that are fusiform21. However, there is a suggestion that the magnitude of flow disturbance depends not only on the maximum cross-sectional area of the aneurysm but also on the total size of the recirculation zone, which can be considerable in fusiform vessel dilations21.
POTENTIAL CLINICAL IMPLICATIONS
In the setting of vascular aneurysms, the main purpose of fluid-dynamic simulations is to assess the risk of rupture in order to initiate timely intervention23. In this regard, focus has mainly been on wall shear stresses and oscillatory shear indices with data indicating that high oscillations in shear stresses during the cardiac cycle correlate with a risk of rupture22. As compared to large aneurysms of native vessels, it may be postulated that rupture of coronary evaginations is rather unlikely due to an assumedly stabilising effect of the stent. Instead, there may be a risk of thrombosis considering the presence of stasis and recirculation. Based on this, our aim was to study flow behaviour within lesions with evaginations, and therefore analysis of wall shear stress was omitted. We previously reported the occurrence of very late thrombosis in stented segments exhibiting evaginations9. Although the mechanisms leading to thrombosis in lesions with evaginations are unclear, above all two particular possibilities are attractive. Firstly, evaginations may induce thrombosis directly by promoting the convection of platelets towards the vessel wall where stasis and recirculation contribute to their aggregation. Secondly, thrombosis may occur following a co-action of evaginations with other risk factors to increase the risk for thrombosis. In a recent study of 254 lesions treated with DES and imaged with OCT at one to five years, we found a significantly higher frequency of malapposed and uncovered struts in lesions with evaginations as compared to those without24, both features associated with stent thrombosis1,3. In addition, non-occlusive (subclinical) thrombus was more common in lesions with evaginations. On further analysis, IVUS suggested positive remodelling to be the mechanism of evaginations. It is conceivable that, with continuing outward remodelling of the vessel, it may at some point detach from the rigid stent exposing not only tissue factor but also stent struts which consequently become malapposed. These features in combination with the flow disturbances caused by evaginations fulfil all the criteria of the triad of Virchow (Figure 7A), suggesting a high propensity of thrombosis. Accordingly, in the presence of evaginations, malapposed and uncovered struts may be more prone to serve as a nidus for thrombus formation (Figure 7B).
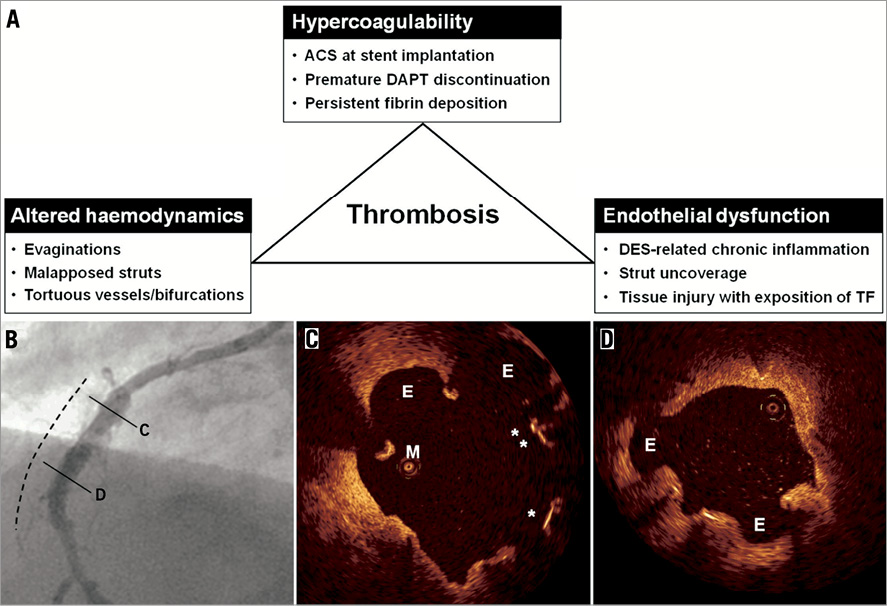
Figure 7. Factors associated with late stent thrombosis. A) shows a number of factors associated with late stent thrombosis and classified according to the triad of Virchow. B) and C) show the angiographic and OCT findings in a case of late stent thrombosis. This 54-year-old male had a sirolimus-eluting stent implanted in the right coronary artery in the setting of a STEMI. Seventeen months later, clopidogrel was discontinued and, 27 months following stent implantation, the patient presented with an inferior STEMI. One week following thrombolysis, angiography showed peri-stent contrast staining in the previously stented segment (dashed line). OCT demonstrated evaginations (E), malapposed (M), and uncovered (*) struts, as shown in C and D. Please note that OCT was performed without a guidewire, which is a differential diagnosis for the malapposed strut in C. ACS: acute coronary syndrome; DAPT: dual antiplatelet therapy; DES: drug-eluting stent; TF: tissue factor
Assuming the proposed coaction of various risk factors, it seems logical that the clinically relevant threshold of evagination depth and length would also depend on the relative extent of the other risk factors and vice versa. Nevertheless, it is tempting to speculate on a threshold above which evaginations may induce clinically relevant flow disturbances. Imai and colleagues previously assessed the clinical importance of peri-stent contrast staining (PSS) –an angiographic phenomenon observed in previously stented segments, suggested to be due to vessel ectasias at these sites25. In lesions with PSS, per definition extending >20% and >100% of the stent diameter, in the depth and length, respectively (e.g., in a 3 mm stent this would mean a cut-off for ectasia/evagination depth >0.6 mm and length >3 mm), they found an increased risk of target lesion revascularisation and stent thrombosis as compared to lesions without PSS. Since evaginations and PSS reflect the same phenomenon (Figure 7B), it is interesting that PSS dimensions above the defined cut-off occur in Figure 6A in the region with increased flow disturbance, suggesting that this cut-off might be clinically relevant. Considering the above, it is possible that the pattern of flow disturbance (flow recirculation vs. deceleration) at the site of evagination is less important than the size of evagination. Although it is unknown whether increasing evagination size with/without other risk factors indeed translates into clinical events, the findings of the present study will hopefully stimulate further investigations to assess the impact of evaginations on clinical outcomes.
Limitations
For simplicity, we omitted the modelling of the stent, which might alter haemodynamics, as this would have required consideration of different stent designs and strut thicknesses, yielding an unsurpassably large number of combinations to test. The tested regular ellipsoid shape of our modelled evaginations in conjunction with a “healthy” straight cylindrical vessel of only one size may not reflect in vivo evaginations correctly, with their complex luminal configurations. Furthermore, the tested vessel segment assumed only one single evagination per cross-section, and thus the assessment of interplay in case of several evaginations was omitted. Additionally, a side effect of the compensation of vessel rotation around the catheter may be an excessive straightening of the shape of the evagination that may further affect haemodynamics. With respect to the fluid-dynamic simulation conditions, our simulation model used massless particles, which together with the particle layer approach may not precisely reflect the in vivo blood flow. Furthermore, due to the lack of published data relating the exposure time to stagnating and recirculating flow with the rate of thrombocyte adhesion, we could not use the derived metric DP to predict thrombus formation in an evagination. The results were therefore normalised.
Conclusion
OCT-detected coronary evaginations in stented segments represent an outward bulging of the luminal contour between struts. Following computational modelling of 3-D evaginations and blood flow, we found that evaginations affect flow locally, and that the flow disturbance increases with increasing evagination size. The clinical implications of these findings need to be evaluated further.
Guest Editor
This paper was Guest Edited by Rafael Beyar, MD, DSc, MPH; Rambam Health Care Campus (RHCC), & Technion, Haifa, Israel.
Funding
This work was supported by the following funding: M. Radu has received research grants from The Heart Centre Rigshospitalet Research Foundation and Copenhagen University. L. Räber and S. Windecker have received grants from the Swiss National Science Foundation (Grant 33CM30-124112).
Conflict of interest statement
The authors have no conflicts of interest to declare. The Guest Editor has no conflicts of interest to declare.
Online data supplement
Moving image 1. Panels A and B show the particle trajectories during the particle tracing test of the 3-D reconstructed actual evagination. In panel A, the particles are released in a random fashion, where it is evident that particles located closer to the lumen were not affected by the evagination, whereas particles closer to the vessel wall were both deflected towards the evagination and recirculating within the evagination. For reasons of simplicity, the simulation was therefore performed with 6 layers of particles, as shown in panels B and C, the latter showing the results within a control vessel without evagination. The particle colour indicates the release time (blue=first set of particles; red=last set of particles).
Moving image 2. This image shows the results of the particle tracing test in a control vessel and in modelled vessels with evaginations of varying depths (ED) and lengths (EL). Recirculation is most prominent in shorter evaginations, whereas the overall flow deceleration due to the larger lumen at the evagination, seen as a deflection of flow towards the evagination, increased steadily with increasing evagination length. The particle colour indicates the release time (blue=first set of particles; red=last set of particles).