Abstract
Inadequate stent expansion and apposition during percutaneous coronary intervention increases the risk of subsequent restenosis and thrombosis. In repeat and complex percutaneous interventions, such as treatment of stent restenosis or bifurcation techniques, these aspects present a renewed importance. Intravascular ultrasound (IVUS) constitutes the standard technique to assess stent expansion, but its use in clinical practice is far from being universal. Although most current stent designs are radiolucent, new radiological imaging modalities, specifically tailored to coronary stent imaging, can render images with enough quality to visualise stent sub-expansion. While this approach might be complementary to IVUS in clinical practice, few in vivo studies comparing both techniques are available. In this article we review the principles of digital enhancement of stent images and the available validation studies. Furthermore, we report on a comparison between IVUS and digital enhancement stent images performed after coronary stenting.
Introduction
Suboptimal stent deployment is a predisposing factor of stent thrombosis and restenosis. The relationship between stent under-expansion and thrombosis was demonstrated by Colombo et al in a pioneering work with intravascular ultrasound (IVUS)1. Stent thrombosis (ST) has high associated rates of death and non-fatal myocardial infarction, and its incidence has not decreased with the advent of drug eluting stents (DES). As a matter of fact, DES have introduced new concerns about this feared complication: although in the short term stent thrombosis occurs at similar rates after bare metal (BMS) implantation, very late ST is more frequent with DES, with a maintained annual risk of 0.2%2. The relation between stent expansion and restenosis has been also thoroughly established both in the BMS and DES eras, and is particularly marked in certain subsets, such as small vessels, diabetic patients and long lesions3,4. In secondary revascularisation for stent restenosis, establishing whether stent under-expansion ocurred after the primary procedure is of great importance, since correction of this problem seems mandatory to ensure long term results of the secondary procedure.
Although IVUS is the technique of choice in assessing the results of coronary stenting, its routine use in PCI is far from being universal: it is used only in 5-8% in catheterisation laboratories of the USA, and even less in Europe5,6. Some of the likely reasons behind this apparent underutilisation include cath lab workload, time required, dubious cost-effectiveness, and a general trust that the high pressure stent ensures adequate stent expansion and apposition7.
Angiographic assessment of stent expansion, although desirable, has never been considered due to technical difficulties associated with angiographic visualisation of the stent silhouette. Stent radiopacity depends basically on two variables: stent strut thickness and atomic number of its components. Given the inverse relationship between stent strut thickness and development of fibrous hyperplasia, new designs use metal alloys (like chromium cobalt alloy) that make possible the use of thinner struts while keeping adequate radial support. This, in return, increases stent radiotransparency. Besides, excessive stent radiopacity –like that observed in early tantalum designs severely interferes with angiographic assessment of the result of stent implantation, and therefore is avoided. Pulse frequency of the fluoroscopic beam also affects the stent visualisation8.
A potential alternative to evaluate stent deployment is the use of new technologies of digital enhancement of angiographic images, specifically tailored to the visualisation of stents. In this article we explore the feasibility of obtaining adequate measurements of luminal stent dimensions with this technology, using IVUS as a standard of reference for stent luminal diameters. A review of the existing literature on the subject is also performed.
Methods
Image stent enhancement protocol
We investigated the validity of a recently developed image enhancement angiographic tool (Stent Boost, Philips Medical Systems Nederland B.V., Best, The Netherlands), which enables enhanced visualisation of the stent with an improved signal-to-noise ratio. The latest version of this digitalised enhancement system (DE) provides an improved quality stent image and its relation to the surrounding vasculature. To achieve an enhanced stent image, a dedicated acquisition protocol has to be selected on the cathlab system (Philips Allura Xper series, Philips Medical Systems Nederland B.V., Best, The Netherlands). Enhanced stent images were generated from 45 frames of cine acquisition without contrast injection (at a selected rate of 30 frames per second). The cine images were automatically transferred to a dedicated workstation.
The technique of DE used by StentBoost is based on the automatic detection of the proximal and the distal marker of the balloon in each of the images from a cine run9. Marker detection is based on the detection of blob like structures10. The algorithm uses one of the cine images as reference image. The position and orientation of the markers and the distance to each other are extracted and calculated in all images. These parameters are used to motion compensate for cardiac and respiratory motion. All images are warped to the reference image using translation, rotation and stretching techniques. Finally all images are superimposed, resulting in enhanced stent visualisation (Figure 1).
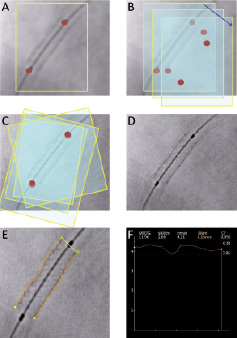
Figure 1. Schematic representation of the digital enhancement protocol used in this study (StentBoost). A: Following image acquisition immediately after stent deployment, a region of interest (ROI) encompassing the balloon markers of the stent delivery system is defined. B: In subsequent images, automatic tracking of the radiopaque markers is performed by the system as they move within the cardiac cycle. C: The obtained images are then aligned using the balloon markers as a reference. D: A final enhanced image is generated from the previous steps. E: Automatic tracking of stent edges is performed for quantification, using the catheter tip as a scaling device. F: A stent diameter function curve is generated from individual scan lines along the stent image; minimal luminal stent diameter is identified from this curve.
Acquisition of in vivo data
A total of 19 stents were implanted in 14 consecutive patients scheduled for elective percutaneous coronary intervention at our institution. Informed consent was obtained in all patients. Stent type and size, as well as the decision to perform predilation of the stenosis, was left to discretion of the operator. Following stent deployment, X-ray angiography runs were performed with the deflated balloon still in place. Coronary angiography was performed using a Phillips Integris H5000 system.
Following administration of heparin (100 µg/Kg) and intracoronary nitroglycerine (300 µg) to control vasomotor tone, coronary angiography in two orthogonal angiographic views was performed. After crossing the wire and, when required, predilation of the stenosis, the coronary stent was positioned and deployed. The type of stent and pressure of deployment were chosen by the operator. Immediately after balloon deflation, acquisition of images with the DE protocol was performed at 30 frames per second in the same angiographic projections used at baseline without moving the deflated balloon. IVUS imaging was then performed with a 40 Mz 3.0 Fr transducer (Boston Scientific Atlantis SR plus, Boston Scientific, Natick, MA, USA) using monitored automatic pullback at a speed of 0.5 mm/s. The images were stored for further analysis in the same IVUS console (Boston Scientific E-Lab,Boston Scientific, Natick, MA, USA) used for IVUS imaging.
Post-processing of DE and IVUS images
Measurements of stent diameters in DE were performed using a dedicated workstation (Philips H5000 system, Philips Medical Systems, Eindhoven, The Netherlands). The outer border of the stent silhouette is manually traced and calibration is performed using the guiding catheter as a scaling device. Minimal luminal stent diameters are then automatically displayed by the DE software as a diameter function curve. Luminal (intra-stent) area and diameters (maximal and minimal) were measured with IVUS at 1 mm intervals within the stent using the measurement tools included in the E-Lab IVUS console. To compare measurements and minimise potential errors with both techniques, three reproducible points within each stent were chosen: at the proximal quarter of the stent, in the middle and in the distal quarter of the stent. Longitudinal IVUS reconstruction and stent diameter function curves were used to establish the correlation between IVUS and DE measurements. (Figure 2).
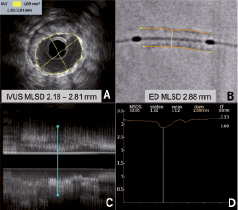
Figure 2. Comparison between intravascular ultrasound (IVUS) and digital enhancement (DE) measurements of minimal stent diameter. Intravascular ultrasound measurements use either luminal stent area or maximal and minimal stent luminal diameters (A) in specific sections selected from longitudinal reconstruction (C). On the contrary, DE obtain diameter measurements from the identified outer stent edges (B), which then are plotted in a stent diameter function curve (D). This example case shows how minimal stent diameter identified with DE may overestimate IVUS stent diameter due to luminal eccentricity.
Statistical analysis
Data are presented as mean values and standards deviation for continuous variables and as percentage for categorical variables. Pearson correlation analysis was utilised to evaluate differences between IVUS and SB measurements. Bland-Altman analysis was used to assess the grade of agreement between two methods of measurements. All analysis were performed using the statistical software StatView version 5.0.1 (SAS institute Inc, Cary, NC, USA).
Results
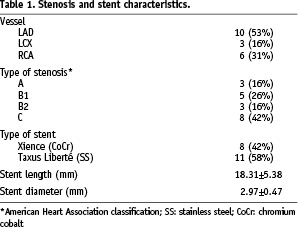
The characteristics of the stenoses and the implanted stents are shown in Table 1. Two different stents designs were used: the cobalt chromium Xience (Abbott Vascular, Redwood City, CA, USA) and the stainless steel Taxus Liberté (Boston Scientific, Natick, MA, USA). No complications were recorded during percutaneous intervention.
Correlation analysis between minimal stent diameters assessed with DE and IVUS was good, with a correlation coefficient of 0.80 (Figure 3-A). Digital enhancement overestimated minimal stent diameter as assessed with IVUS by 0.39±0.24 mm. Bland-Altman analysis of DE and IVUS measurements, shown in Figure 3-A, illustrates how this overestimation was evenly distributed throughout the complete range of luminal stent diameter measurements. Since overestimation of luminal stent diameter by DE might be due to differences in stent edge tracing (outer edge in DE vs. inner edge in IVUS), a second analysis of data was performed introducing a correction for nominal stent strut thickness, as facilitated by the manufacturers (Xience stent 0.081 mm, Taxus Liberté stent 0.097 mm). The correction was performed by substracting 0.16 mm and 0.19 mm to DE-derived diameters of Xience and Taxus Liberté stents respectively. Figure 3 shows the result of the Bland Altman analysis after this corrections with the solid dots.
The analysis of the 57 measurements in the three pre-specified, non-minimal luminal locations within 19 stents, revealed a correlation coefficient of 0.70 and an overestimation of IVUS diameter of 0.31±0.30 mm. Bland-Altman analysis was also performed for these non-minimal stent luminal diameters (Figure 3-B). The analysis with DE diameter adjusted to strut thickness revealed a persistent mean overestimation of 0.13±0.30 mm.
Discussion
The present study shows that stent measurements obtained with DE technology correlate well with intraluminal measurements obtained with IVUS. A small consistent overestimation of stent luminal dimensions by DE was observed both at minimal luminal and non-minimal luminal locations. These findings suggest that DE may be a useful tool for routine assessment of stent expansion after implantation, contributing to identify those cases in which additional IVUS imaging may be particularly useful for monitoring the result of the intervention. The potential uses and improvements in the technique are discussed below. An interpretation of our results in the context of other studies is also performed.
A systematic review of literature showed that studies on digital enhancement of stent images are limited11-21, mostly case reports15-19,21. Four publications are clinical research studies11-13,21, and only two of them validated DE with QCA, IVUS or both11,20. Koolen et al studied 27 patients undergoing coronary stenting, comparing IVUS and DE stent luminal diameter with a similar methodology to that used in our study11. Like in our study, they found a good correlation between measurements (r=0.81), and a similar degree of diameter overestimation when compared to IVUS (0.15±0.22 mm). A similar correlation (r=0.77) between IVUS and DE has been reported by Mishell et al in 48 coronary stents20. Coronary calcification interfered with this correlation, which was 0.99 in cases without calcification, 0.84 with deep calcification, and 0.57) if superficial calcification was present. Overestimation of the stent diameter also occurred (mean 0.039 mm).
These findings are in agreement with our study, suggesting that an overall good correlation between luminal stent diameters measured with both techniques exists, at the expense of a consistent overestimation of the true stent inner diameter. Several explanations can be put forward for this. Tracing of the stent borders is different with both techniques: in DE the outer stent border is traced, while in IVUS measurements are performed in the inner stent border. Enhanced stent radiopacity by DE and strut echogenicity in IVUS preclude the tracing of the alternative stent border with these techniques. Our study shows that when measurements are adjusted to strut thickness to correct this phenomenon, the discrepancy between measurements decreases substantially (Figure 3). Other reasons that may contribute to the discrepancy in DE and IVUS measurements are the planar nature of DE images, which are contrasted with two dimensional IVUS sections (Figure 2), and the use of the coronary catheter as a scaling device. In the analysis performed in non-minimal luminal locations a geometrical mismatch between DE and IVUS, measurements might have occurred in spite of using longitudinal IVUS reconstruction and DE diameter function curves for matching measurements with both techniques. This might explain why the correlation coefficient for this location was lower than that found in minimal luminal stent measurements.
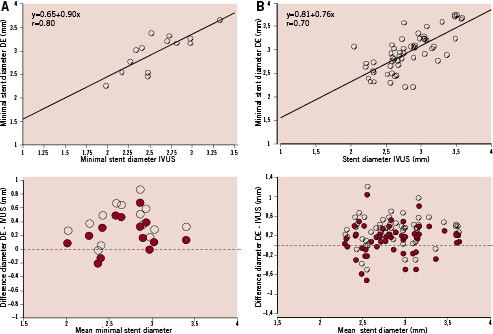
Figure 3. Linear correlation between IVUS and DE stent diameters and Bland Altman plots (BAP) showing discrepancy between measurements obtained with both methods. Solid dots in BAP show DE diameters corrected for stent strut thickness. A: Minimal stent diameter data. B: Non-minimal stent diameter locations.
Acquisition and analysis of DE of coronary stents is simple and not time consuming. A marked improvement in image quality has been documented using semi-quantitative scales11,12. One of the advantages of DE is that stent images are obtained without opacification of the coronary tree, therefore without overlapping of coronary branches: choosing the angiographic projection more perpendicular to the stent for DE acquisition is not limited by this fact. Blurring of the image can occur if the balloon moves within the stent during the cardiac cycle, or if the angiographic projection in which DE was performed shows the stent moving in several planes (Figure 4). Foreshortening of the stent may introduce distortion of the stent silhouette during image adjustment to the balloon markers. Calcification of the vessel wall also interferes with DE, as demonstrated by Mishell et al20.
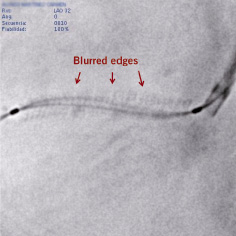
Figure 4. Blurred enhanced stent image resulting from off-plane movement of the stent during the cardiac cycle in the angiographic projection used. Balloon markers are sharply focused since they are used as landmarks for the digital enhancement protocol, but stent edges and guidewire are blurred.
Several authors have applied DE to different clinical and research aspects. Ohanessian et al reported on the use of DE to decide whether post-dilation should be performed after stent deployment12. DE has also been used to investigate the effect of prolonged balloon inflation on luminal stent diameter13, finding a relationship between balloon inflation times during stent deployment and the resulting stent expansion. Other benefits derived from improved stent visualisation with DE have been reported, like its use in the positioning of stents in crushing techniques, ascertaining the cause of balloon entrapment in an incompletely expanded stent19, or recognising stent undeployment21.
Although initial clinical experience suggests good results, the method has to be compared with IVUS in more detailed and larger series of patients. Probably, the main limitation of the technique is that it produces two-dimensional images, and therefore leaves the possibility of missing portions of under-expanded stent, even if done in orthogonal views. Future developments might include three dimensional reconstruction from orthogonal images acquired with DE to overcome this problem. Automatic tracing of the inner stent edge in DE might decrease the systematic overestimation of IVUS measurements. Another limitation of the technique is the need of balloon markers inside the stent. This leaves out the possibility of visualising stents implanted in previous procedures without further vessel instrumentation. The use of guidewires with radio-opaque markers might be introduced to perform assessment during follow-up or when balloon markers are not present.
Although further improvements are needed, DE seems to be a promising tool to evaluate stent expansion. Future developments may prove useful in assessing whether this is the underlying cause of long-term failure, allowing adequate planning of secondary revascularisation. Digital enhancement appears as a complement to IVUS and not as its substitute, favouring routine assessment of stent expansion and allowing visualisation of stents in certain situations in which IVUS cannot be performed.