Abstract
BACKGROUND: Intracranial atherosclerotic stenosis (ICAS), an important cause of stroke, is associated with a considerable stroke recurrence rate despite optimal medical treatment. Further assessment of the functional significance of ICAS is urgently needed to enable individualised treatment and, thus, improve patient outcomes.
AIMS: We aimed to evaluate the haemodynamic significance of ICAS using the quantitative flow ratio (QFR) technique and to develop a risk stratification model for ICAS patients.
METHODS: Patients with moderate to severe stenosis of the middle cerebral artery, as shown on angiography, were retrospectively enrolled. For haemodynamic assessment, the Murray law-based QFR (μQFR) was performed on eligible patients. Multivariate logistic regression models composed of μQFR and other risk factors were developed and compared for the identification of symptomatic lesions. Based on the superior model, a nomogram was established and validated by calibration.
RESULTS: Among 412 eligible patients, symptomatic lesions were found in 313 (76.0%) patients. The μQFR outperformed the degree of stenosis in discriminating culprit lesions (area under the curve [AUC]: 0.726 vs 0.631; DeLong test p-value=0.001), and the model incorporating μQFR and conventional risk factors also performed better than that containing conventional risk factors only (AUC: 0.850 vs 0.827; DeLong test p-value=0.034; continuous net reclassification index=0.620, integrated discrimination improvement=0.057; both p<0.001). The final nomogram showed good calibration (p for Hosmer-Lemeshow test=0.102) and discrimination (C-statistic 0.850, 95% confidence interval: 0.812-0.883).
CONCLUSIONS: The μQFR was significantly associated with symptomatic ICAS and outperformed the angiographic stenosis severity. The final nomogram effectively discriminated symptomatic lesions and may provide a useful tool for risk stratification in ICAS patients.
Intracranial atherosclerotic stenosis (ICAS) is an important cause of ischaemic stroke and transient ischaemic attack worldwide and is associated with a high risk of recurrent stroke1. Aggressive medical treatment, including antiplatelet therapy and management of vascular risk factors, markedly reduces the risk of recurrence in ICAS patients, but the residual risk for stroke relapse is still substantial23. The risk of a 12-month recurrent stroke is up to 8.3% for patients with persistent adherence to guideline-based secondary stroke prevention4. Therefore, accurate stratification of risk is required to optimise the management of ICAS patients and, potentially, enable individualised therapy.
Luminal stenosis measured with digital subtraction angioÂgraphy (DSA) remains the main metric for assessing the severity of ICAS. However, moderately stenotic lesions have a non-negligible risk of stroke5. Therefore, the physiological assessment of ICAS has gradually been attracting attention to achieve better risk stratification for patients67.
Fractional flow reserve (FFR) is the guideline-recommended modality for the functional assessment of coronary artery stenosis8 but is rarely used in cerebral artery stenosis. Previous exploratory studies employed computational fluid dynamics (CFD) modelling based on computed tomography angiography (CTA) or magnetic resonance angiography (MRA) for haemodynamic simulation; these studies revealed that FFR and other haemodynamic metrics were associated with stroke recurrence in ICAS patients910. However, the clinical application of CTA/MRA-CFD has been severely hampered by limited spatial resolution and high computational costs11.
Quantitative flow ratio (QFR) is a novel approach for the fast computation of a virtual FFR value based on angioÂgraphic images12. It is a promising assessment tool for the functional assessment of coronary stenosis without inducing hyperaemia or using a pressure wire. In recent years, QFR has been widely recognised to have superior diagnostic performance and prognostic value13. The QFR-guided lesion selection strategy could significantly improve percutaneous coronary intervention outcomes compared with traditional angiographic guidance1415. Most importantly, our recent study demonstrated that the Murray law-based QFR (μQFR) could achieve comparable results to the wire-based FFR and showed excellent diagnostic performance in the functional assessment of cerebral arterial stenosis16. This was the first application of the QFR technique for intracranial arterial assessment, and it confirmed the feasibility of this novel approach to determine haemodynamically significant ICAS lesions.
In this study, we aimed to evaluate the haemodynamic status of patients with moderate to severe middle cerebral artery (MCA) stenosis using a novel QFR approach, identify the factors related to ischaemic symptoms, and then develop a risk stratification model (nomogram) for predicting stroke risk in ICAS patients.
Methods
DATA AVAILABILITY STATEMENT
The data for this study are available from the corresponding author upon reasonable request.
PATIENTS AND STUDY DESIGN
From January 2012 to October 2021, our study retrospectively enrolled consecutive patients with unilateral MCA M1 segment stenosis ≥50%, confirmed via DSA, from the prospective database of the Nanjing Stroke Registry Program.
The inclusion and exclusion criteria are detailed as follows. Inclusion criteria were a) age >18 years; b) unilateral MCA M1 segment stenosis ≥50% and <95% (non-occluded lesion), confirmed via DSA; and c) presence of at least one atherothrombotic risk factor (such as hypertension, diabetes, hyperlipidaemia, smoking history, etc.). Exclusion criteria included the following: a) non-atherosclerotic vasculopathy, such as dissection, vasculitis, or Moyamoya disease; b) evidence of cardiac embolism; c) any significant stenosis (>50%) of other extra- and intracranial arteries; d) having undergone interventional and/or surgical procedures of cerebral arteries; e) potential factors affecting haemodynamics, such as an intraÂcranial aneurysm, arteriovenous malformation, brain tumour, or head trauma; and f) missing DSA image or poor image quality.
This study was approved by the Ethical Review Board of Jinling Hospital, and written informed consent was waived due to the retrospective study design.
CLINICAL INFORMATION
Demographics, medical histories, and laboratory data were collected from the database of the Nanjing Stroke Registry Program. Symptoms at onset were recorded in detail, and baseline neurological function deficits were evaluated by the National Institutes of Health Stroke Scale (NIHSS) score and the modified Rankin Scale (mRS) score. The intracranial atherosclerotic stenosis was considered the culprit lesion if the stenosis was ipsilateral to the index ischaemic events and was considered a non-culprit lesion if not.
ANALYSES OF LESION CHARACTERISTICS IN DSA
DSA was performed on a biplane flat-panel angiography system (Artis zee, Siemens Healthineers). The location of lesions and vascular anatomy were determined by DSA results, and degrees of stenosis were measured based on the WASID criteria ([1−diameter of stenotic artery/diameter of proximal normal artery]×100)%17. The morphological characteristics of ICAS lesions were defined according to the Mori lesion classification, which is briefly summarised as follows: type A, short (length ≤5 mm), concentric or moderately eccentric; type B, tubular (5 mm 10 mm) or extremely angulated (>90°)18. The antegrade flow was graded according to the modified Thrombolysis in Cerebral Infarction (mTICI) scale19. If a perfusion defect or delay (mTICI <3) was present, the collateral status was assessed by the American Society of Therapeutic Neuroradiology/Society of Interventional Radiology (ASITN/SIR) collateral flow grading system, and an ASITN/SIR grade 3-4 reflected good collateral compensation20. Cerebral angiograms were also used to assess primary collaterals via the circle of Willis.
ANALYSES OF μQFR AND QUANTITATIVE CEREBRAL ANGIOGRAPHY
Analyses of μQFR were performed by two experienced operators who were blinded to clinical information using a protoÂtype software (AngioPlus Core, Shanghai Pulse Medical Technology), of which detailed computational algorithms have been described previously1621. With the AngioPlus Core software, the Murray law was used in the computation to characterise the flow distribution at the bifurcations, and a step-down reference diameter function was used for QFR computation2122.
For cerebrovascular stenosis lesions, the μQFR was defined as the pressure ratio distal to and proximal to the stenosis in a fully expanded segment without hyperaemic stimulation. An illustrative example is shown in Figure 1. The core steps are summarised as follows. a) The frame with the sharpest lumen contour at the stenotic segment was selected for analysis. b) The lumen contours of the interrogated vessels and their main side branches were automatically delineated by artificial intelligence. c) The step-down reference vessel size was reconstructed according to the Murray fractal law. d) After the structural acquisition, the pressure drop was calculated according to fluid dynamics equations23 based on the empiric mean flow velocities (0.60 m/s of MCA)2425, assuming blood density and viscosity of 1,060 kg/m3 and 0.0035 kg/m·s, respectively. Finally, the μQFR of the interrogated vessel and its branches were available from the software. A lower μQFR indicated more severe flow limitation.
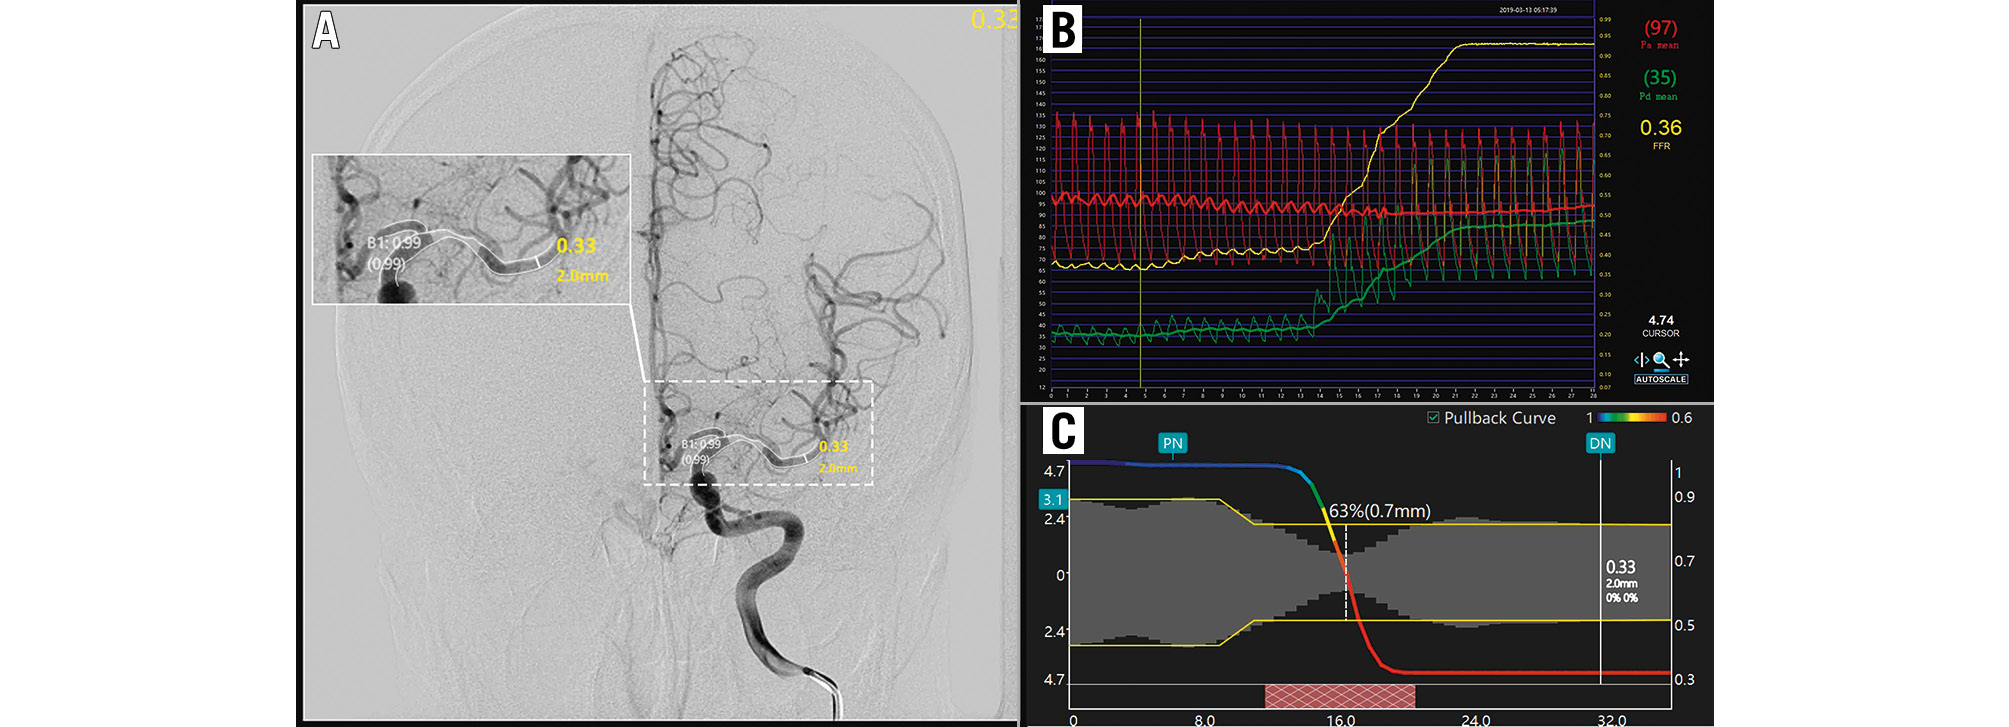
Figure 1. An illustrative example of the computation of μQFR and FFR. A) Moderate stenosis of the left MCA. The contours of the lumen were automatically delineated and overlaid onto the angiography image. The wire-based FFR (Pa/Pd) was 0.36 (B), while the computed μQFR at the lesion was 0.33, corresponding to a remarkable pressure drop in the pullbacks (C).; FFR: fractional flow reserve; MCA: middle cerebral artery; Pa: aortic pressure; Pd: distal coronary pressure; μQFR: Murray law-based quantitative flow ratio
STATISTICAL ANALYSES
Missing data (3.9% for body mass index, 0.8% for white blood cell count, 1.7% for mean platelet volume, 0.8% for neutrophil-lymphocyte ratio, 1.7% for blood glucose, 1.7% for total cholesterol, 2.0% for triacylglycerol, 3.9% for low-density lipoprotein, and 5.9% for high-density lipoprotein) were imputed using the multiple imputation procedure. The Kolmogorov-Smirnov test was used for normality analysis. Data were represented as mean±standard deviation for normally distributed data, median (interquartile range [IQR]) for non-normal data, and the number of cases (percentage) for categorical variables. Comparisons between groups were performed by Student’s t-tests, Mann-Whitney U tests, χ2 tests, and Fisher’s exact tests, as appropriate. A restricted cubic spline model with three knots was used to explore dose-response relations.
Collinearity was assessed using the variance inflation factor (VIF), using a threshold of VIF >10 to identify and remove collinear variables. Variables with p<0.10 on univariate analysis and possible confounding factors were introduced into a multivariate logistic regression analysis with stepwise forward methods. Receiver operating characteristic (ROC) curves were plotted, and the diagnostic accuracy of the models was compared using the areas under the ROC curves (AUC). The incremental benefit of the model based on μQFR was assessed using the continuous net reclassification index (NRI) and integrated discrimination improvement (IDI), of which values above 0 were regarded as significant26. A nomogram was formulated based on the final multivariate model and was internally validated and calibrated using bootstrapping. Model fit was assessed by the Hosmer-Lemeshow goodness-of-fit test.
Subgroup analyses were performed to estimate the interactions between QFR and covariates of interest in predicting symptomatic ICAS. A two-sided p-value<0.05 was considered statistically significant. Statistical analyses were performed using SAS software, version 16.0 (SAS Institute) and R 4.0.3 (R Foundation for Statistical Computing).
Results
CHARACTERISTICS OF PATIENTS
Among 597 patients with potentially eligible isolated MCA stenosis confirmed by DSA, 502 patients were identified as having atherosclerotic stenosis of the MCA, and the QFR analyses were eventually completed in 412 patients. The flowchart of patient inclusion and exclusion is summarised in Supplementary Figure 1. Of the patients included in the final analysis, the median age was 57 years (IQR: 50-64), 270 (68.9%) were male, and 313 (76.0%) patients had culprit lesions in the MCA.
Table 1 shows the clinical characteristics of patients with culprit lesions and non-culprit lesions. Compared with the non-culprit lesion group, patients with culprit lesions were younger (55 years [49-62] vs 62 years [55-67]; p<0.001), included a greater proportion of men (71.9% vs 59.6%; p=0.021), and were more often smokers (45.1% vs 28.3%; p=0.003), but were less likely to have a history of hypertension (58.2% vs 72.7%; p=0.009), diabetes mellitus (24.6% vs 36.4%; p=0.022), or coronary heart disease (3.5% vs 9.1%; p=0.047). Moreover, the culprit lesion group had more severe neurological deficits than the non-culprit lesion group. In terms of laboratory findings, patients with culprit lesions showed a significantly higher neutrophil-lymphocyte ratio but lower mean platelet volume, serum lipid and blood glucose levels than those with non-culprit lesions (all p-values<0.050). There was no significant difference in haematocrit levels between the culprit lesion group and non-culprit lesion group (0.416 [0.385-0.441] vs 0.409 [0.380-0.431]; p=0.323).
Table 1. Clinical characteristics of patients with atherosclerotic middle cerebral artery stenosis.
| Culprit lesions (n=313) | Non-culprit lesions (n=99) | p-value | |
|---|---|---|---|
| Demographics | |||
| Age, years | 55 (49-62) | 62 (55-67) | <0.001 |
| Male | 225 (71.9) | 59 (59.6) | 0.021 |
| SBP, mmHg | 137 (126-150) | 137 (127-150) | 0.797 |
| BMI, kg/m2 | 24.98 (23.12-27.04) | 24.65 (22.58-27.34) | 0.411 |
| Medical history | |||
| Hypertension | 182 (58.2) | 72 (72.7) | 0.009 |
| Diabetes mellitus | 77 (24.6) | 36 (36.4) | 0.022 |
| Coronary heart disease | 11 (3.5) | 9 (9.1) | 0.047 |
| Drinking | 77 (24.6) | 21 (21.2) | 0.490 |
| Smoking | 141 (45.1) | 28 (28.3) | 0.003 |
| Prior stroke/TIA | 49 (15.7) | 15 (15.2) | 0.904 |
| Dyslipidaemia | 232 (74.1) | 78 (78.8) | 0.348 |
| Laboratory findings | |||
| Glu, mmol/L | 5.0 (4.5-5.9) | 5.2 (4.6-6.6) | 0.009 |
| WBC, 109/L | 6.4 (5.4-7.7) | 6.2 (5.3-7.4) | 0.331 |
| NLR | 2.24 (1.73-2.85) | 1.86 (1.41-2.68) | 0.005 |
| MPV, fL | 10.8 (10.1-11.6) | 11.2 (10.3-12.1) | 0.005 |
| TC, mmol/L | 3.60 (3.03-4.30) | 4.15 (3.48-4.75) | <0.001 |
| TG, mmol/L | 1.36 (1.00-1.80) | 1.43 (1.16-1.93) | 0.059 |
| HDL, mmol/L | 0.96 (0.85-1.14) | 0.99 (0.88-1.18) | 0.187 |
| LDL, mmol/L | 2.07 (1.56-2.62) | 2.34 (1.94-3.02) | <0.001 |
| Hct | 0.416 (0.385-0.441) | 0.409 (0.380-0.431) | 0.323 |
| Baseline NIHSS score | 1 (0-4) | 0 (0-2) | 0.002 |
| Baseline mRS score | 1 (1-2) | 1 (1-2) | 0.188 |
| Mori type | 0.723 | ||
| A type | 176 (56.2) | 59 (59.6) | |
| B type | 121 (38.7) | 34 (34.3) | |
| C type | 16 (5.1) | 6 (6.1) | |
| Degree of stenosis, % | 71 (63-78) | 64 (57-73) | <0.001 |
| Complete circle of Willis | 15 (4.8) | 4 (4.0) | 0.971 |
| mTICI score | 0.001 | ||
| <3 | 72 (23.0) | 8 (8.1) | |
| 3 | 241 (77.0) | 91 (91.9) | |
| Good collaterals | 0.011 | ||
| 0-2 | 267 (85.3) | 94 (94.9) | |
| 3-4 | 46 (14.7) | 5 (5.1) | |
| Primary collaterals | 56 (17.9) | 34 (34.3) | 0.001 |
| μQFR | 0.52 (0.33-0.74) | 0.78 (0.58-0.87) | <0.001 |
| Data are presented as median (IQR) or n (%). Values in bold indicate statistical significance. BMI: body mass index; Glu: glucose; Hct: haematocrit; HDL: high-density lipoprotein; IQR: interquartile range; LDL: low-density lipoprotein; MPV: mean platelet volume; mRS: modified Rankin Scale; mTICI: modified Thrombolysis in Cerebral Infarction; NIHSS: National Institute of Health Stroke Scale; NLR: neutrophil-lymphocyte ratio; SBP: systolic blood pressure; TC: total cholesterol; TG: triacylglycerol; TIA: transient ischaemic attacks; μQFR: Murray law-based quantitative flow ratio; WBC: white blood cell count | |||
MORPHOLOGICAL AND HAEMODYNAMIC CHARACTERISTICS OF MCA LESIONS
The culprit lesions presented more severe luminal stenosis (71% vs 64%; p<0.001) and perfusion defects (p=0.001) than non-culprit lesions, despite similar Mori types (p=0.723). Meanwhile, the culprit lesion group had significantly fewer primary collaterals (17.9% vs 34.3%; p=0.001) and more leptomeningeal collateralisation (14.7% vs 5.1%; p=0.011) compared with the non-culprit lesion group.
After the QFR analyses, the culprit lesions had significantly lower values of μQFR (0.52 [0.33-0.74] vs 0.78 [0.58-0.87]; p<0.001) than the non-culprit lesions. The distribution of μQFR values is illustrated in Figure 2, and the non-linear relationship between μQFR and the risk of symptomatic lesions is not indicated (p for non-linear relation=0.672) (Figure 2).
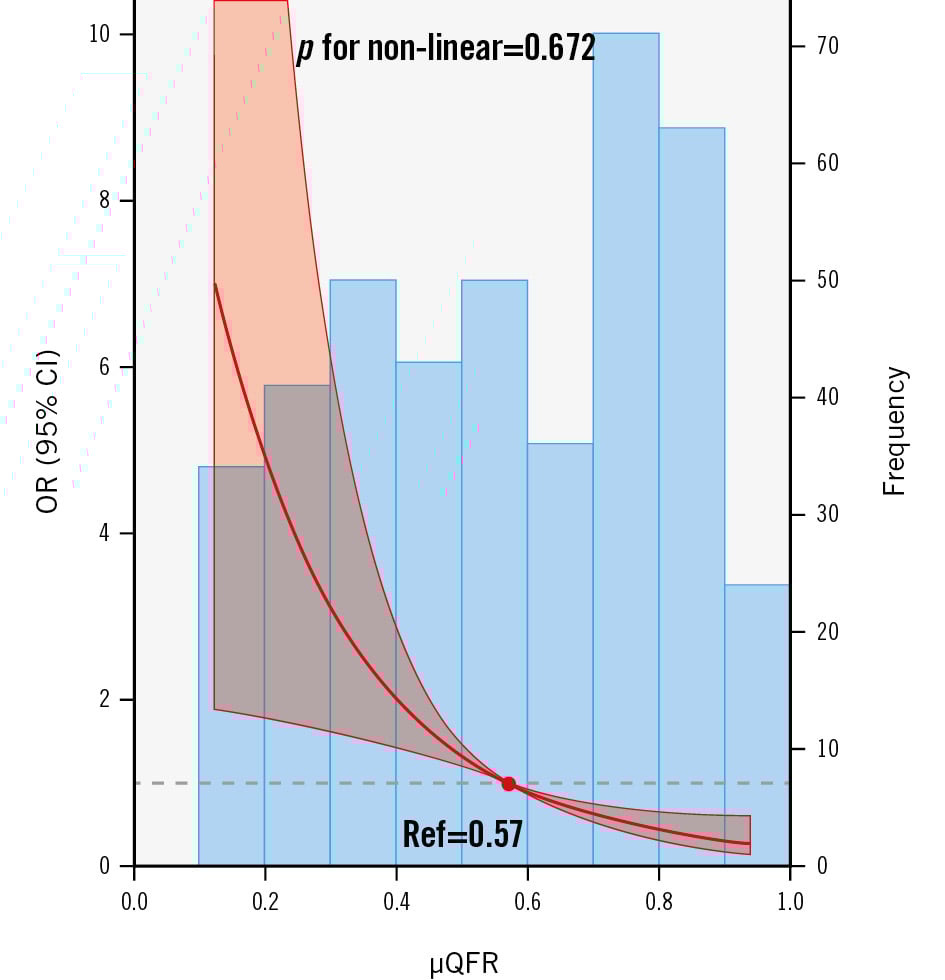
Figure 2. Frequency distribution for μQFR values and the relation between μQFR values and clinical symptoms. The bar graph shows the frequency of μQFR values. The restricted cubic splines show the association between μQFR values and clinical symptoms. A non-linear relationship was not indicated between μQFR values and clinical symptoms (p for non-linear relation=0.672), fitted by restricted cubic splines. The red line and semi-transparent red areas represent the OR and 95% CI, respectively. The grey dashed line represents the null effect (OR=1), and the red dot represents the reference value (μQFR=0.57, OR=1). CI: confidence interval; OR: odds ratio; Ref: reference; μQFR: Murray law-based quantitative flow ratio
MODELS OF DISCRIMINATING CULPRIT LESIONS
In univariate analyses, μQFR outperformed the degree of stenosis in discriminating culprit lesions (AUC [95% confidence interval {CI}]: 0.726 [0.681-0.769] vs 0.631 [0.582-0.677]; p for the DeLong test=0.001) (Table 2, Central illustration A). The sensitivity, specificity, positive likelihood ratio, and negative likelihood ratio for μQFR ≤0.51 to identify culprit lesions were 49.8% (95% CI: 44.2-67.4), 84.9% (95% CI: 76.2-91.3), 3.29 (95% CI: 2.04-5.31), and 0.59 (95% CI: 0.51-0.68), respectively (Table 2).
As shown in Supplementary Table 1, we developed two models to identify the culprit lesions using multivariate logistic regression analyses. Model 1 contained conventional clinical risk factors without the haemodynamic factors, and Model 2 contained the covariates in Model 1 and μQFR but did not include the degree of stenosis. Model 2 showed a better ability for discriminating symptomatic plaques than Model 1 (AUC [95% CI]: 0.850 [0.812-0.883] vs 0.827 [0.787-0.863]; p for the DeLong test=0.034) (Central illustration B). Compared with Model 1, Model 2 showed a substantial improvement in risk reclassification with positive NRI (0.620, 95% CI: 0.408-0.832; p<0.001) and IDI (0.057, 95% CI: 0.032-0.082; p<0.001) indices. In other terms, the addition of μQFR yielded a significant improvement in predicting symptomatic plaques.
The final nomogram based on Model 2 is presented in Figure 3 and shows good calibration (p for the Hosmer-Lemeshow test=0.102) and discrimination (C-statistic 0.850, 95% CI: 0.812-0.883). In addition, the calibration plot (Supplementary Figure 2) shows good calibration between the prediction and actual observation of clinical symptoms; the mean absolute error was 0.025.
Table 2. Diagnostic performance of μQFR and degree of stenosis for discriminating culprit lesions
| μQFR | Degree of stenosis | |
|---|---|---|
| Cutoff value | 0.51 | 65.71% |
| AUC (95% CI) | 0.726 (0.681-0.769) | 0.631 (0.582-0.677) |
| DeLong test p-value | 0.001 | - |
| Sensitivity(95% CI) | 49.8 (44.2-55.5) | 67.4 (61.9-72.6) |
| Specificity(95% CI) | 84.9 (76.2-91.3) | 55.6 (45.2-65.5) |
| +LR (95% CI) | 3.29 (2.04-5.31) | 1.52 (1.20-1.92) |
| −LR (95% CI) | 0.59 (0.51-0.68) | 0.59 (0.46-0.74) |
| AUC: area under the curve; CI: confidence interval; +LR: positive likelihood ratio; −LR: negative likelihood ratio; μQFR: Murray law-based quantitative flow ratio | ||
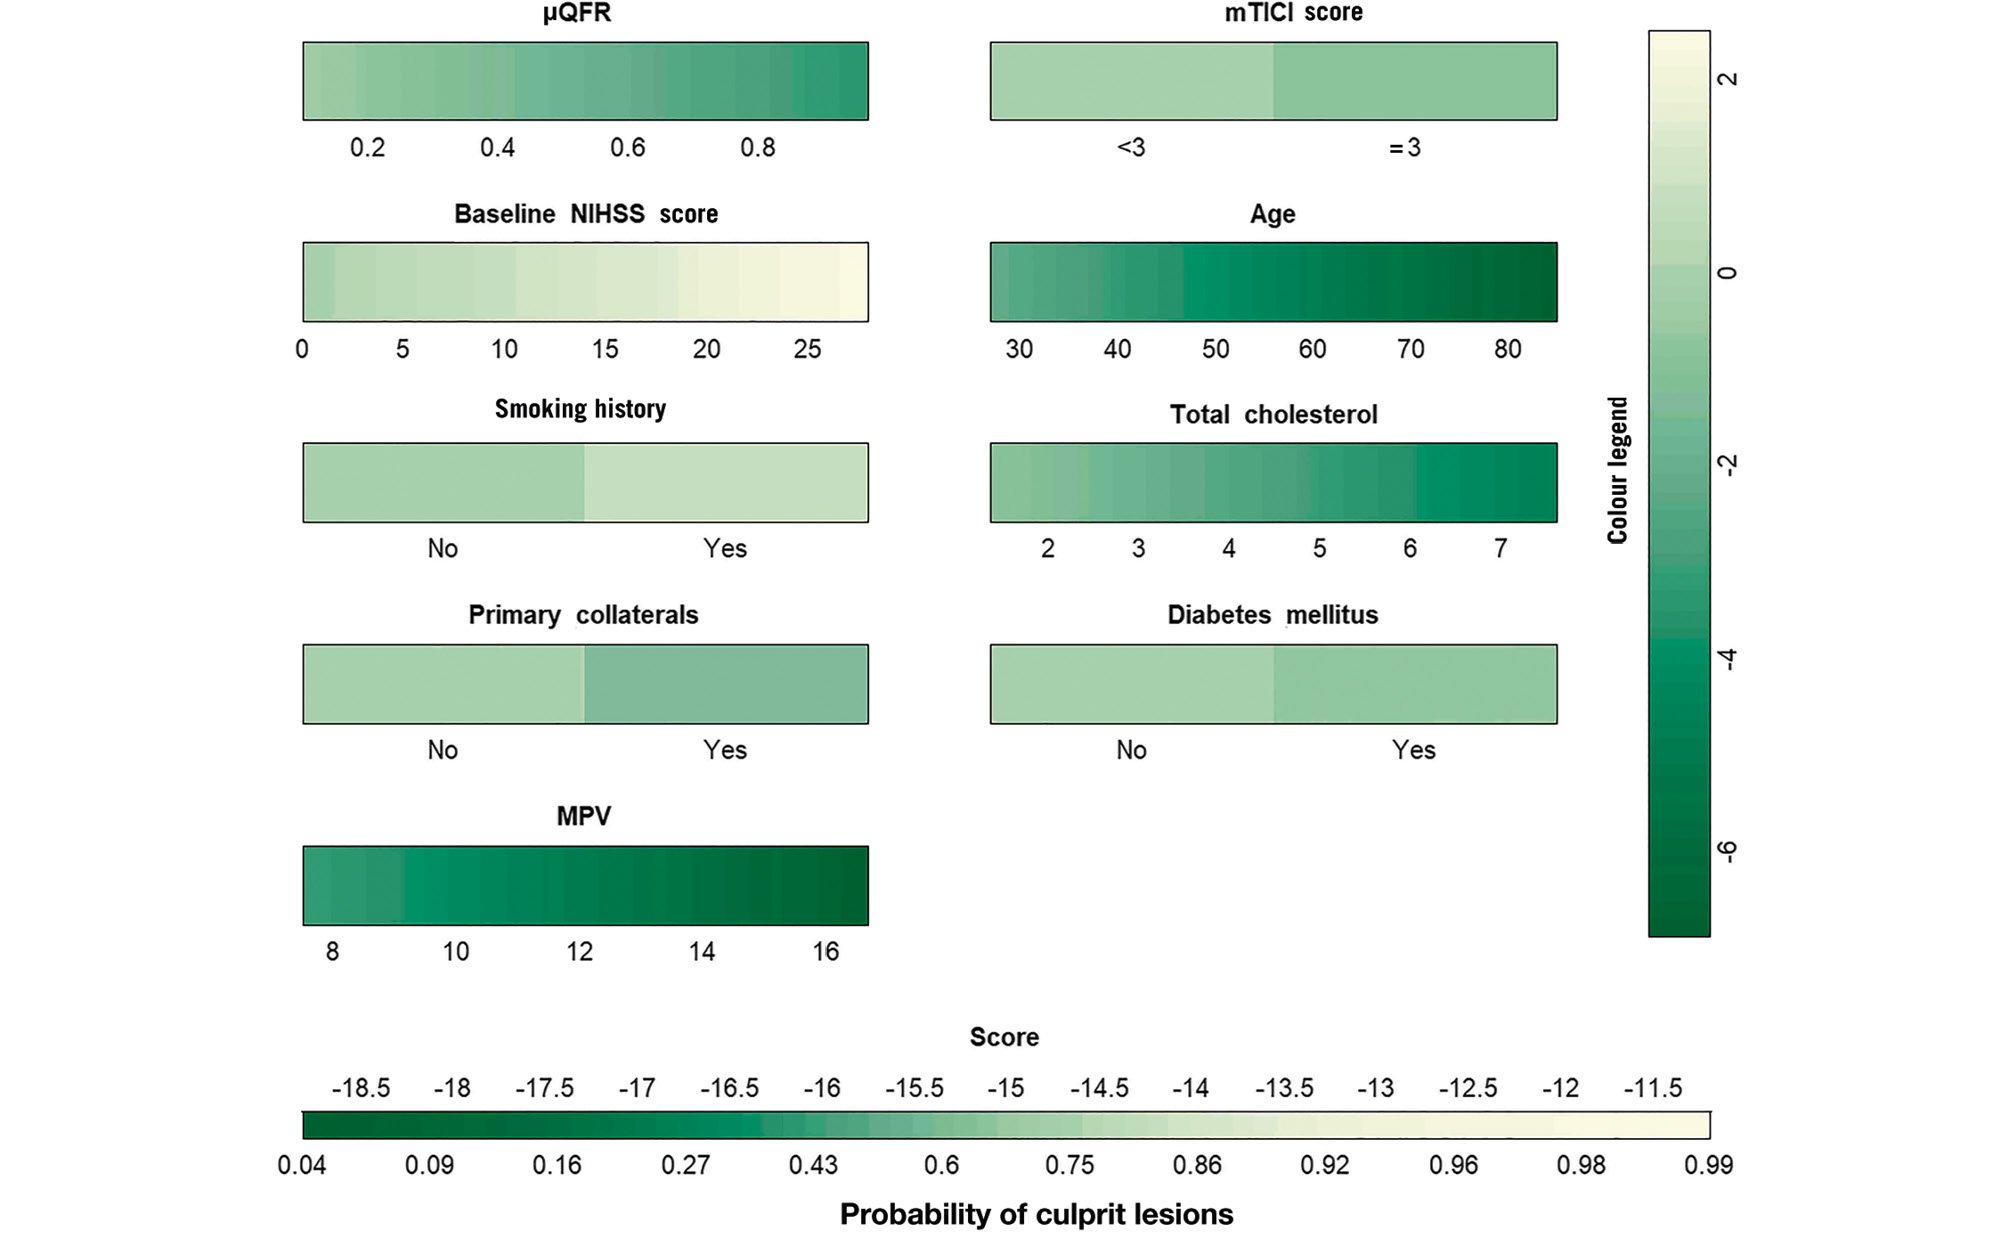
Figure 3. The final nomogram for identifying culprit lesions in ICAS patients. Points were assigned for μQFR, mTICI score, baseline NIHSS score, age, smoking history, diabetes mellitus, primary collaterals, total cholesterol level, and mean platelet volume. Then, the scores for each variable were summed up to get the total score and determine the symptomatic lesion probabilities of patients. ICAS: intracranial atherosclerotic stenosis; MPV: mean platelet volume; mTICI: modified Thrombolysis in Cerebral Infarction; NIHSS: National Institute of Health Stroke Scale; μQFR: Murray law-based quantitative flow ratio
SUBGROUP ANALYSES
Subgroup analyses were performed to evaluate the differential discriminating ability of μQFR for culprit lesions. As shown in Figure 4, there was no significant interaction between μQFR and age, smoking history, the degree of ICAS stenosis, or primary collaterals in discriminating culprit lesions. However, the discriminating performance of μQFR was different in patients with mTICI scores <3 (odds ratio [OR] 0.083, 95% CI: 0.004-1.710; p for interaction=0.465) and good collateral (OR 0.903, 95% CI: 0.020-31.524; p for interaction=0.058), although the interactions failed to reach significance.
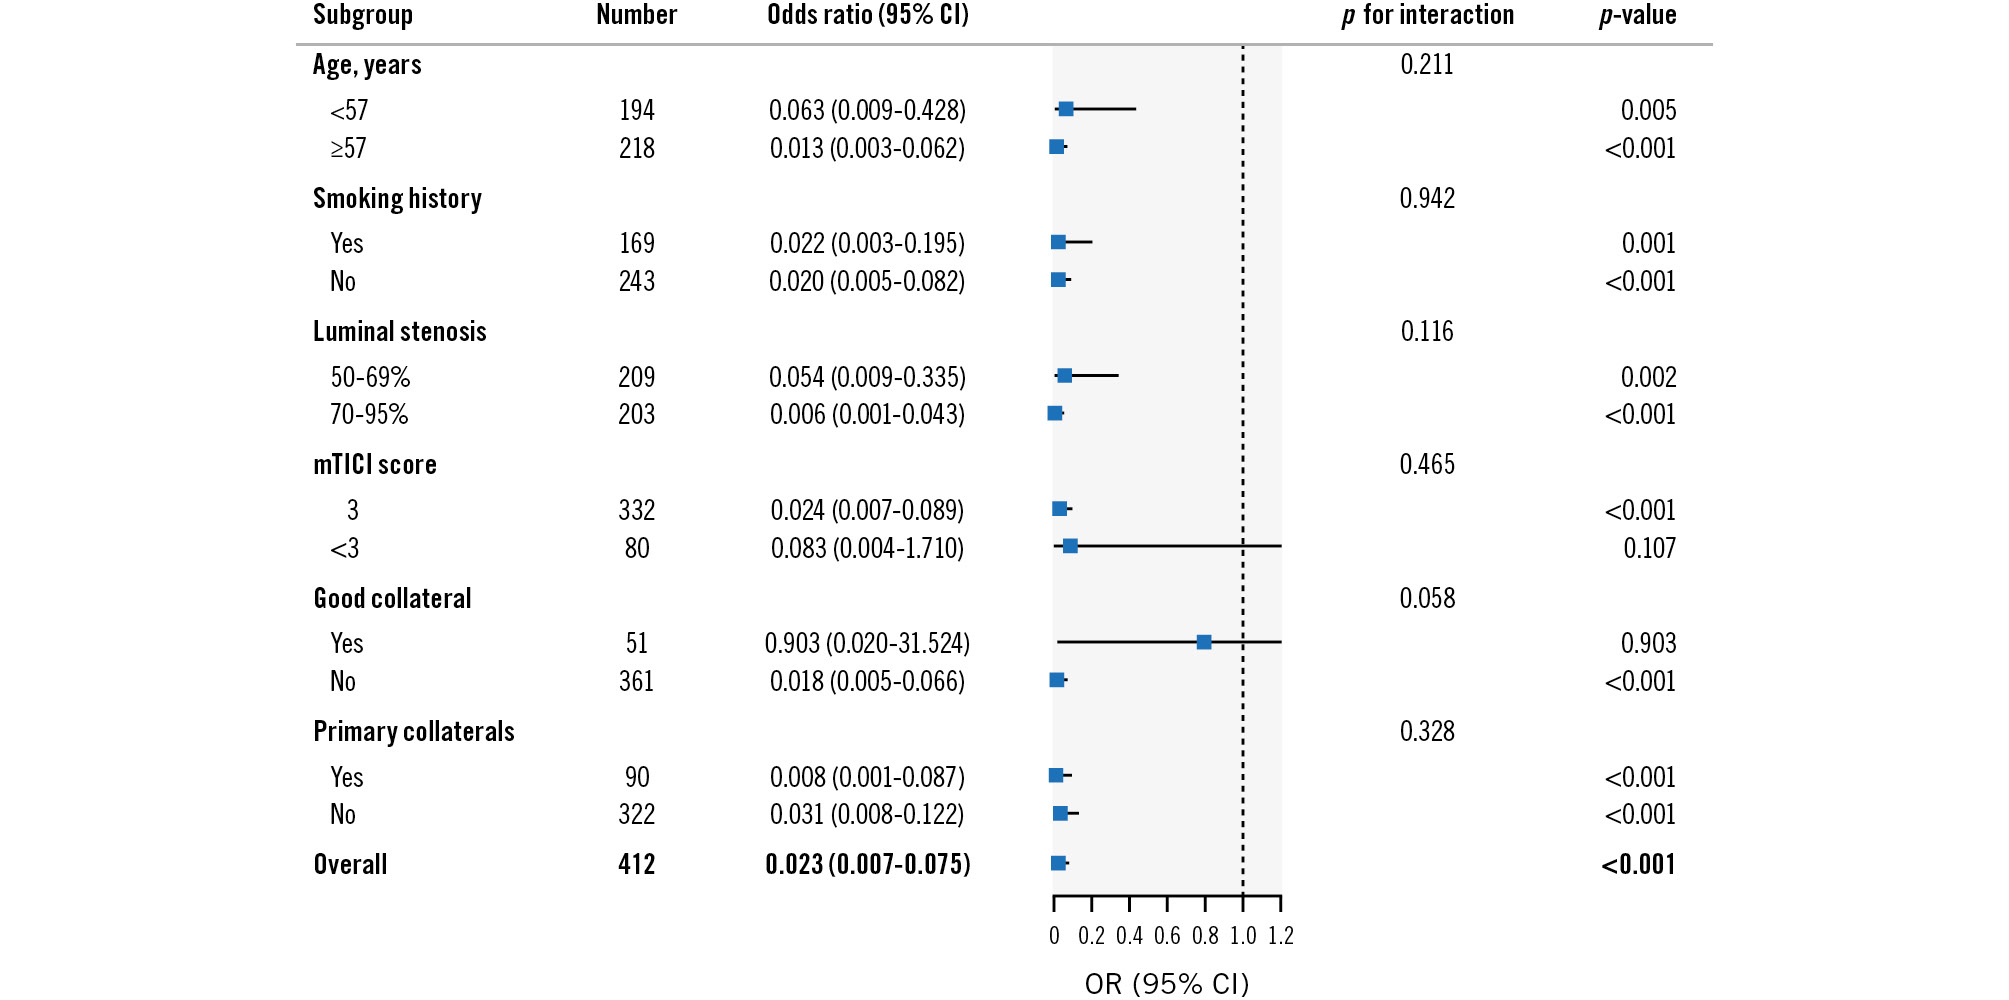
Figure 4. Subgroup analyses of μQFR for identifying culprit lesions in ICAS patients. CI: confidence interval; ICAS: intracranial atherosclerotic stenosis; mTICI: modified Thrombolysis in Cerebral Infarction; OR: odds ratio; μQFR: Murray law-based quantitative flow ratio
Discussion
In this study, we found that low values of μQFR were significantly associated with clinical symptoms, especially in patients without macroscopic perfusion defects or good collateral. The μQFR had a better discrimination ability for culprit lesions compared to the degree of stenosis. The risk prediction model combining conventional clinical factors with μQFR outperformed the model based solely on traditional parameters for stroke risk stratification in ICAS. Hence, the final nomogram may constitute a useful tool for risk stratification in ICAS patients.
Identifying the characteristics of symptomatic ICAS may facilitate the recognition of patient subsets with a high stroke risk. The haemodynamic assessment of ICAS has gradually been attracting more and more attention67. Previous studies usually performed CFD simulations based on CTA/MRA to obtain quantified haemodynamic metrics of ICAS, such as FFR and wall shear stress ratio (WSSR) [9,10.] The SOpHIA (Stroke Risk and Hemodynamics in Intracranial Atherosclerotic Disease) study indicated that both a low translesional pressure ratio and a high WSSR of symptomatic ICAS were associated with 1-year stroke relapse9. However, CFD simulation can be time-consuming and requires expensive computing facilities, which hampers its universal clinical application11.
QFR is an alternative approach to estimate FFR without a pressure wire, an approach which could nonetheless indicate the haemodynamic significance of stenosis lesions and guide therapeutic decisions in coronary stenosis121415. The short analysis period and good reproducibility of μQFR, empowered by the artificial intelligence (AI) algorithm, greatly enhance the potential of immediate haemodynamic evaluation in the catheterisation laboratory1621. The previous study showed μQFR achieved comparable results to wire-based FFR in cerebral arterial stenosis16 and was independently associated with changes in perfusion detected by a CT perfusion scan27.
Encouragingly, in our study, μQFR showed superiority over the degree of stenosis in identifying culprit lesions, which further supports the clinical utility of μQFR. The overall diagnostic performance of μQFR for culprit lesions was good, but its positive and negative likelihood ratios were not optimal. It was observed that the cutoff value of μQFR identified in this study was significantly lower than that in the coronary artery, which might account for its low sensitivity and suboptimal likelihood ratio. The underlying mechanism behind the lower threshold could result from collateral flow compensation.
Our study found that apparent retrograde collateral flow weakens the correlation between μQFR and ischaemic symptoms of ICAS patients. It is intelligible that good collateral circulation can mitigate or even reverse hypoÂperfusion induced by ICAS, resulting in ipsilateral haemodynamic changes. Lan Linfang et al found that cerebral perfusion in patients with moderate MCA stenosis was more dependent on anterograde residual flow, while in patients with severe MCA stenosis, it was more dependent on collateral flow28. Therefore, for patients without good collateral status, a more precise discrimination of the haemodynamic significance of stenoses using QFR can provide more refined stroke risk stratification. Further studies are needed to explore the relationship between local haemodynamic changes and cerebral blood flow distribution patterns, and to further unravel the mechanisms of ischaemic stroke in ICAS patients.
To provide a convenient tool for clinical practice, we constructed a nomogram based on multivariate logistic regression analysis. Notably, the final model included several conventional risk factors and μQFR, instead of luminal stenosis. Growing evidence indicates that luminal stenosis may not be the sole indicator for ICAS lesion severity529. More comprehensive assessments, such as haemodynamic assessment, are also essential to scale the severity of ICAS. Therefore, the final nomogram performed better than the conventional model for identifying symptomatic plaques, and it may serve as a reliable tool for risk stratification of ICAS, facilitating individualised treatment strategies.
Notably, patients with culprit lesions in this group were younger, had less diabetes mellitus, and lower levels of total cholesterol. It is well known that traditional vascular risk factors such as advanced age, hypercholesterolaemia, and diabetes are associated with a higher incidence and burden of atherosclerosis1. However, to minimise blood flow interference caused by other lesions, our stringent eligibility criteria screened patients with moderate to severe stenosis of the unilateral MCA M1 segment, but not multiple vascular lesions. We speculate that in populations with similar isolated plaques, elderly patients have more time to develop compensation or tolerance. Patients with comorbidities, such as hypertension and diabetes, have usually undergone prior pharmacological
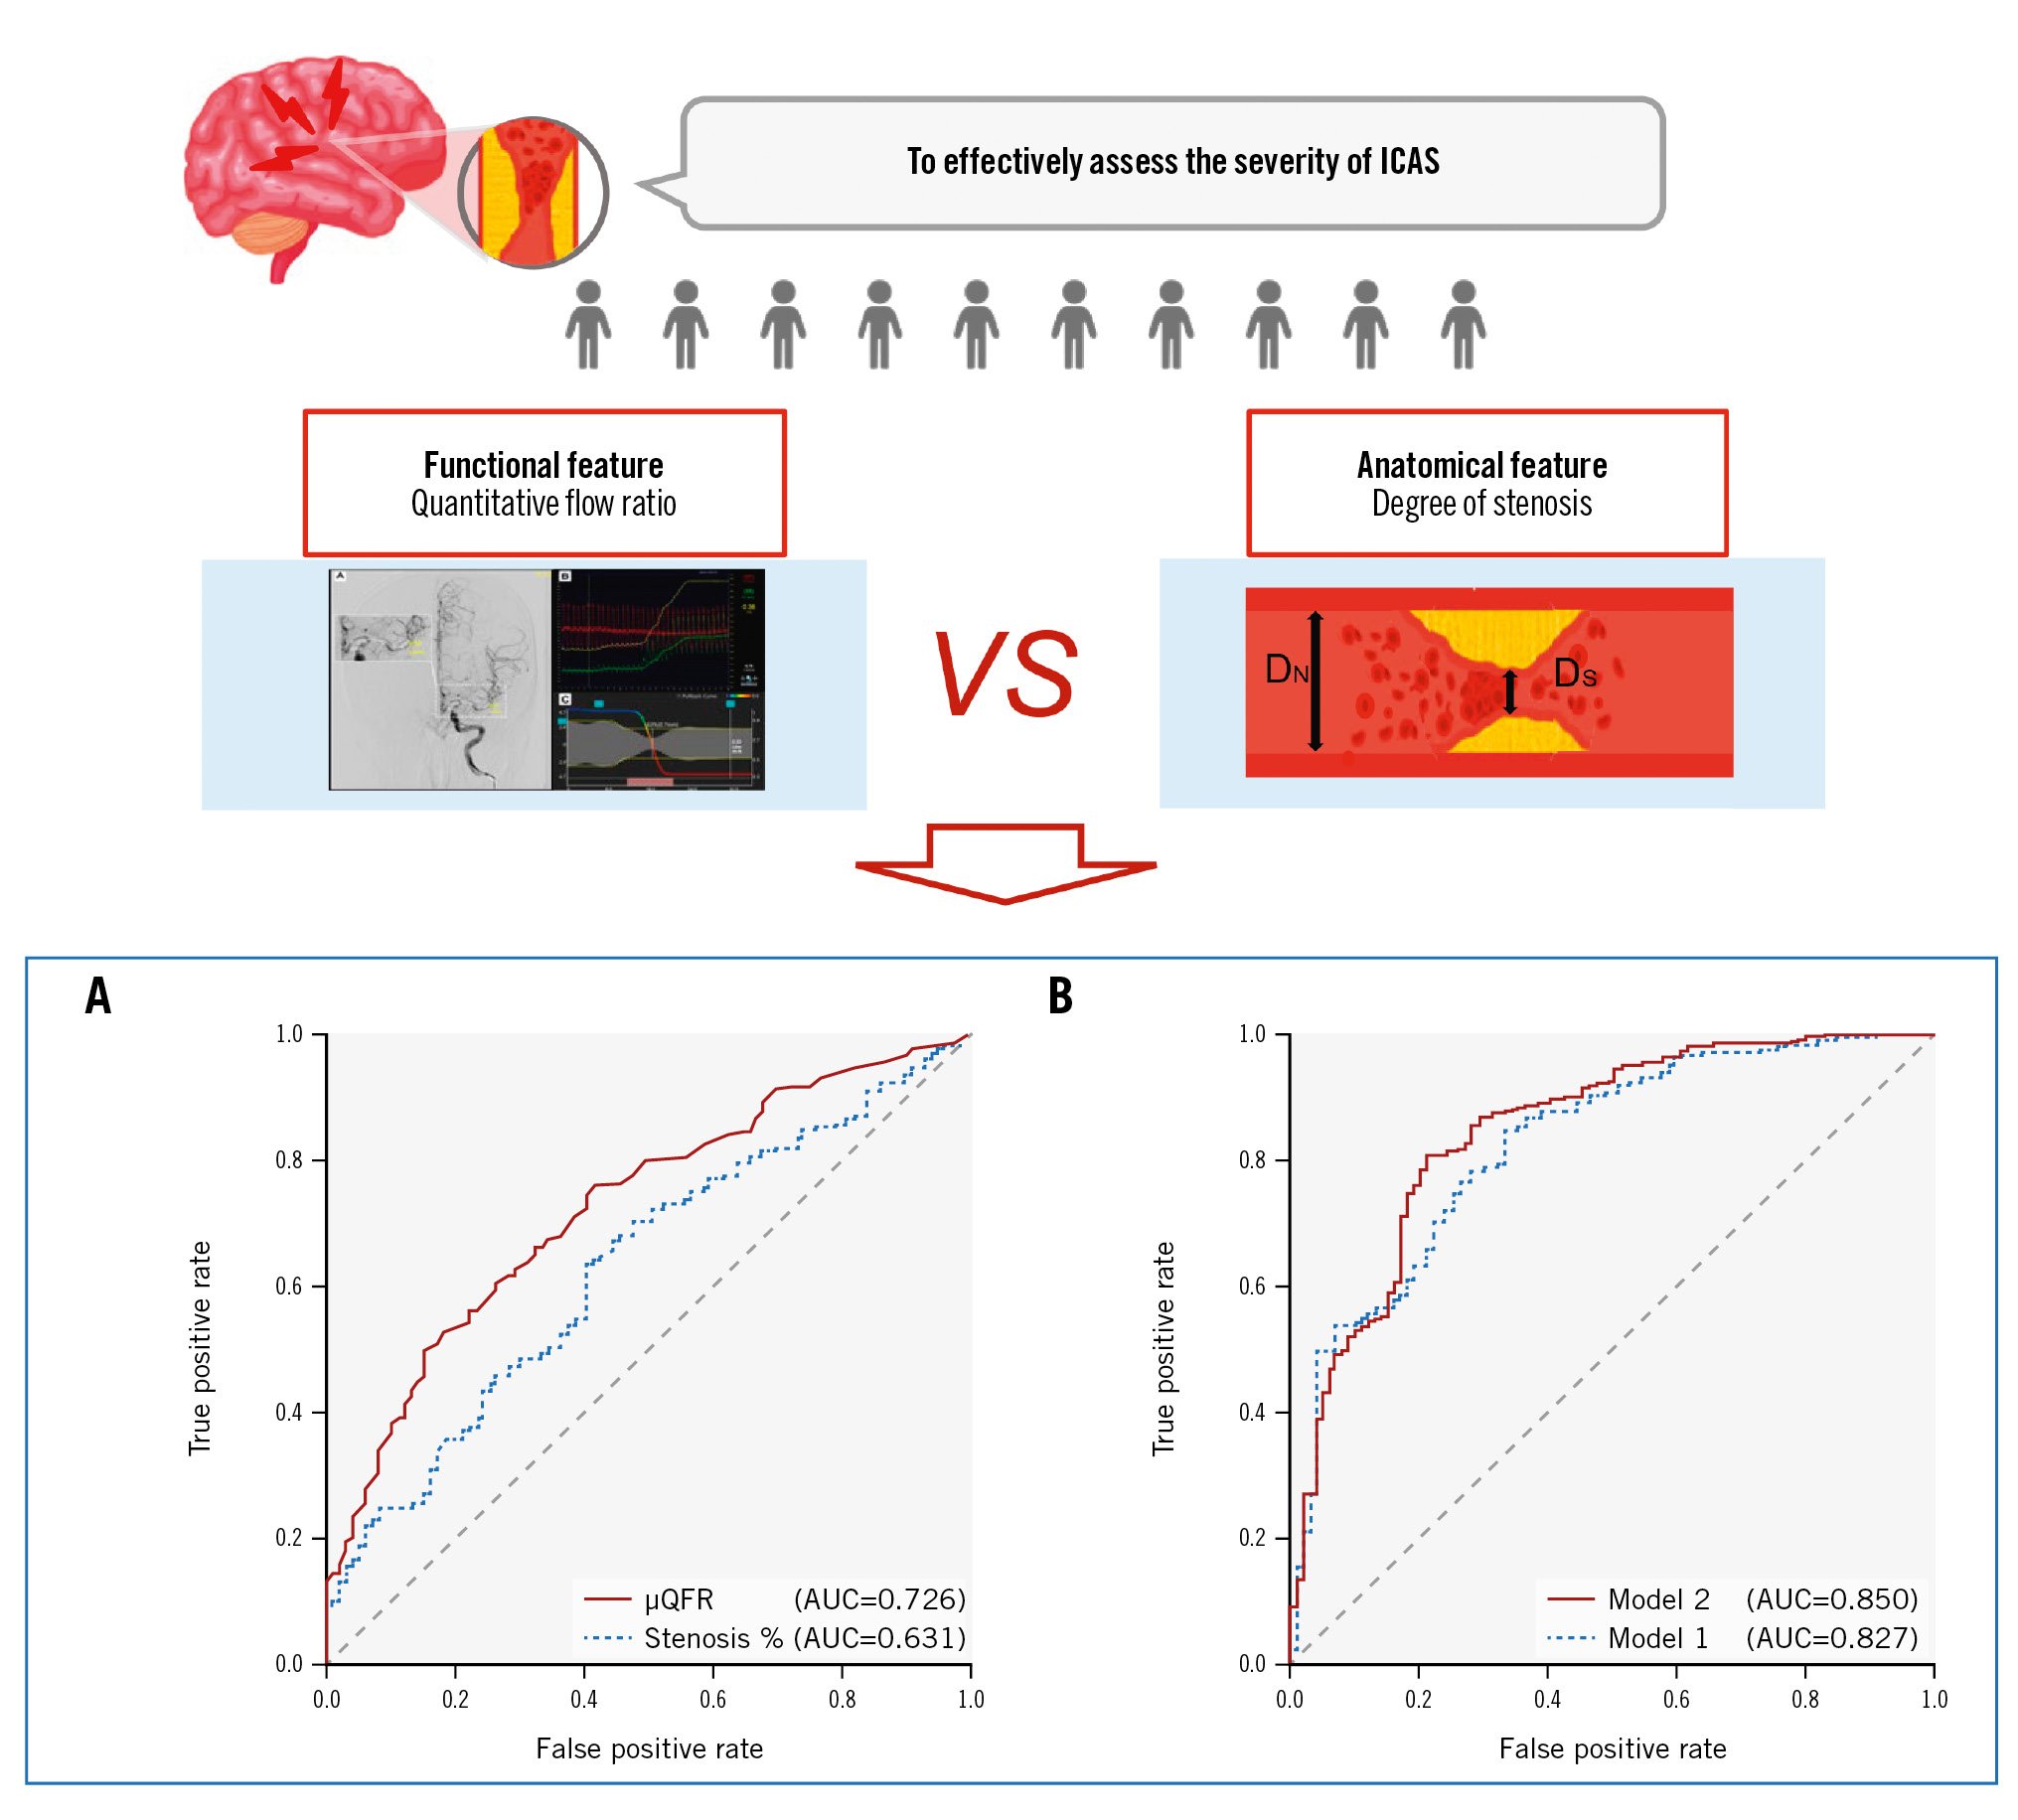
Central illustration. Comparison of the diagnostic performance of different models for culprit lesions in ICAS patients. A) The ROC curves of μQFR and the degree of stenosis; B) the ROC curves of Model 1 and Model 2. AUC: area under the ROC curve; DN: diameter of proximal normal artery; DS: diameter of stenotic artery; ICAS: intracranial atherosclerotic stenosis; ROC: receiver operating characteristics; μQFR: Murray law-based quantitative flow ratio
treatment and health education, which also serve as preventive interventions for stroke. Moreover, non-traditional risk factors, such as poor diet quality, ambient air and noise pollution, sleep deprivation, and psychosocial stress, may also play an important role in the formation and development of plaques30. In future prospective studies, we hope to collect data concerning the genetic and lifestyle characteristics of ICAS patients in order to provide a more meaningful interpretation of the results.
Limitations
The study was subject to the following limitations. Firstly, stringent screening criteria and the single-centre nature of our study resulted in a relatively homogeneous population, which limits the extrapolation of our results and conclusions. Multicentre prospective studies including a broader population are required to verify our findings. Secondly, we enrolled only patients whose ICAS was subsequently confirmed by DSA, so there may be some selection bias. Furthermore, as QFR is an angiography-based method, the accuracy or infeasibility of QFR depends on the quality of images and optimal projection. Further validation and technical improvements are required in future studies.
Conclusions
This study utilised the novel angiography-based QFR anaÂlysis to evaluate the haemodynamic significance of ICAS lesions. The μQFR outperformed the degree of stenosis in identifying culprit lesions and was significantly associated with clinical symptoms, especially in patients without sufficient collateral. The final nomogram showed that conventional clinical factors in combination with μQFR may effectively discriminate symptomatic lesions. It may constitute a useful tool for risk stratification in ICAS patients and for developing individualised treatment strategies in secondary stroke prevention.
Impact on daily practice
Lower values of the Murray law-based quantitative flow ratio (μQFR) were significantly associated with ischaemic symptoms in intracranial atherosclerotic stenosis (ICAS) patients. The μQFR is a more effective indicator of functional changes than the degree of stenosis of ICAS lesions. A final nomogram, integrating conventional risk factors and μQFR, could serve as a useful tool for risk stratification in ICAS patients.
Acknowledgements
The authors gratefully acknowledge all the participating patients and the clinical staff of Jinling Hospital, who contributed to patient recruitment and data collection.
Funding
This study was funded by the National Natural Science Foundation of China (U22A20341, U20A20357, and 81870946), Fundamental Research Funds for the Central Universities (WK9110000056), Jiangsu Provincial Key Research and Development Program (BE2020700, BE2020697), and Jiangsu Funding Program for Excellent Postdoctoral Talent (2022ZB752).
Conflict of interest statement
S. Tu received research grants from Pulse Medical Imaging Technology. The other authors have no conflicts of interest to declare.
Supplementary data
To read the full content of this article, please download the PDF.