Abstract
Background: Quantitative flow ratio (QFR) is a tool for physiological lesion assessment based on invasive coronary angiography.
Aims: We aimed to assess the reproducibility of QFR computed from the same angiograms as assessed by multiple observers from different, international sites.
Methods: We included 50 patients previously enrolled in dedicated QFR studies. QFR was computed twice, one month apart by five blinded observers. The main analysis was the coefficient of variation (CV) as a measure of intra- and inter-observer reproducibility. Key secondary analysis was the identification of clinical and procedural characteristics predicting reproducibility.
Results: The intra-observer CV ranged from 2.3% (1.5-2.8) to 10.2% (6.6-12.0) among the observers. The inter-observer CV was 9.4% (8.0-10.5). The QFR observer, low angiographic quality, and low fractional flow reserve (FFR) were independent predictors of a large absolute difference between repeated QFR measurements defined as a difference larger than the median difference (>0.03).
Conclusions: The inter- and intra-observer reproducibility for QFR computed from the same angiograms ranged from high to poor among multiple observers from different sites with an average agreement of 0.01±0.08 for repeated measurements. The reproducibility was dependent on the observer, angiographic quality and the coronary artery stenosis severity as assessed by FFR.
Introduction
Quantitative flow ratio (QFR) is a method for computation of fractional flow reserve (FFR) based on invasive coronary angiography1. QFR has documented high diagnostic accuracy in off-line and in-procedure settings, with FFR as reference standard234.
The optimal procedure for computation of QFR requires multiple steps, such as correct angiographic frame selection, vessel lumen contouring, choice of reference vessel diameter function, and contrast flow evaluation, that all include user interaction. Small variations introduced by observers in each of these steps may potentially multiply and affect the inter- and intra-observer reproducibility of QFR.
Previous studies on the reproducibility of QFR are sparse and altogether solely investigating inter- or intra-observer agreement56.
We aimed to: 1) assess inter- and intra-observer reproducibility between multiple observers at different sites, and 2) identify predictors of impaired reproducibility.
Methods
Design
The study was an investigator-initiated retrospective, observational multicentre study. Five sites in the Netherlands, China, Poland, Italy and Spain with previous but heterogeneous QFR experience performed QFR analysis twice using the same angiographic projections from 50 patients previously enrolled in the Diagnostic Performance of In-Procedure Angiography-Derived Quantitative Flow Ratio Compared to Pressure-Derived Fractional Flow Reserve: FAVOR II Europe-Japan (FAVOR II E-J)7 or the Feasibility and Diagnostic Precision of In-procedure Computed Fractional Flow Reserve: Wire-free Invasive Functional Imaging (WIFI I) studies (Andersen BK et al. Presented at CRT 2017, Washington, DC, USA, February 2017) (Central illustration).
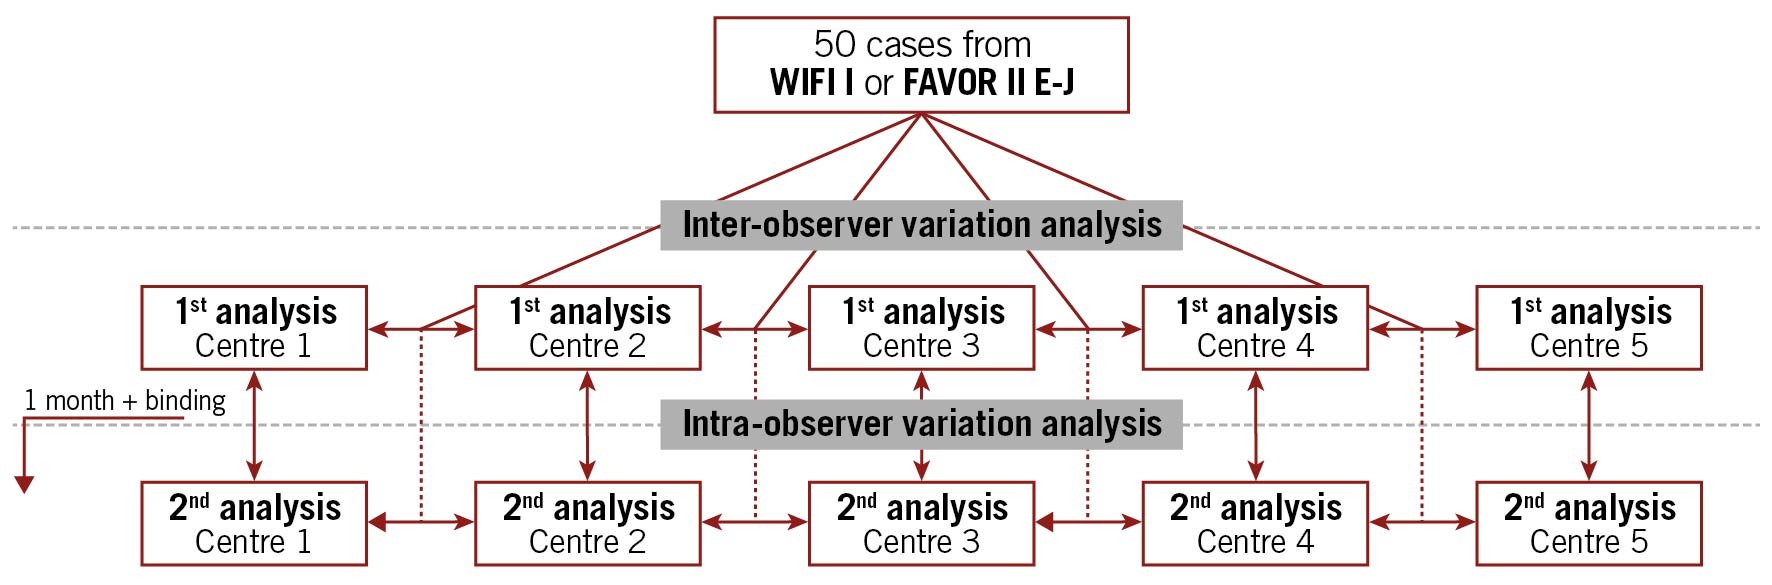
Central illustration. Study overview.
Cases and observer selection
Observers participating in the FAVOR II E-J study were asked to participate as observers in QREP. The cases were randomly selected by an experienced QFR user not performing analysis in QREP (J. Westra) using software for random selection. Cases were selected on the basis that the QFR analysis in the initial study (FAVOR II E-J) had not been performed by a QREP observer. The remaining inclusion criteria were: 40% of FFR values ≤0.80; and an intended distribution of lesion location 2:1:1 for left anterior descending: right coronary: left circumflex arteries (LAD: RCA: LCx). Cases were excluded if fulfilling the following objective exclusion criteria from FAVOR II E-J and WIFI-I (missed by observer in the original studies): bifurcation with stepdown in reference (>1 mm) and aorto-ostial lesions. No further restrictions were applied (e.g., cases were not excluded in case of suboptimal angiographic quality). The FFR data underwent pressure wave-form analysis for identification of artefacts as part of the original study protocols.
Angiographic quality scoring
An experienced QFR observer not involved in the reproducibility analysis (M. Sejr-Hansen) received the two angiographic runs for each case and scored the quality of the included angiograms from 1-5; with 1 being angiographic quality which could cause major analysis issues in at least two steps of the QFR analysis, or major issues in one step and minor issues in at least three steps, or minor issues in >4 steps; and 5 being angiographic quality not likely to cause issues in any steps of the QFR analysis. Further description on the scoring is reported in Supplementary Table 1 with examples in Supplementary Figure 1.
QFR computation and blinding
The Medis Suite QAngio XA-3D/QFR solution (Medis Medical Imaging Systems BV) was used for computation of QFR. Analysis had to be performed as described in detail in a step-by-step standard operating procedure7. In short, QFR analysis included the following user-interactive steps (Figure 1): 1) selection of end-diastolic frames from two angiographic views at least 25° apart; 2) selection of anatomical landmarks in both images to correct for image distortion and patient movement; 3) review of the automated lumen edge detection, including manual correction of contours if indicated; 4) selection of one out of three algorithms for the reference vessel function (i: automated [default]; ii: manual selection of healthy vessel segments [“normals”]; iii: manual selection of a fixed proximal reference size); 5) derivation of contrast flow velocity (m/s) by Thrombolysis In Myocardial Infarction (TIMI) frame counting in the target vessel. All observers were asked to report previous QFR experience (estimated number of QFR analyses performed) before the initiation of QREP.
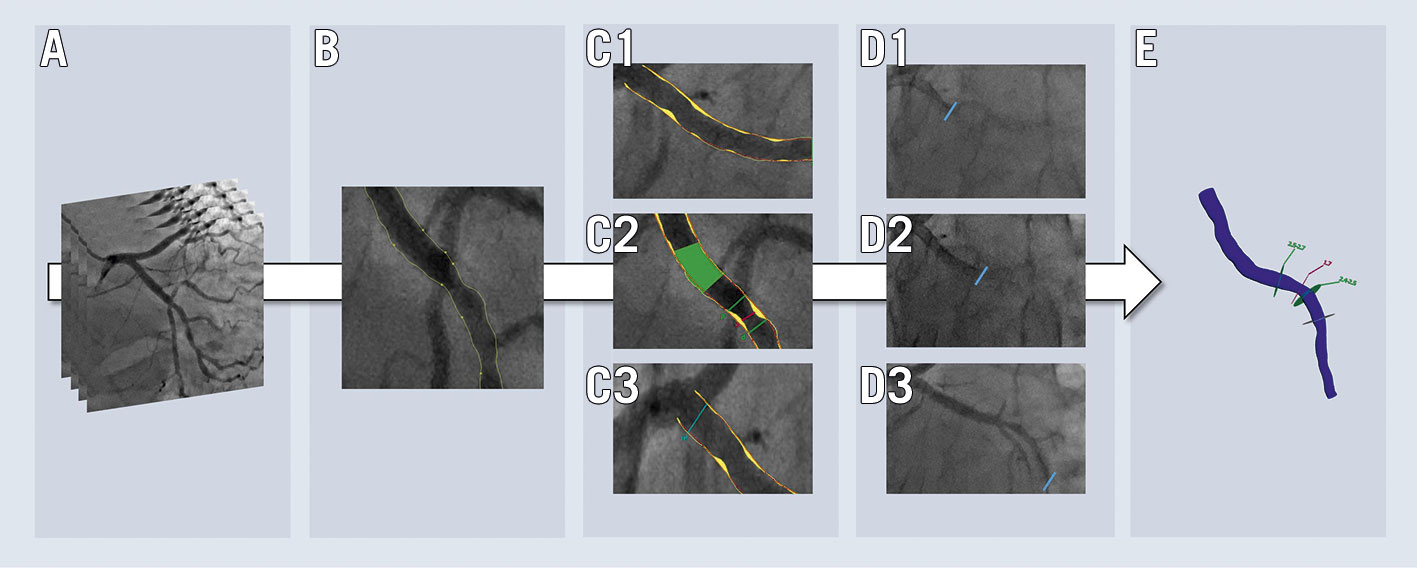
Figure 1. Simplified illustration of user-dependent steps in QFR computation. The work flow includes: selection of two end-diastolic frames required for geometrical reconstruction (A); potential adjustment of the contour detection with correction points (B); selection of an automated (C1), normal segment-based (C2) or fixed proximal reference size (C3) function; performing corrected time-frame count analysis (D1-D3) for flow estimation; and final QFR (E).
First QFR computation
Each user received a login to an online database (Trialpartner, created by J. Hjort, Institute of Clinical Medicine, Aarhus University, Aarhus, Denmark) to find 50 cases containing three angiographic runs, two intended for the creation of the three-dimensional reconstruction and one indicating the pressure-wire position. If the pressure-wire position was not recorded, the position indicating where to end the reconstruction was provided.
Second QFR computation
The database for the second analysis was made available on a per centre basis one month after completing the final case for the first round of analyses (Central illustration). For the second analysis, the database contained the same anonymised patients as the first analysis, but now with different pseudo IDs and different DICOM tags ensuring that the initial QFR analysis file could not be opened using the angiographic runs from the second batch. The user was the same as during the first repeated analysis.
All QFR-analysis files were reviewed, and a blinded observer not involved in the QFR analysis (M. Sejr-Hansen), systematically scored the first and second analysis quality from 1-5 according to deviations from the QFR standard operating procedure (SOP). A score of 1 indicated analysis with major issues in at least two steps, or major issues in 1 step and minor issues in at least 3 steps, or minor issues in >4 steps, up to a score of 5 which indicated analysis without issues in any step. Major issues were defined as issues where appropriate correction would have resulted in a difference in QFR of more than 0.03 which was set as an arbitrary cut-off.
Analysis strategy
The main analysis was the coefficient of variation (CV) for repeated QFR computation. Secondary analysis included: 1) the standard deviation for repeated QFR measurements within users; 2) binary diagnostic classification agreement between users; 3) binary diagnostic classification agreement within users; 4) correlation and agreement with FFR; and 5) predictors of large intra-observer variability, defined as an absolute difference larger than the average median absolute difference for repeated measurements within users. The diagnostic cut-off for QFR was set to QFR ≤0.80.
Statistics
Distribution of individual variables was checked with Q-Q plots. Distribution plots, scatter plots, and Bland-Altman plots including 95% limits of agreement, were used to illustrate and assess the within- and between-user variation for repeated QFR analysis and the agreement with FFR. The within-subject mean QFR and standard deviation (SD) were calculated to derive the within-subject CV using the root mean square approach, with 95% confidence intervals (CI) derived using bootstrapping. Multilevel mixed-effects logistic regression analysis was performed to identify predictors of increased intra-observer variability. The multivariate model included factors (observer, angiographic quality, clinical and procedural characteristics as listed in Table 1 and Table 2) with a p-value of <0.10 in univariate analysis. Two-sided p-values <0.05 were considered significant. Analysis was performed using Stata 16 (StataCorp).
Power calculation
With a power of 0.80 and an alpha of 0.05 and to document the following hypothesised estimates for the coefficient of variation based on previous studies on FFR and FFR-CT89, 1) with a full CI: 2.5% and 2) maximum coefficient of variation: 5%, we needed an estimate of 42 patients to obtain reliable 95% CIs10.
Results
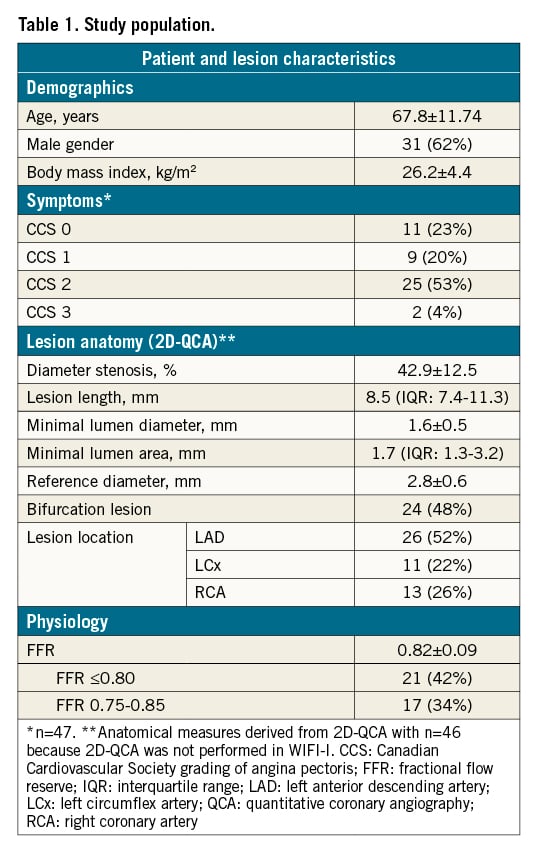
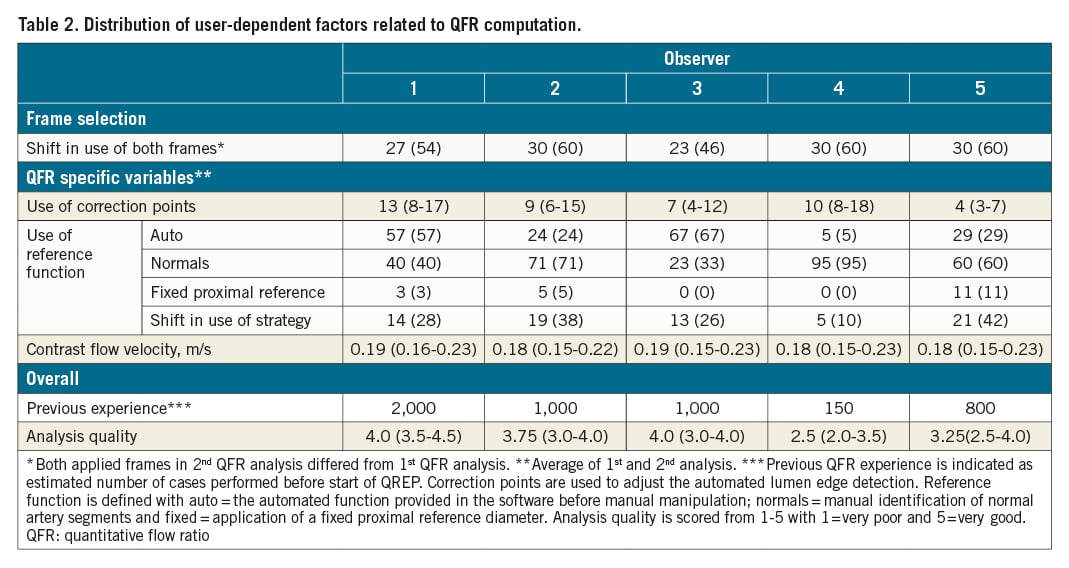
Baseline and lesion characteristics are listed in Table 1. Mean diameter stenosis was 43% (two-dimensional quantitative coronary angiography [2D-QCA]) and mean FFR was 0.82±0.09, with 21 cases (42%) having FFR ≤0.80 (Supplementary Figure 2). Angiographic quality had a median score of 3 with 4 (8%) cases scoring very low (score=1) and 3 (6%) cases scoring very high (score=5) (Supplementary Figure 1). The distribution of central user-dependent parameters included in the QFR analysis is presented stratified by observer in Table 2. Most variation was seen in the use of correction points used to correct the automated lumen edge detection, selection of the reference function and the QFR analysis quality score (Supplementary Figure 3). Observers had different backgrounds and included one core lab technician, one interventional cardiologist and three fellows in training. The previous experience varied from 150 to 2,000 completed QFR analyses before engaging in QREP.
Inter- and intra-observer variation
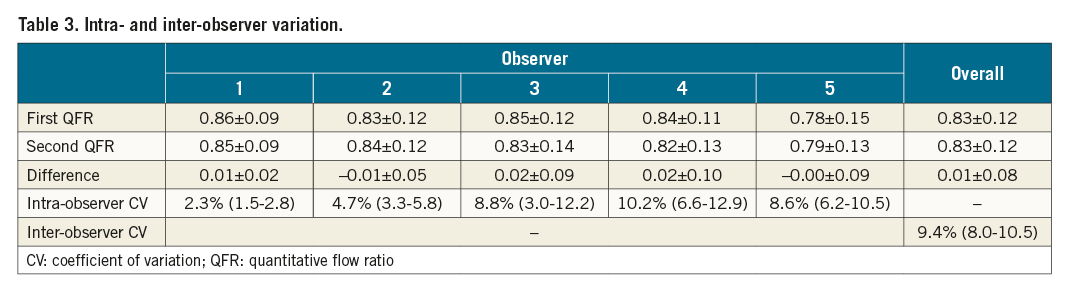
The per-case lowest and highest QFR values among the five observers differed by more than 0.10 in 65 (65%) of the cases (Figure 2A, Figure 2B). The imprecision for repeated QFR measurements ranged from standard deviation to the difference (SDD) 0.02 to SDD 0.10 and was on average 0.08 (8% [0.08/1.00] measurement uncertainty) (Table 3). The bias ranged from mean difference -0.01 to 0.02, while the 95% limits of agreement ranged from -0.04 to -0.018 and 0.05 to 0.23 (Figure 2C). The intra-observer CV ranged from 2.3% (1.5-2.8) to 10.2% (6.6-12.0) and the inter-observer CV was 9.4% (8.0-10.5) (Table 3).
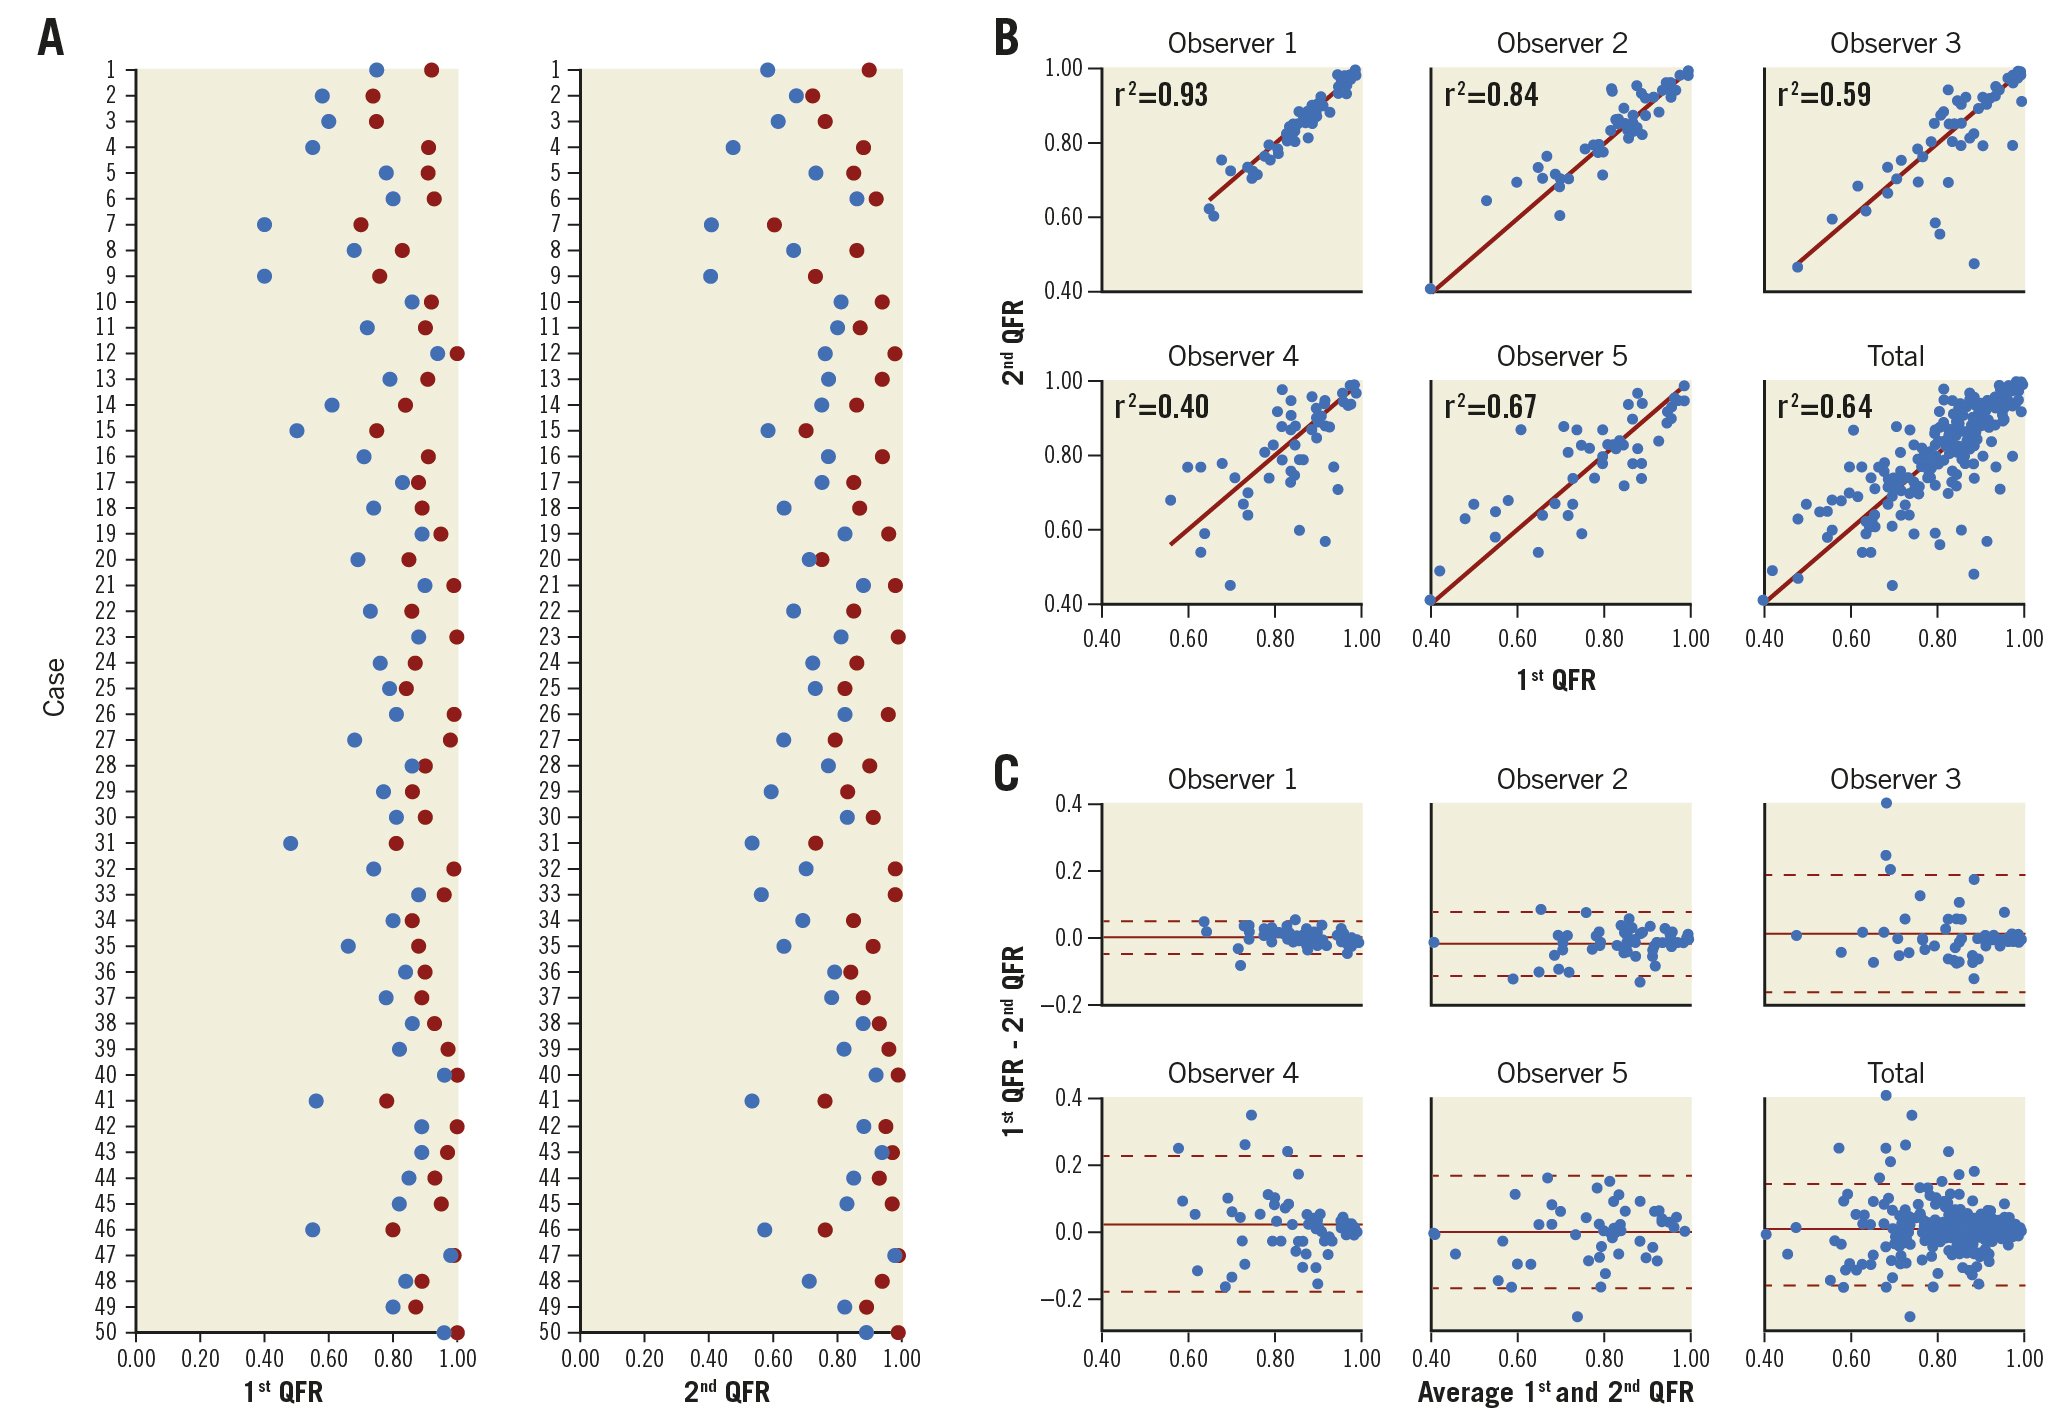
Figure 2. Inter- and intra-observer variation. Per case/patient distribution of the lowest (blue dots) and highest (red dots) QFR among the five observers stratified by first and second QFR computation (A). Scatter (B) and Bland-Altman (C) plots illustrating intra-observer variation for repeated QFR computation.
Predictors of variability
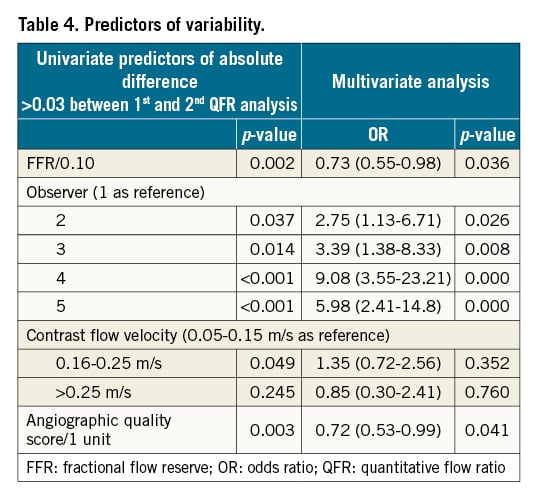
The median absolute difference between the first and second QFR analyses was 0.03 (0.01-0.07) and correlated negatively with the observer’s previous QFR experience level (rho -0.40, p<0.001). Previous QFR experience level further correlated with the QFR analysis score (rho −0.44, p<0.001). Table 4 depicts the univariate and multivariate predictors of an absolute QFR difference >0.03 for repeated measurements. Low FFR value, observer, and low angiographic quality score were the only independent predictors of increased intra-observer variability.
Diagnostic agreement
All observers were in agreement regarding the binary diagnostic result (QFR ≤0.80 or QFR >0.80) in 56% of cases. The intra-observer diagnostic agreement ranged from 76% to 100%. The correlation of QFR with FFR ranged from rho=0.62 to rho=0.74, with imprecision ranging from SD 0.06 to SD 0.12 (Supplementary Figure 4).
Discussion
This is the first adequately powered study assessing both the intra- and inter-observer reproducibility of QFR between multiple blinded and trained observers from different, international sites. The main findings were: 1) the inter-observer reproducibility of QFR was modest; 2) the intra-observer reproducibility of QFR varied from excellent to poor; 3) the reproducibility of QFR was dependent on the stenosis severity as assessed with FFR, angiographic quality, and the observer.
Comparison to existing literature
Previous studies documented moderate to high intra- or inter-observer reproducibility of QFR5611. The presented results may thus appear inconsistent with previous findings. The largest dedicated QFR reproducibility study is the re-analysis of the Diagnostic Accuracy of Angiography–Based Quantitative Flow Ratio Measurements for Online Assessment of Coronary Stenosis (FAVOR II China) study, which was performed by only one observer from a highly experienced core laboratory. The study showed an excellent agreement between the two core labs (mean±SD: 0.00±0.03)6. Contrary to the existing literature, we included several observers with different backgrounds, such as core lab technicians and fellows with heterogeneous experience levels. This may have added to the inter-observer variation and, indeed, the observer was an independent predictor of intra-observer variation (Table 4). Previous studies, with one or two highly skilled observers, may have been able to secure a stricter adherence to standard operating procedures (SOP). Our results are in line with a recent study assessing the reproducibility of a different angiography-derived FFR solution (vFFR). With this modality, substantial variation was found for experts compared to non-experts (CV 12%), even following an initial screening process with removal of cases with substantial overlap, foreshortening and poor contrast filling12. However, unlike the latter study, in QREP we did not include the process of angiographic run selection by observers; our reproducibility estimates may consequently be falsely elevated. Furthermore, direct interaction by observers and treating physicians may have led to acquisition and selection of more suitable projections which were higher in overall angiographic quality.
Factors influencing the reproducibility
Computation of QFR comprises multiple steps that require user interaction (Figure 1). Our results exposed dissimilarities in the approach to these crucial steps amongst the observers (Table 2). This is exemplified by one user using the automated reference diameter function in more than two thirds of all cases while another user used the normal reference diameter function in 95% of all cases. Hence, we believe that different “schools” within QFR analysis may have emerged. All participating observers were certified, recognised experts and were geographically widely distributed. It appears that personal preferences and biases have developed over time. As expected, the variation in user-dependent steps did not influence intra-observer variation, but it is probably a key explanation for the level of inter-observer agreement that we observed. Additionally, our findings may reflect the difficulties of constructing an SOP that limits subjective interpretation while still covering a wide diversity of anatomical variations related to coronary anatomy and coronary artery disease. Our results further reflect the importance of angiographic quality: the better the quality, the better the reproducibility (Table 4). A PCI operator’s specific training is implemented in ongoing clinical outcome trials. The training includes QFR-specific requirements for angiography (i.e., aiming at minimal foreshortening and overlap, avoiding panning and zooming, and ensuring a long and brisk injection and good contrast filling), training in recommended projection angles and training in identification of suboptimal projections. Previous work documented more imprecision of QFR for lower FFR values2. Likewise, we found that the reproducibility of QFR is impaired for lesions with low FFR values (Table 4). This may be caused by difficulties related to a combination of contour detection and reference function derivation in tight and/or long lesions. However, stand-alone anatomical lesion indices were not independent predictors of increased intra-observer variation.
QFR as an emerging tool for physiological lesion assessment
Angiography-based FFR solutions including QFR are currently emerging as a potential alternative to FFR because of the limited use and/or access to wire-based physiology solutions in many areas1314. The majority of previous QFR studies focused on QFR’s agreement with FFR as the reference standard1516. We found that the numerical agreement between QFR and FFR was similar amongst the majority of the observers, but on average, lower than in previous prospective studies (Supplementary Figure 3)2. A useful diagnostic test needs to be reproducible in addition to the ability to diagnose correctly. Repeated FFR can be performed with close to zero bias and imprecision, with a mean difference <0.01, SD 0.02 and coefficient of variation 2.5%, based on two large studies with repeated FFR measurements91718. These numbers were matched by only one QFR observer in the current analysis. This observer also scored highest on QFR analysis quality (Table 2) and had the best agreement with invasive FFR (Table 3, Supplementary Figure 3). The latter indicates that effective training and a systematic approach to QFR analysis (i.e., good intra-observer reproducibility) may lead to a better agreement with FFR.
Clinical implications
Our findings illustrate that meticulous following of the SOP is required for accurate QFR computation, conceivably to a higher degree than for wire-based physiology solutions. If a QFR-guided revascularisation strategy was to be applied in clinical practice with the participating QFR observers, patients would, in some cases, receive different therapy based on who performed the QFR analysis, an observation that is concerning because most observers had experience levels (≥800 cases) that far exceed that which is expected for an average QFR observer. Consequently, it appears that a certain level of continuous feedback and training of even experienced QFR observers is required to limit the slow formation of individual preferences for observers not performing analysis in dedicated core labs. Such continuous feedback on QFR analysis has already been implemented into ongoing randomised clinical outcome trials such as the Functional Assessment by Virtual Online Reconstruction: The FAVOR III Europe-Japan trial (NCT03729739). Focus on adherence to the SOP, and possibly a limited continuous feedback process, could prove sufficient to ensure the required quality for regular clinical practice. Finally, our findings support the importance of developing automated approaches that may circumvent observer-related issues leading to increased variability of a quantitative method. Implementation of machine learning algorithms to perform some of the described steps in the analysis of coronary angiograms may provide opportunities in this regard. Such solutions were recently presented in proof-of-concept studies1920.
Limitations
QREP was not able to assess the short-term reproducibility of QFR using serial invasive coronary angiography. Further, all observers were provided with the same angiographic runs in order to focus our analysis on the software-related aspects of QFR analysis. Hence, potential variability related to the acquisition of two angiographic runs was not included in the current analysis and our results may therefore be too optimistic. All analyses were performed in a core lab setting because it is cumbersome to include multiple observers and secure blinding if using an online set-up which would be required to assess the total reproducibility. Further, the presented analysis involving diagnostic agreement should be interpreted with caution because it might have been influenced by the protocolled selection of a fixed number of FFR positive cases and thus potentially more severe lesions. We were not able to compare QFR’s reproducibility to FFR directly because repeated FFR was not performed in the original studies. Lastly, due to a corrupted QFR repository file, one observer performed the second QFR analysis after the intended time period for 1/50 cases. Therefore, we cannot ensure full observer blinding for this case.
Conclusions
The inter- and intra-observer reproducibility of QFR computed from the same angiograms ranged from high to poor among multiple observers from different sites, with an average agreement of 0.01±0.08 for repeated measurements. The reproducibility was dependent on the observer, angiographic quality, and the coronary artery stenosis severity as assessed by FFR.
Impact on daily practice
The software-related aspects of QFR computation ignoring the angiography step are reproducible when performed correctly. Our findings illustrate the importance of strict adherence to the standard operating procedure for QFR analysis. It may be necessary to implement a certain level of continuous training and certification.
Conflict of interest statement
S. Tu reports grants from Pulse Medical Imaging Technology and Medis Medical Imaging Systems, during the conduct of the study. The other authors have no conflicts of interest to declare.
Supplementary data
To read the full content of this article, please download the PDF.