
Abstract
Aims: Correct sizing of a left atrial appendage (LAA) closure system is important to avoid redeployment of the device and peri-device leaks. The aims of this study were to assess the significance of two-dimensional transoesophageal echocardiography (2D-TEE), real-time 3D transoesophageal echocardiography (RT 3D-TEE) and angiography for measuring the size of the LAA landing zone and to determine the impact on sizing an LAA closure device. Furthermore, we investigated the relevance of volume loading on LAA size.
Methods and results: In a prospective study, 46 patients underwent 2D-TEE and RT 3D-TEE 24 hours prior to LAA closure, at the beginning of the procedure and just before the procedure after volume loading with an average of 1,035±246 ml. Angiography was performed immediately before the implantation. Maximal diameter (2.2±0.4 versus 2.3±0.4 cm; p<0.01), perimeter (6.5±1.0 versus 6.8±1.0 cm, p<0.01) and area (3.2±1.0 versus 3.5±1.1 cm², p<0.01) of the LAA increased significantly after volume loading. The highest correlation (R) between measurements and LAA device size was found for RT 3D-TEE-derived perimeter (R=0.97) and area (R=0.96), whereas the maximal diameter (R=0.78) measured by 2D-TEE and angiography (R=0.76) correlated less closely. Sizing based on an RT 3D-TEE-measured perimeter resulted only in 4% of undersizing the implanted device. Peri-device leaks occurred in seven cases (15%) and were associated with a lower compression of LAA devices (7±1.3% versus 14±3.2% for patients without leaks, p<0.001).
Conclusions: Volume loading before LAA closure increases LAA dimensions significantly. RT 3D-TEE measurements show a closer correlation to LAA closure device size than 2D-TEE or angiographic measurements.
Introduction
The most important complication of patients with non-rheumatic atrial fibrillation (AF) is thromboembolism1. In more than 90% of these patients the left atrial appendage (LAA) is the location of thrombus formation2. Oral anticoagulation (OAC) significantly reduces the risk of thromboembolism3. However, patients are often ineligible for OAC due to contraindications4. More recently, percutaneous closure of the LAA (LAAC) has been considered in many studies as a safe and feasible alternative to OAC5-7.
Correct sizing of the LAA closure device is important for adequate deployment and to avoid periprocedural device resizing and peri-device leaks8. Although experts and experienced centres often use 3D measurements for sizing, constructor recommendations on device sizing are currently based on the largest diameter of the intended landing zone (LZ) provided by either two-dimensional transoesophageal echocardiography (2D-TEE) or angiographic measurements8. However, 2D-TEE does not reveal the three-dimensional complexity of the LAA. An alternative for assessing the 3D structure of the LAA may be three-dimensional computed tomography (3D-CT). Nevertheless, performing CT exposes the patient to additional contrast agent and radiation.
Several studies comparing 2D-TEE images with real-time 3D transoesophageal echocardiography (RT 3D-TEE) images of the LAA have shown that RT 3D-TEE is more accurate than 2D-TEE for the assessment of LAA orifice size9. Lately, in a study with a small cohort of 31 patients, Spencer et al showed increased LAA orifice and depth dimensions after volume loading with saline during LAA closure; however, the impact of volume loading conditions on device size selection is unknown10. Therefore, the aims of our study were the following:
1. To compare different methodologies for the assessment of the LAA and to determine their accuracy.
2. To determine the influence of volume loading on LAA dimensions.
3. To develop a method for optimising sizing for LAAC, in particular with the AMPLATZER™ Cardiac Plug (ACP) and AMPLATZER™ Amulet™ devices (St. Jude Medical, St. Paul, MN, USA).
4. To evaluate optimal compression of the LAAC device for the avoidance of peri-device leaks.
Methods
STUDY POPULATION AND HAEMODYNAMIC MEASUREMENTS
A total of 46 consecutive patients with non-valvular AF and contraindication to effective OAC, who underwent LAAC with the ACP or the AMPLATZER Amulet between July 2014 and March 2015, were prospectively enrolled in the study. Patient demographics, the CHA2DS2-VASc score and the HASBLED score were assessed for each patient. All patients received 10 to 15 ml/kg body weight of normal saline, starting at the beginning of the anaesthesia. Left atrial pressure measurements were recorded directly after the transseptal puncture and canalisation of the LA and after volume loading with an average of 1,035±246 ml saline using the DAVID haemodynamic software (metek, Roetgen, Germany).
TRANSOESOPHAGEAL ECHOCARDIOGRAPHY PROTOCOL
Transoesophageal echocardiography (TEE) was performed with commercially available equipment (Vivid E9™, BT12; GE Medical Systems, Milwaukee, WI, USA) using multiplane 5-MHz TEE. Images were digitally stored and subsequently analysed offline with the GE EchoPAC BT12 software (GE Medical Systems). TEE examination was performed in all patients 24 hours prior to the procedure and twice during the procedure – at the beginning of the procedure and after volume loading.
A follow-up TEE was performed in all patients four weeks after LAAC to assess the closure device stability and to detect potential thrombus and/or peri-device leaks. Therefore, the LAA was systematically scanned in multiple views using colour Doppler at the lowest possible Nyquist limit (≥25 cm/sec), avoiding tissue artefacts. The observed leaks were classified according to the width of the colour jet flow as previously published: trivial leak (jet flow ≤3 mm) or significant leak (jet flow >3 mm)11,12.
TWO-DIMENSIONAL TRANSOESOPHAGEAL ECHOCARDIOGRAPHY
Multiplane 2D-TEE was performed according to a standard protocol, starting with the assessment for thrombi. The maximum diameter (D1) at the LZ was obtained in different planes from 0° to 150° in 30° increments. It was measured from the origin of the left circumflex coronary artery to the roof of the LAA, 1 cm inward from the apex of the ridge separating the LAA and the left superior pulmonary vein (Figure 1). The largest diameter in the different planes was then chosen as the maximum 2D diameter (D2D) of the LZ. The mean of the maximum diameters (D1mean) was then calculated in order to estimate the perimeter of the LZ using the following equation: 2D-TEE-LZ-perimeter=π×D1mean.
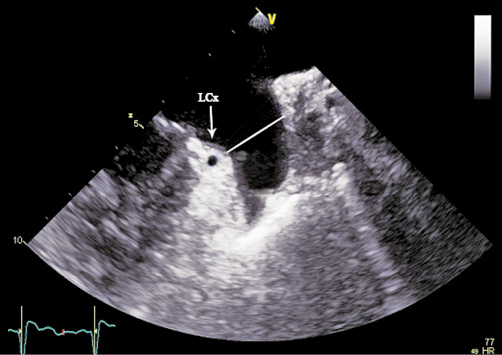
Figure 1. 2D-TEE measurements of the maximum diameter of the landing zone of the left atrial appendage shown in 60° view. The white line shows the maximum diameter of the landing zone.
After implantation of the closure device, the constricted diameter of the implanted device was obtained from the orthogonal planes at 60° and 150° (Figure 2) and was used to estimate the real perimeter of the LZ.
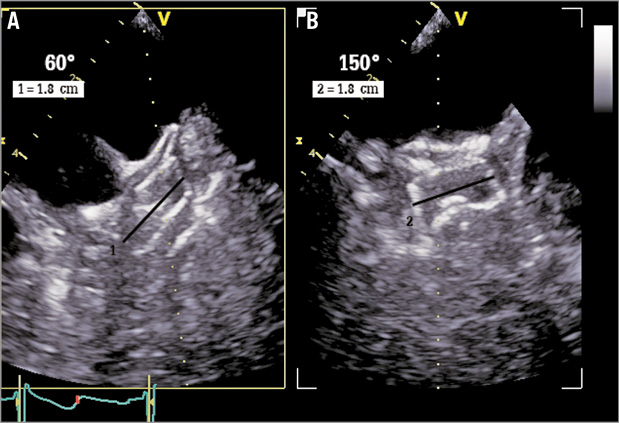
Figure 2. 2D-TEE measurements of the compression of the left atrial appendage (LAA) closure device. A) Closure device shown in 60° view. B) Closure device shown in 150° view. Black line shows the constricted diameter (DCD) of the implanted device.
The compression of the closure device was expressed in percent comparing the constricted diameter of the device with the unconstricted diameter of the device as provided by the manufacturer, using the following formula:
Device-compression=(diameter of device–constricted diameter of device)/diameter of device×100.
The constricted diameter of the device was also used to estimate the compressed perimeter of the implanted device:
Compressed device-perimeter=constricted diameter of device×π.
REAL-TIME 3D TRANSOESOPHAGEAL ECHOCARDIOGRAPHY
RT 3D-TEE was also performed with the GE Vivid E9 BT12 cardiovascular ultrasound system, using the new 4D transoesophageal echocardiographic transducer. Images of the LAA were obtained by the zoom mode from pyramidal data sets using one beat acquisition during apnoea at end-expiration. The temporal resolution of the acquisition varied slightly and ranged between 18 and 21 beats per second.
Particular care was taken always to record the complete LAA, allowing visualisation of an en face view of the LZ of the device within the LAA (Figure 3A). After acquisition of the pyramidal data sets, they were sliced along designated x, y, and z axes or using a random cropping plane, to ensure adequate three-dimensional visualisation of the LAA. More details regarding the acquisition of RT 3D-TEE images of the LAA have been reported previously13.
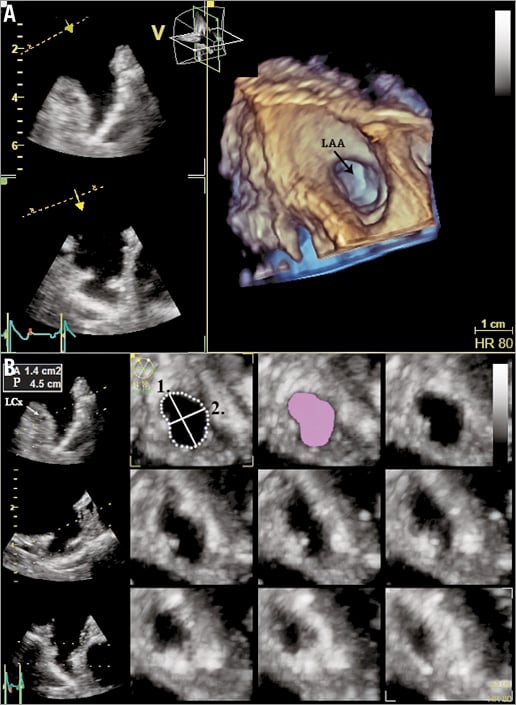
Figure 3. Real-time 3D transoesophageal echocardiography of the left atrial appendage (LAA). A) Three-dimensional en face visualisation of the LAA. B) Spatial reconstruction of the landing zone from 3D images of the LAA. Dotted line shows the perimeter of the landing zone, lilac shaded area shows the area of the landing zone. Solid line 1 shows the maximum diameter of the landing zone, solid line 2 the minimum diameter of the landing zone. LCx: left circumflex artery
The three-dimensional data sets were digitally stored and analysed offline with the GE EchoPAC BT12 software. The obtained three-dimensional images of the LAA were assessed using the 12-channel multislice mode, allowing spatial visualisation and adjustment of the LAA in the three different dimensions. The short-axis view was chosen to measure the perimeter (P) and the area (A) of the intended LZ, along a plane from the origin of the left circumflex coronary artery to the roof of the LAA, 1 cm inward from the apex of the ridge separating the LAA and the left superior pulmonary vein. The maximal and minimal diameter (Dmax, Dmin) of the LZ were obtained from the adjusted orifice of the intended LZ (Figure 3B). The eccentricity index of the LZ expressed in percent was calculated by the formula:
Eccentricity=(Dmax–Dmin)/Dmax×100.
The mean diameter of the LZ was calculated with different formulas:
1. It was derived from the perimeter (DP) using the formula: DP=P/π.
2. Furthermore, the mean diameter of the LZ was derived from the area (DA): DA=2×SQRT(A/π).
CONTRAST ANGIOGRAPHIC MEASUREMENTS OF THE LANDING ZONE
The maximum diameter of the LZ was measured by contrast angiography in the (RAO 30°/10°) cranial and in the caudal view. The largest diameter in the different views was then chosen as the maximum angiographic diameter (DANG) of the LZ. The mean of the maximum diameters in the different views was calculated.
IMPLANTATION OF THE DEVICE
The LAAC procedure was performed in all patients under general anaesthesia using the ACP (n=10) and the AMPLATZER Amulet (n=36). The implantation was guided by contrast angiography and periprocedural TEE, as described previously8. The device size was determined on the basis of a combination of maximum diameter of the intended LZ on 2D-TEE and the contrast angiography as recommended by the manufacturer’s instructions for use, as well as visual assessment of the LAA (AMPLATZER Cardiac Plug, AMPLATZER Amulet Left Atrial Appendage Occluder Instructions for Use; St. Jude Medical). After deployment of the closure device, device stability and position were tested with contrast angiography and TEE. Further details regarding the LAAC procedure and the special features of the ACP and AMPLATZER Amulet device have been published elsewhere14.
Statistical analysis
Statistics of continuous variables are presented as means (±SD), categorical variables as absolute numbers and percentages. Continuous variables were tested via paired or unpaired Student’s t-tests. For more than two groups simple linear models (ANOVA) or the Kruskal-Wallis test were used. Fisher’s exact test was used to assess differences in categorical variables. The correlation between RT 3D-TEE and 2D-TEE measurements of the LZ with the implanted device size were analysed using linear regression analysis and Spearman’s correlation coefficients. Agreement analysis between RT 3D-TEE obtained and 2D-TEE obtained perimeters of the LZ and the compressed device perimeter was evaluated with Bland-Altman analysis by calculating the bias and the 95% limits of agreement. Statistical significance was considered as a two-tailed probability value <0.05. Statistical analyses were performed with SPSS, Version 22 (IBM Corp., Armonk, NY, USA) and Stata, Version 13.1 (StataCorp LLC, College Station, TX, USA).
Results
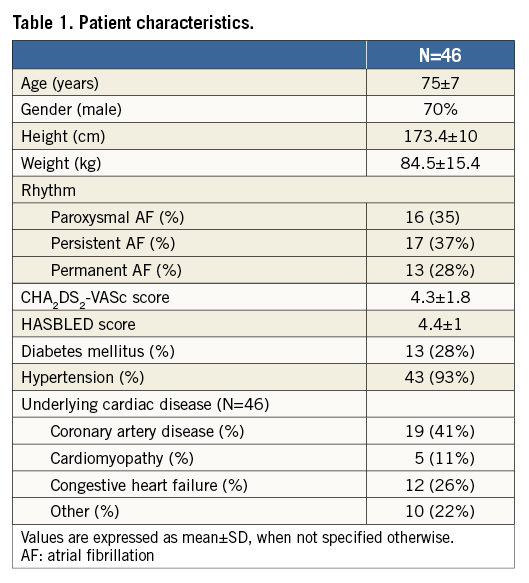
The baseline characteristics of the study population are shown in Table 1. TEE examination was possible in all patients without complications twice during the procedure. Six patients declined TEE examination the day before the procedure. None of the patients presented device-related thrombus at four-week TEE follow-up.
TRANSOESOPHAGEAL ECHOCARDIOGRAPHIC MEASUREMENTS
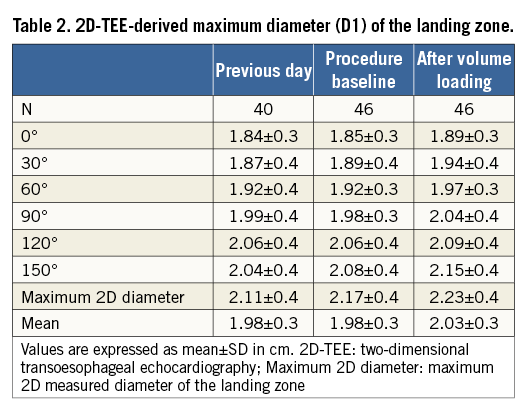
Table 2 provides the maximum diameter (D1) of the LZ at different angles as determined by 2D-TEE imaging at different times. The maximum diameter measured after volume loading was significantly larger as compared to the maximum diameter the day before the procedure and at the beginning of the procedure. Of interest, measurements at the beginning of the procedure and on the previous day also showed differences, providing larger diameters at the beginning of the procedure. The mean differences between the maximum diameters measured after volume loading with the ones on the previous day and at the beginning of the procedure were 0.14±0.18 cm (p<0.001) and 0.06±0.07 cm (p<0.001), respectively. The average increase in mean diameter of the LZ was 0.08±0.1 cm (p<0.001) for the measurements after volume loading compared with the measurements on the previous day, and 0.05±0.1 cm (p<0.001) for measurements obtained after volume loading and at the beginning of the procedure.
The 2D-TEE revealed that the mean compression of all LAA devices was 12.9±3.9% after implantation. Figure 4 displays the distribution of the compression values of the implanted devices.
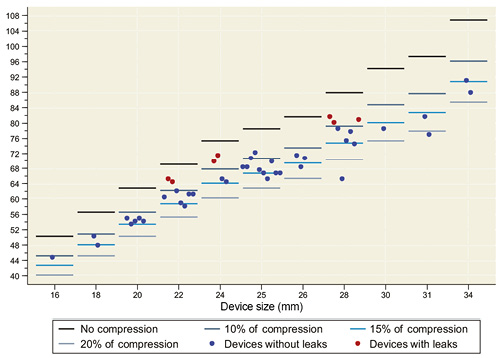
Figure 4. The compression of the implanted closure devices as measured by two-dimensional transoesophageal echocardiography.
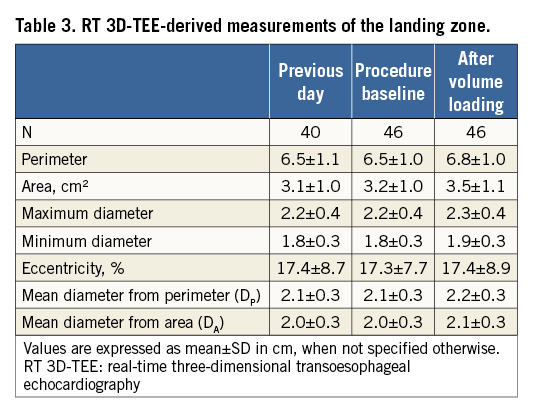
The measurements of the LZ obtained by RT 3D-TEE are shown in Table 3. All RT 3D-TEE-derived dimensions of the LZ, apart from the eccentricity factor, measured after volume loading were significantly larger compared to the ones obtained the day before the procedure and at the beginning of the procedure. The mean increase of the perimeter after volume loading was 0.4 cm (p<0.001) as compared to the measurements on the previous day and 0.3 cm (p<0.001) as compared to measurements at the beginning of the procedure. The area of the LZ increased by an average of 0.4 cm (p<0.001) and 0.3 cm (p<0.001), respectively, by contrast with measurements from the previous day and at the beginning of the procedure.
TWO-DIMENSIONAL TEE AT FOUR-WEEK FOLLOW-UP
At the four-week follow-up, 2D-TEE peri-device leaks were observed in seven cases (15%), all of which were classified as trivial (jet flow ≤3 mm). Logistic regression analysis showed a significant correlation between peri-device leaks and device compression (p=0.038). The mean compression of LAA devices with peri-device leaks was 7±1.3% and was significantly lower than the compression of LAA devices without peri-device leaks (14±3.2%, p<0.001) (Figure 4). In two patients with peri-device leaks, the device was implanted with the modified sandwich technique15. The mean of the compressed perimeter of the implanted device (PCD) as calculated by the constricted device diameter (DC) was 6.7±1 cm.
The LAA shape as assessed by the eccentricity index did not significantly correlate with the occurrence of peri-device leakage (devices with no leaks=17.1±9.1 versus devices with leaks=19.4±8, p=0.51).
COMPARISON BETWEEN RT 3D-TEE, 2D-TEE AND IMPLANTED DEVICE
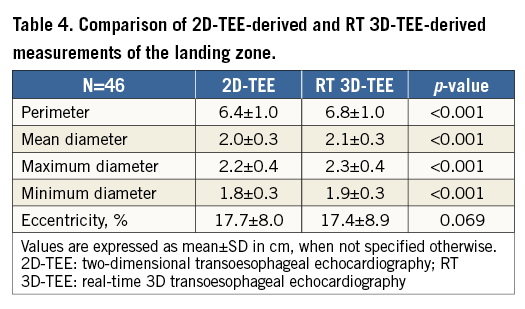
As shown in Table 4, 2D-TEE-derived measurements of the perimeter of the LZ, maximum and minimum diameters as well as the mean diameter of the LZ were significantly lower as compared with respective RT 3D-TEE measurements. The difference between the mean diameter of the LZ (D1mean) measured by 2D-TEE and the RT 3D-TEE obtained mean diameter of the LZ derived from the perimeter was even larger (2.0±0.3 versus 2.2±0.3 mm, p<0.001).
Using linear regression analysis, RT 3D-TEE showed better correlation with the implanted device in the assessment of the LZ compared with 2D-TEE (r=0.91, 95% confidence interval [CI]: –0.36 to 0.92, versus r=0.67, 95% CI: –0.4 to 2.0).
The Bland-Altman analysis (Figure 5) demonstrated that 2D-TEE significantly underestimated the LZ perimeter, compared with RT 3D-TEE. The mean differences between 2D-TEE-derived and RT 3D-TEE-derived perimeters of the LZ and the calculated perimeter of the implanted device were –0.3±0.66 cm (p=0.001) and 0.03±0.32 cm (p=0.58), respectively.
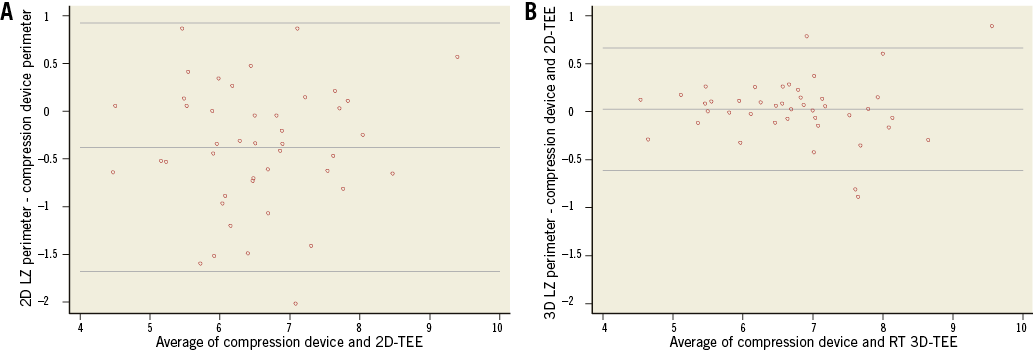
Figure 5. Scatter plots of Bland-Altman analysis for measurements of the perimeter of the landing zone (LZ) versus the calculated perimeter of the implanted device in cm. A) 2D transoesophageal echocardiography (2D-TEE). B) Real-time 3D transoesophageal echocardiography (RT 3D-TEE).
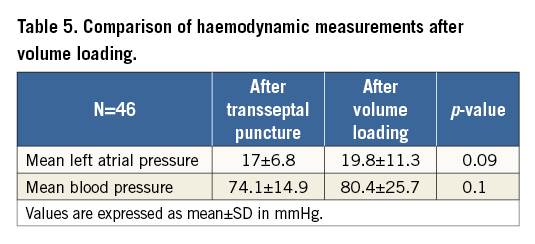
HAEMODYNAMIC MEASUREMENTS
The mean LA pressures and the mean blood pressure measured immediately after transseptal puncture and after volume loading are shown in Table 5. There was no significant difference between the haemodynamic measurements obtained immediately after transseptal puncture and after volume loading.
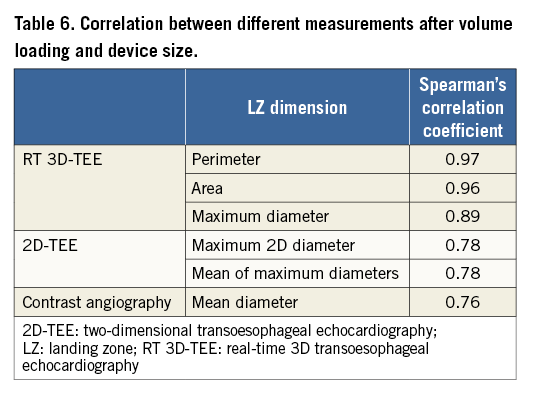
CORRELATION BETWEEN DIFFERENT MEASUREMENTS AND DEVICE SIZE
The implanted device size showed the highest correlations for the RT 3D-TEE-derived measurements of the LZ. Both the mean diameter derived from the perimeter (DP) and the mean diameter derived from the area (DA) had the highest Spearman correlation coefficient with R=0.97 and R=0.96, respectively. In contrast, the correlation was much lower for 2D-TEE measurements. The correlation coefficient for the maximum 2D diameter (D2D) of the LZ and for the mean of maximum diameters (D1mean), measured after volume loading, was the same (R=0.78). The lowest Spearman coefficient was found for the correlation between the maximum diameter of the LZ obtained from contrast angiography (DANG) and the implanted device (R=0.76). Table 6 displays the correlation coefficients of all measurements.
AGREEMENT OF DEVICE SIZING BASED ON THE APPLICATION OF INDUSTRY GUIDELINES TO DIFFERENT LANDING ZONE DIAMETER MEASUREMENTS WITH THE IMPLANTER CHOICE OF DEVICE SIZE
Based on the product manual of the manufacturer, Table 7 shows the agreement of different measurements at the LZ with the actual selected device size. Sizing based on the maximum 2D diameter of the LZ using 2D-TEE the day before the procedure corresponded only poorly with the implanter device choice in 43.9% of patients, and would have resulted in oversizing of the device in 31.7% and undersizing of the device in 24.4% of patients (Figure 6). The 2D-TEE measurement of the maximum diameter of the LZ after volume loading did not improve this agreement significantly (45.7%).
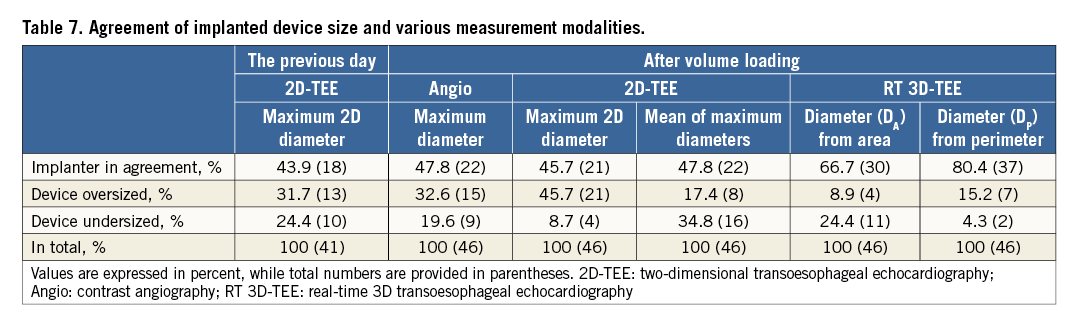
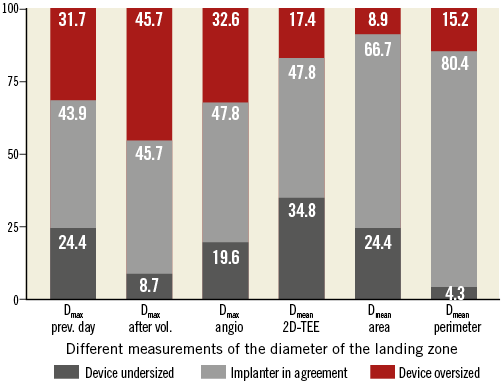
Figure 6. Agreement of implanted device size and various measurement modalities. Dmax prev. day: maximum 2D diameter obtained the previous day; Dmax after vol.: maximum 2D diameter obtained after volume loading; Dmax angio: maximum angiographic diameter; Dmean 2D-TEE: mean of maximum 2D diameters after volume loading; Dmean area: mean diameter derived from area; Dmean perimeter: mean diameter derived from perimeter
As compared to 2D-TEE device sizing based on LZ diameter, measurements derived from RT 3D-TEE corresponded better with the actual implanted device size.
The highest agreement (80.4%) with implanter device choice was found for sizing based on the mean diameter derived from the perimeter (DP) of the LZ.
Discussion
Recently, RT 3D-TEE has been shown to allow accurate and complete visualisation of the LAA with acceptable accuracy. Furthermore, RT 3D-TEE may be used for guiding LAAC procedures. One of the most important steps in the LAAC procedure is correct sizing of the device, which is based on adequate assessment of the dimensions of the LZ of the device.
The most important findings of our study are:
– The dimensions of the landing zone are dependent on the loading conditions of the patient and increase after systematic volume loading.
– The 2D-TEE or angiographic measurements are less accurate for sizing of the LZ than 3D-TEE assessment.
– The 3D-TEE-derived perimeter of the LZ is the most accurate parameter for determining the optimal device size.
Devices with a suboptimal compression more frequently have peri-device leakage.
SIGNIFICANCE OF VOLUME LOADING OF PATIENTS
Previous studies have demonstrated that the LAA has a reservoir function and may distend with increasing LA pressure and volume loading. In particular, animal studies have shown that removal of the LAA resulted in loss of compliance of the left atrium16-18. Davis et al reported that the LAA is estimated to be 2.6 times as compliant as the left atrium and may enable the LA to adapt the reservoir function better to both physiological and pathological conditions17. More recently, and in agreement with our findings, in a cohort of thirty-one consecutive patients undergoing LAAC, Spencer et al showed an average increase of ~2 mm in LAA width and depth after volume loading10.
In our study, the perimeter and the area of the LAA increased significantly by 4% and 8%, respectively, after volume loading. These changes are in accordance with previous findings by Hondo et al16. Similarly, Ito et al showed that LAA area decreased in 10 patients with heart failure after successful treatment18.
The increase of the size of the LAA is of particular importance for LAAC, since inadequate volume loading may result in underestimation of the size of the LZ and may result in inappropriate sizing of the occlusion device. Importantly, we demonstrated that both TEE assessment the day before the procedure and at the beginning of the procedure prior to volume loading resulted in underestimation of the size of the LZ. Hence, we believe that special care should be taken to obtain LAA measurements after volume loading.
COMPARISON OF 2D- AND 3D-TEE FOR SIZING THE LANDING ZONE
Multiple studies demonstrated that, although 2D-TEE has the advantage of a higher frame rate and better resolution than 3D-TEE, RT 3D-TEE has particular advantages, i.e., comprehensive 3D examination of the complex anatomy of the LAA. Consequently, RT 3D-TEE is being used more frequently to guide LAAC procedures. More recently, studies demonstrated that RT 3D-TEE measurements of the LAA orifice size correlated better with CT measurements, whereas 2D-TEE measurements underestimated the size of the LAA orifice13. Nucifora et al demonstrated that both RT 3D-TEE and 2D-TEE underestimated LAA orifice area as compared to CT9. However, RT 3D-TEE showed a smaller bias and narrower limits of agreement with CT. Our findings reconfirm the results of the latter study, demonstrating that RT 3D-TEE results in larger LAA orifice measurements than 2D-TEE.
However, there are only a few studies determining the significance of RT 3D-TEE for assessing the size of the landing zone and the importance of these measurements for device selection. We were able to show that the perimeter of the LZ as measured by RT 3D-TEE correlated much better with the selected device size than 2D-TEE measurements. Furthermore, if the size of the device were determined by manufacturers’ recommendations based on either 2D-TEE measurements or angiographic measurements, more patients would receive an undersized device or a potentially oversized device as compared to RT 3D-TEE measurements. Importantly, our data also show that 2D-TEE measurements result in potentially less undersized devices than angiographic measurements. The best correlation between actual selected device sizes was found either for the perimeter or for the area of the LZ as measured by RT 3D-TEE. Measurement of the perimeter of the LZ by RT 3D-TEE has the highest accuracy for optimal sizing of the device and potentially results in undersizing of the device in only 4.3% of cases.
PERI-DEVICE LEAKAGE AND COMPRESSION OF THE DEVICE
In our study, we observed peri-device leakage in 15% of cases. This finding is in congruence with the findings of Tzikas et al who reported peri-device leakage in 12% of cases8. Current guidelines for implanting the ACP or Amulet device recommend an oversizing of the device by 10-20%6. The recommended percentage of compression of the device varies with the selected device size using the product manual of the manufacturer. In a study including 25 patients, Freixa et al showed that the presence of peri-device leaks was associated with a lower device oversizing as assessed by TEE, i.e., patients with a device oversize of 2.7 mm had significantly fewer peri-device leaks than patients with a device oversize of 0.1 mm19.
In our study, all patients with peri-device leaks had a compression of <10% of the device or else the implantation was performed with the so-called sandwich technique. None of the patients with a compression of >10% had peri-device leakage. Therefore, our findings support the results of Freixa et al and reconfirm the current guidelines for implanting LAAO devices with an oversizing of 10-20%. Moreover, our study shows that RT 3D-TEE may be used to predict the compression of the device. If the perimeter of the LZ is measured, it may be used to calculate the mean diameter of the area of the LZ. This mean diameter may be used to calculate the anticipated compression of the device.
Limitations
First, while 3D zoom and live 3D are indeed real-time modes, the acquisition of a 3D full volume is based on automatic reconstruction from subvolumes and is therefore prone to artefacts from arrhythmias, and ventilation. Hence, special care was taken to avoid motion artefacts and to record images during apnoea at end-expiration. The LAA size varies during AF. We could not assess this variation. Nevertheless, particular care was taken to obtain maximal sizes of the LAA during AF. Second, as 3D echo obeys the same physical laws as 2D, poor 2D image quality will probably translate into similarly poor 3D image quality. In our study, the LZ was defined along a plane from the origin of the left circumflex coronary artery to the roof of the LAA – 1 cm inward from the apex of the ridge separating the LAA and the left superior pulmonary vein. However, in some cases, actual implantation of the device may not be feasible in exactly this position. Compression of the LAA closure device is difficult to assess by 2D-TEE due to artefacts of the device itself and limitations in spatial resolution.
Conclusions
Volume loading before LAA closure increases LAA dimensions significantly. The RT 3D-TEE measurements show a closer correlation to LAA closure device size than 2D-TEE or angiographic measurements. Perimeter- and area-derived diameters by RT 3D-TEE improve correct device selection and result in less oversizing and undersizing of the device as compared to 2D-TEE measurements. Peri-device leakage was significantly more frequent in patients with compression <10% than in those patients with compression >10%.
| Impact on daily practice Percutaneous closure of the left atrial appendage requires the precise anatomical assessment of the dimensions of the landing zone of the device to avoid periprocedural device resizing and peri-device leaks. This study describes a measurement methodology that can be adopted by clinicians to determine the accurate closure device size better. |
Conflict of interest statement
The authors have no conflicts of interest to declare.