Abstract
Aims: This study aimed to assess survival and causes of death in a real-world TAVR population as compared to an age- and sex-matched background population.
Methods and results: Each aortic stenosis (AS) patient treated with TAVR in Eastern Denmark between 2007 and 2014 (n=617) was matched with 25 age- and sex-matched controls (n=15,425) randomly drawn from the general Danish population. In the total TAVR population, early mortality (≤90 days) was significantly higher (hazard ratio [HR] 3.90 [2.82-5.39]; p<0.001) as compared to its background population, driven mainly by cardiovascular (CV) mortality. Late mortality (>90 days) was not different between the TAVR and background population (HR 1.16 [0.96-1.40]; p=0.126), causes of death being mainly non-CV. In subgroup analysis, the HR for late mortality was 0.98, 1.11, and 1.90 for the low-, intermediate-, and high-risk TAVR groups, respectively, as compared to their matched controls and 1.04, 1.45, and 1.52 for the high gradient, paradoxical low-flow low-gradient (P-LFLG), and classical LFLG (C-LFLG) groups, respectively, as compared to their controls.
Conclusions: In general, AS patients who survive the first three months after TAVR have a similar survival to their matched controls. Relative survival benefit is the highest in low-to-intermediate risk AS patients with a high transvalvular gradient.
Abbreviations
AS: aortic stenosis
AVA: aortic valve area
C-LFLG: classical low-flow low-gradient
CV: cardiovascular
HG: high gradient
HR: hazard ratio
IM: intermediate
LFLG: low-flow low-gradient
LVEF: left ventricular ejection fraction
LVOT: left ventricular outflow tract
MG: mean gradient
RCT: randomised controlled trial
P-LFLG: paradoxical low-flow low-gradient
SAVR: surgical aortic valve replacement
STS: Society of Thoracic Surgeons
TAVR: transcatheter aortic valve replacement
Introduction
Aortic stenosis (AS) is the most common valvular heart disease in developed countries and its impact on public health and healthcare resources is expected to increase due to ageing populations1,2. The prevalence of AS increases with age, and is reported to range from 2% to 5% in adults older than 75 years of age3. Once symptoms appear, untreated patients with severe AS have a poor prognosis: they will experience worsening symptoms, eventually leading to death4.
Until the early 21st century, the only therapeutic option for these patients was surgical aortic valve replacement (SAVR), but this has changed with the introduction of transcatheter aortic valve replacement (TAVR). TAVR has become an established therapeutic option for patients with symptomatic, severe AS who are ineligible or at high risk for conventional cardiac surgery5-8. In recent years, TAVR is also increasingly used to treat patients with a lower risk profile. This practice is supported by results from the NOTION, PARTNER 2 and SURTAVI trials indicating that TAVR is a viable option for lower-risk patients9-11.
Several studies have described mortality – or survival – in patients with severe AS following TAVR as compared to SAVR or best medical treatment. In all these studies, the entire study population consisted of patients with symptomatic, severe AS5-11. However, so far there has been no comparison of a population with severe AS treated with TAVR and an age- and sex-matched background population. This study aimed to assess survival and causes of death in a real-world all-comers TAVR population as compared to age- and sex-matched controls, randomly selected from the general population.
Methods
STUDY POPULATION
This study is a retrospective case-control study including all patients who underwent TAVR at Rigshospitalet, Copenhagen, Denmark, in the period 2007 to 2014. Patients who underwent a redo TAVR (n=6) were only included at the time of the index procedure. The study population also comprises TAVR patients treated in the NOTION trial9. Danmark Statistik – the National Office of Statistics – matched each TAVR patient with 25 age- and sex-matched controls randomly drawn from the general East Danish population by computer-based random selection. Danmark Statistik collects all data on mortality and causes of death of the total Danish population. The only “limiting factor” for this study was that control subjects had to live in Eastern Denmark, i.e., the same region as the TAVR patients. All other data were obtained from the East Danish Heart Registry and Landspatientregisteret (Denmark). Follow-up started from the date of the TAVR procedure, and ended on the date of death, emigration, or end of the study (31 December 2014), whichever came first, both for the TAVR patient as well as for their matched controls. An informed consent was obtained from each patient and the study protocol conforms to the ethical guidelines of the 1975 Declaration of Helsinki.
TAVR PROCEDURE
For every patient, the decision for TAVR was made at a Heart Team meeting. All TAVR procedures were performed as previously described12,13. Transfemoral vascular access was the preferred route of access; the only other access route utilised was the trans-subclavian and direct aortic approach.
SURGICAL RISK CLASSIFICATION
The patients’ surgical risk was evaluated using the Society of Thoracic Surgeons (STS) scoring system. Based on the calculated mortality risk for every single TAVR patient, the study population was divided into three groups: a low-risk group (STS score <4), an intermediate (IM)-risk group (STS score 4-8), and a high-risk group (STS score ≥8). Survival and causes of death were compared between TAVR patients and their controls within these three different groups.
TYPES OF SEVERE AS
All patients had a preprocedural echocardiography with measurement of heart rate, left ventricular outflow tract (LVOT) diameter, LVOT velocity time integral, left ventricular ejection fraction (LVEF), peak transvalvular velocity, mean transvalvular gradient (MG), and aortic valve area (AVA). The echocardiographic criteria for the definition of severe AS used in Denmark are based on the latest ESC guidelines14. Based on echocardiographic parameters, the study population was divided into three groups: a high gradient group (HG; MG >40 mmHg), a classical low-flow low-gradient group (C-LFLG; LVEF <50%, MG <40 mmHg, AVA <1.0 cm2), and a paradoxical low-flow low-gradient group (P-LFLG; LVEF >50%, MG <40 mmHg, AVA <1.0 cm2). A low-flow state was defined as a stroke volume index <35 mL/m2 15. Survival and causes of death were compared between TAVR patients and their controls within these three different groups.
STATISTICAL ANALYSIS
Categorical variables are reported as absolute values and percentages. Continuous variables are expressed as mean±SD for normally distributed variables and median (interquartile range [IQR]) for skewed variables. Histograms were used for visual assessment of the normality of distribution of continuous variables. Categorical data were compared using the chi-square or Fisher’s exact test, and continuous data using the Student’s t-test or Mann-Whitney U test, as appropriate. Kaplan-Meier curves show the cumulative survival rates over time (%), and hazard ratios (HR) adjusted for sex and age were calculated with a stratified Cox proportional hazards model. The proportional hazards assumption for this case-control study was tested by Andersen’s plot as well as Cox-Snell residuals. A pre-specified 90-day landmark analysis was performed according to a landmark at 90 days, with the HR calculated separately for events that occurred up to 90 days and events that occurred between 90 days and the end of the follow-up period. All tests were two-sided, and p-values <0.05 were considered to indicate statistical significance. All analyses were conducted using SPSS statistical software, Version 22.0 (IBM Corp., Armonk, NY, USA).
Results
STUDY POPULATION
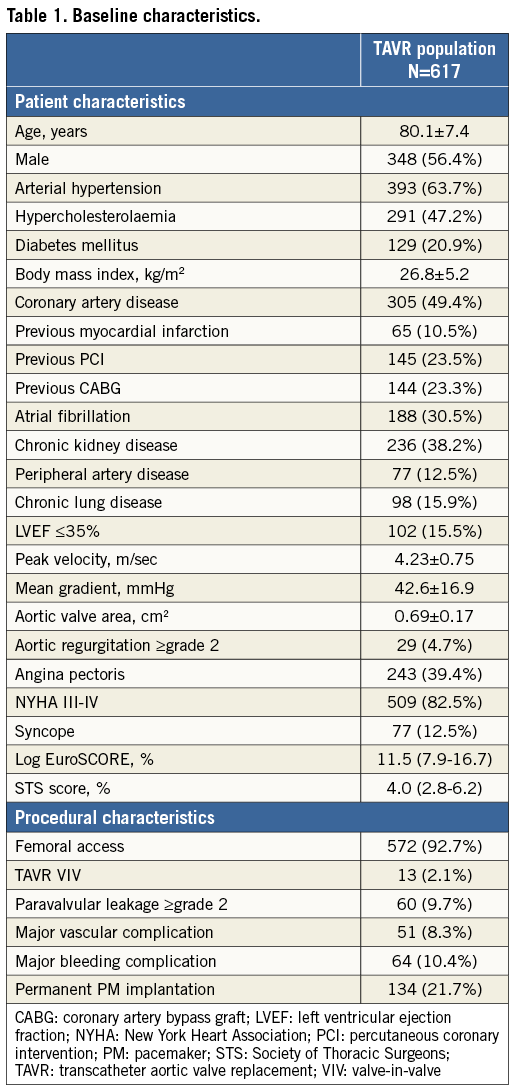
In the predefined study period, 617 patients with symptomatic, severe AS underwent TAVR as an index procedure. The mean age was 80.1±7.4 years and 56.4% were male. The median STS risk score was 4.0% (IQR 2.8%-6.2%). The majority of TAVR procedures (92.7%) were performed by the transfemoral route. All baseline characteristics of the TAVR population can be found in Table 1. As stated, Danmark Statistik randomly identified an age- and sex-matched background population of 15,425 controls with a mean age of 80.1 years; 56.4% of them were male (i.e., exactly similar to the TAVR population).
SURVIVAL AND CARDIOVASCULAR MORTALITY
The Kaplan-Meier curves in Figure 1 show the cumulative survival rates for both the TAVR population and its age- and sex-matched background population. The median follow-up duration was 38.8 months in both groups. When analysing the entire follow-up period without landmark, mortality in the TAVR population was significantly higher as compared to its matched controls (HR 1.43, p<0.001). In the 90-day landmark analysis, there was no statistically significant difference in mortality between the TAVR and background populations (HR 1.16, p=0.126). In the TAVR population, early mortality (≤90 days) was mainly cardiovascular (CV; >75%), whereas CV mortality only accounted for 34.8% of late mortality (>90 days) – the latter not being statistically different from the CV mortality rate in the background population (Figure 1C, Figure 1D).
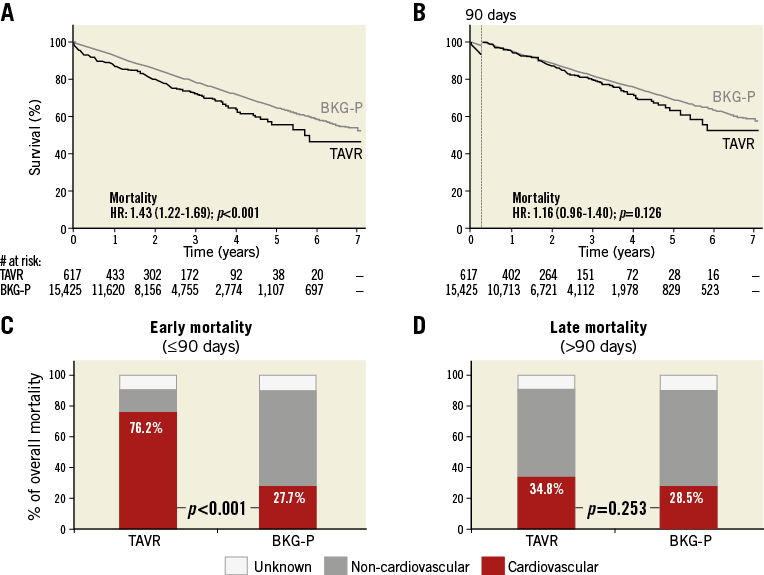
Figure 1. Survival and causes of death in the TAVR and age- and sex-matched background populations. A) & B) Kaplan-Meier survival curves for the total TAVR (black line) and its age- and sex-matched background population (BKG-P, grey line), as assessed (A) for the total post-procedural period, or (B) with a 90-day landmark analysis. Hazard ratios (HR) for late all-cause mortality in the TAVR population as compared to BKG-P with 95% CI and p-value are given. C) & D) The relative contribution of CV and non-CV mortality in (C) early mortality – within 90 days after TAVR, and (D) late mortality – the period following 90 days post TAVR. p-values for the stratified log-rank test are reported. CV: cardiovascular
SURGICAL RISK CLASSIFICATION
Based on the calculated STS mortality risk score, the study population was divided into three groups: a low-risk group (n=177), an IM-risk group (n=352), and a high-risk group (n=88). The HR for late mortality in the TAVR population vs. the background population was 0.98 and 1.11 for the low- and IM-risk groups, respectively (p>0.05) (Figure 2A, Figure 2B). The HR for late mortality in the high-risk TAVR population was 1.90 as compared to its control population (p=0.002) (Figure 2C). Interaction between the STS group and TAVR was evaluated in a Cox regression model with a p-value for interaction <0.001.
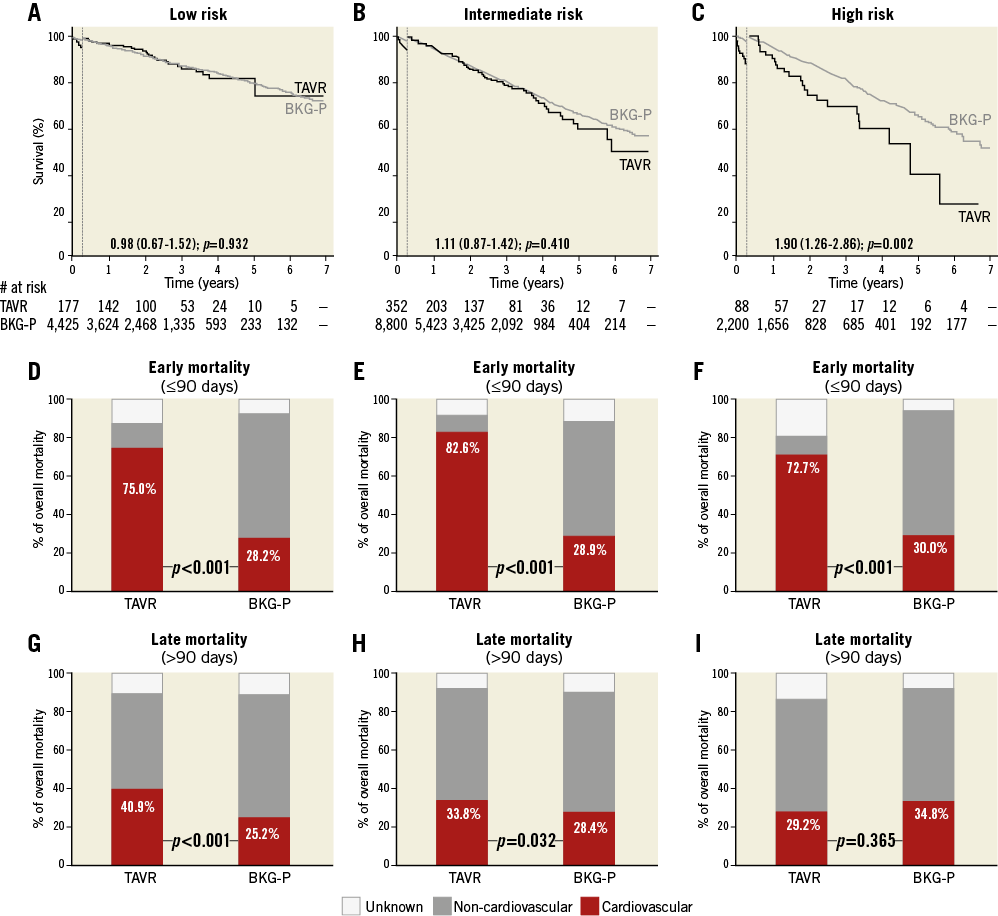
Figure 2. Survival and causes of death in TAVR and background subpopulations according to STS risk classification. A)-C) Kaplan-Meier survival curves for the TAVR population (black line) and its age- and sex-matched background population (BKG-P, grey line) based on a 90-day landmark analysis. Hazard ratios (HR) for late all-cause mortality in the TAVR population as compared to the BKG-P are indicated. D)-F) Relative contribution of CV and non-CV mortality in early mortality (≤90 days) for the TAVR populations and their matched controls. G)-I) Relative contribution of CV and non-CV mortality in late mortality (>90 days) for the TAVR populations and their matched controls; p-values for the stratified log-rank test are reported.
Early mortality was mainly CV in all three TAVR groups (Figure 2D-Figure 2F). Late mortality in the low- and IM-risk TAVR groups was more frequently CV-related as compared to their controls (p<0.05), whereas late mortality in the high-risk group was mainly non-CV and the cause of death not significantly different from its controls (Figure 2G-Figure 2I).
TYPES OF SEVERE AS
Based on echocardiographic parameters, the study population was divided into three groups: an HG (n=448), a P-LFLG (n=75), and a C-LFLG (n=94) group. The HR for late mortality in the TAVR population vs. the background population was 1.04, 1.45, and 1.52 for the HG, P-LFLG and C-LFLG groups, respectively, providing statistical significance (p=0.026) for the C-LFLG group (Figure 3A-Figure 3C, Table 2). Interaction between type of AS and TAVR was evaluated in a Cox regression model with a p-value for interaction=0.014.
Early mortality was mainly CV in all three TAVR groups (Figure 3D-Figure 3F). The relative incidence of late CV mortality was similar for the HG-TAVR and its control population, but was significantly higher for both LFLG groups as compared to their controls (Figure 3G-Figure 3I).
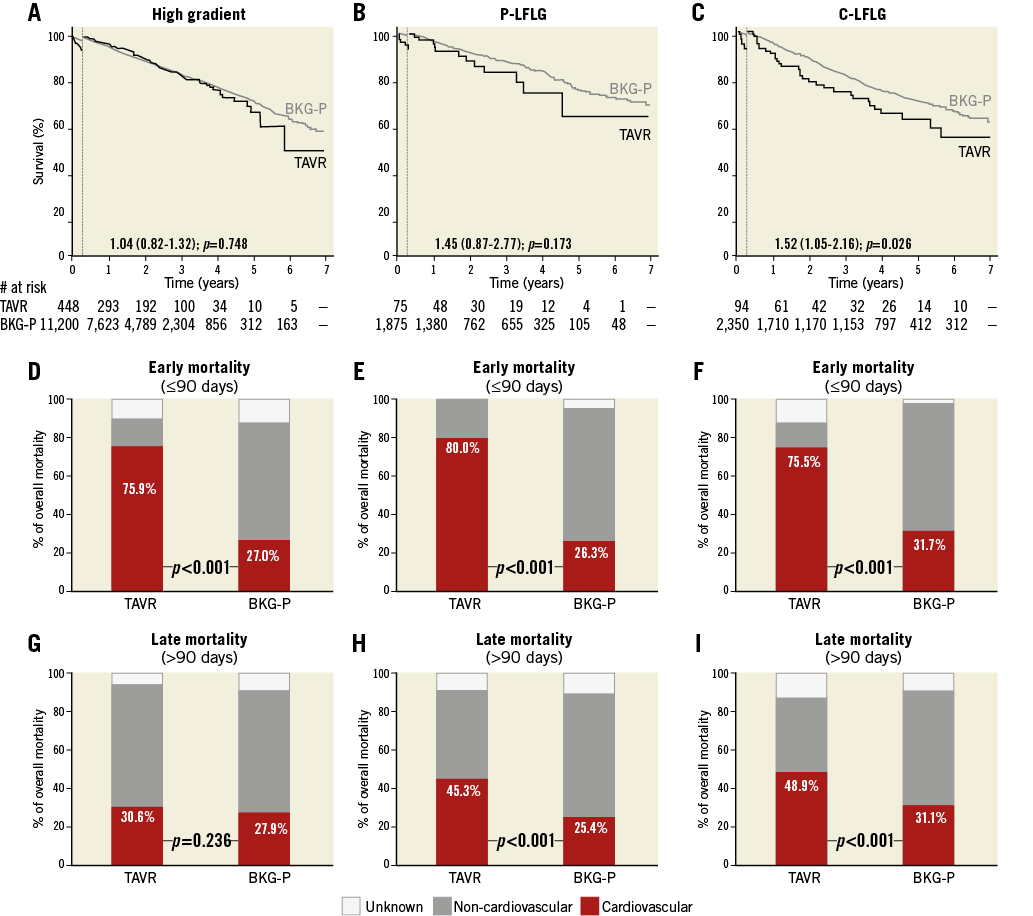
Figure 3. Survival and causes of death in TAVR and background subpopulations according to types of severe AS. A)-C) Kaplan-Meier survival curves for the TAVR population (black line) and its age- and sex-matched background population (BKG-P, grey line) based on a 90-day landmark analysis. Hazard ratios (HR) for late all-cause mortality in the TAVR population as compared to the BKG-P are indicated. D)-F) Relative contribution of CV and non-CV mortality in early mortality (≤90 days) for the TAVR populations and their matched controls. G)-I) Relative contribution of CV and non-CV mortality in late mortality (>90 days) for the TAVR populations and their matched controls; p-values for the stratified log-rank test are reported. C-LFLG: classical low-flow low-gradient; P-LFLG: paradoxical low-flow low-gradient

LOW-TO-INTERMEDIATE RISK PATIENTS WITH HIGH GRADIENT
A total number of 409 low-to-IM risk patients with a preprocedural mean gradient >40 mmHg were identified. When analysing the entire follow-up period without landmark, the HR for late mortality in this TAVR population vs. its matched controls was 1.21 (p=0.041). When excluding the 90-day post-procedural period, survival rates were similar for this TAVR population as compared to its matched control population with an HR of 1.02 (p=0.847) (Figure 4).
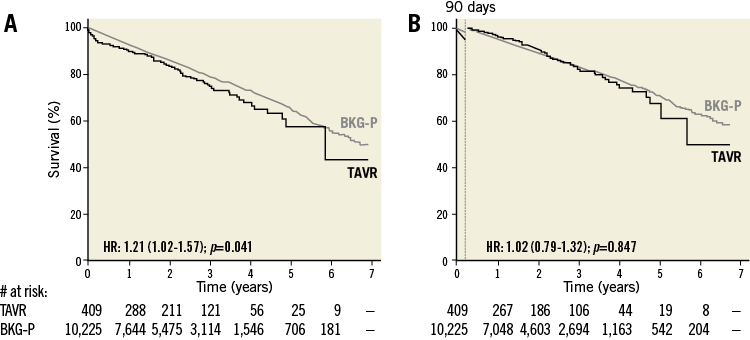
Figure 4. Kaplan-Meier survival curves for the low-to-intermediate risk TAVR population with high transvalvular gradient and its age- and sex-matched background population. A) & B) Kaplan-Meier survival curves for the low-to-intermediate risk TAVR population with high transvalvular gradient (black line) and its age- and sex-matched background population (BKG-P, grey line), as assessed (A) for the total post-procedural period, or (B) with a 90-day landmark analysis. Hazard ratios (HR) for late all-cause mortality in the TAVR population as compared to the BKG-P with 95% CI and p-value are given.
Discussion
This study is the first ever study to describe survival in a TAVR population as compared to an age- and sex-matched background population, randomly selected from the general population. Based on long-term follow-up data (up to seven years) of 617 real-world TAVR patients and 15,425 controls, we conclude that TAVR restores normal life expectancy in low-to-IM risk patients with a high transvalvular gradient. Late mortality (>90 days) is twice as high in high-risk TAVR patients as compared to their age- and sex-matched controls due to non-CV mortality, whereas late mortality is 1.5 times higher in LFLG patients as compared to their controls, mainly due to CV mortality.
As illustrated in Figure 1, overall mortality in the entire TAVR population approximated 10%, 20%, 40% and 50% at, respectively, one, two, five and seven years of follow-up – in other words, half of the TAVR patients survived up to seven years after their procedure. Of course, this Kaplan-Meier survival curve is very dependent on the category of AS patients treated during this time period. Based on the calculated STS risk score (median 4.0%, IQR 2.6%-8.2%), this real-world all-comers TAVR population should mainly be considered a lower-risk population. So far, the only large-scale randomised controlled trials (RCT) investigating the outcomes in IM-risk TAVR patients – as compared to SAVR – are the PARTNER 2 and SURTAVI trials, which also reported mortality rates of approximately 10% and 20% at one and two years of follow-up10,11. As expected, mortality in the TAVR population was significantly higher as compared to its background population (HR 1.43, p<0.001) when analysing the entire follow-up period without landmark. In the 90-day landmark analysis, however, there was no statistically significant difference in late mortality between the TAVR population as compared to the background population (HR 1.16, p=0.126). Similar findings have been reported regarding relative long-term survival after SAVR as compared to matched normal populations. Results in these studies also indicate that, in the first three months after SAVR, patients have a higher mortality than the control population; however, they have a similar chance of survival to the matched normal population in the long term16-19.
In accordance with the large TAVR RCT5-11, periprocedural mortality should mainly (>75%) be ascribed to CV mortality. The fact that CV mortality only accounts for 34.8% of late mortality – a similar rate to that reported for the background population – further indicates that TAVR is a durable treatment option and restores normal life expectancy for a large group of AS patients.
When analysing Kaplan-Meier curves for the different surgical risk groups, it becomes clear that there is a significant difference in mortality – or survival – between the low-to-IM risk groups (HR 0.98 to 1.11; p>0.05) vs. the high-risk group (HR 1.90, p=0.002) as compared to their age- and sex-matched controls. Although the seven-year mortality rate approximated only 30% in the low-risk TAVR group vs. 50% in the IM-risk group, the survival curves run parallel with those of their respective controls. This difference in survival between controls of the low- and IM-risk groups can be explained by the lower (mean) age of the low-risk group as compared to the IM-risk group (76.7 vs. 81.6 years; p<0.001). It is well known that the variable “age” has a large impact on the calculated STS risk score. The calculated HR of 1.90 for the high-risk group indicates that late mortality is approximately twice as high for the high-risk TAVR population as compared to their age- and sex-matched controls, despite TAVR treatment. The five-year mortality rate for the high-risk TAVR population approximated 60%, which is in accordance with previously reported data from the PARTNER A trial20. The fact that late mortality is mainly non-CV indicates that these patients most often succumb to other non-cardiac disorders such as their comorbidities.
Regarding survival outcome for the different AS types, it could be anticipated that AS patients with an LFLG have a worse outcome as compared to those with a high transvalvular gradient, as previously reported21-25. Based on our data, we can conclude that life expectancy can be restored to the same level as their matched controls for AS patients with HG, whereas this is not the case for patients in the LFLG groups. The observation that late mortality in the LFLG groups is more often of CV origin further indicates that treating the AS alone is not sufficient in patients with LFLG AS. Also, optimisation of heart failure medical treatment is an absolute condition. Additional therapeutic/preventive options such as cardiac resynchronisation therapy (CRT)/implantable cardioverter defibrillator (ICD) should be considered in order to improve the quality of life and prognosis of these patients.
Based on the results above, we hypothesised that survival of the low-to-IM risk patients with high transvalvular gradient would be equal to their background population. This hypothesis was confirmed by our analysis as reported in Figure 4, showing that the HR of late mortality in this specific TAVR population was 1.02 as compared to its background population. In other words, we can state that TAVR restores normal life expectancy for AS patients with a low-to-IM risk profile and a preserved high transvalvular gradient.
Limitations
The main limitations of this study include its retrospective, single-centre design and the small sample size for some subgroup analysis. In addition, lower event rates in the low- and IM-risk patients also result in lower statistical power. A certain patient selection bias cannot be avoided, e.g., patients with disseminated cancer will never be considered for TAVR but were not necessarily excluded from the background population. Another potential bias could be that low-to-IM risk patients were very seldom treated in the early days of the TAVR technology. As such, the “TAVR learning curve” could potentially have had a negative impact on the outcomes obtained in the high-risk group. In addition, the (lack of) accuracy of death certificates could be a source of potential misclassification, especially in patients with multiple comorbidities. However, causes of death of all TAVR patients were double-checked in their medical records. A final limitation of this study is the limited number of patients with a follow-up of more than five years. However, most TAVR studies so far only have a one- to two-year follow-up period – especially for the low-to-IM risk group – making this long-term follow-up study an important contribution to the TAVR research field.
Conclusions
Based on the survival analysis of 617 real-world TAVR patients and 15,425 age- and sex-matched controls, we conclude that TAVR restores normal life expectancy in low-to-IM risk patients with a high transvalvular gradient. Late mortality is twice as high in high-risk TAVR patients as compared to their background population due to non-CV mortality, whereas late mortality is 1.5 times higher in LFLG patients as compared to their controls due to CV mortality.
| Impact on daily practice Although TAVR has originally built up its evidence as a valid treatment option in extreme-/high-risk patients with symptomatic severe AS, the largest socio-economic impact and benefit can be expected when treating lower-risk patients with a high transvalvular gradient. Consequently, early diagnosis of severe AS and instant referral to invasive treatment will be essential to improve the patients’ overall outcomes further. |
Acknowledgements
Marie Theut, Julie B. Thygesen, and Ole De Backer had full access to all study data and take responsibility for the integrity of the data and the accuracy of the data analysis. We would also like to thank Jacob Lønborg for his assistance in the statistical analysis.
Conflict of interest statement
L. Søndergaard is a consultant and has received research grants from St. Jude Medical, Boston Scientific, and Medtronic. The other authors have no conflicts of interest to declare.
