Bifurcation lesions remain a notoriously challenging proposition for the interventional cardiologist. Simple strategies have emerged as the general treatment of choice for several reasons but, to date, the interventional strategy often focuses only on the bifurcation in question. We demonstrate concepts arising from computational fluid dynamic (CFD) analysis that may question this approach.
Angiographic images were used to reconstruct a 3D phantom model of serial bifurcation lesions. Pulsatile CFD studies demonstrate several localised areas of flow recirculation in the healthy-appearing arterial segment between the bifurcations, causing broad exposure to physiologically significant low wall shear stress (WSS) (Figure 1A-1C, Moving image 1).
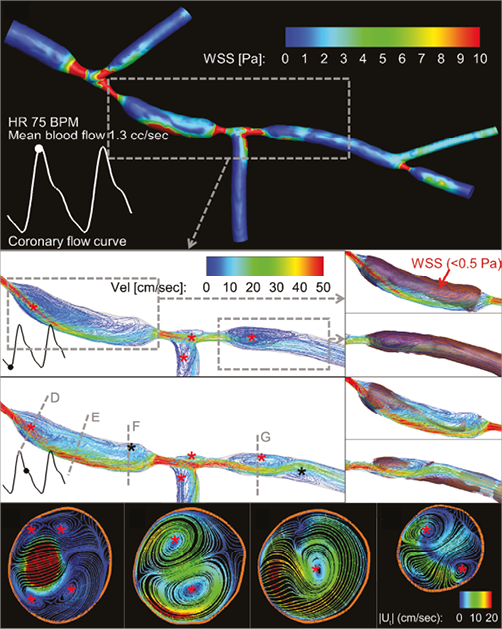
Figure 1. Three-dimensional pulsatile blood flow in a patient-specific phantom model and CFD analyses on the pathogenic low wall shear stress (WSS). A) Baseline CFD analysis of WSS distribution (coloured contours) in a patient-specific phantom model at peak diastole, as represented in the coronary flow curve. Chaotic WSS pattern represents flow disturbance distal to stenotic vessel area. B) & C) Three-dimensional streamlines distal to the proximal and middle bifurcation lesions. Severe stenoses and large side branch angles significantly disturb coronary blood flow and create large flow reversal and recirculation regions distal to the lesions (red asterisks) throughout a cardiac cycle. With increased blood flow during the diastole (C), two smaller recirculation regions (black asterisks) are formed proximal and distal to the middle lesion. These recirculation regions are almost exclusively responsible for the large areas exposed to pathogenic low WSS (<0.5 Pa, shaded patches) in the healthy vessel segments (B and C, right side insets). D), E), F) & G) Two-dimensional projected streamlines (tangential to the blood flow direction) coloured by tangential velocities magnitude, |Ut|, at selected cross-sections (dashed lines in panel C) during the diastole. Flow recirculation regions (red asterisks) in the tangential direction demonstrate the presence of secondary flow (i.e., coronary blood flow which follows a helical course in the longitudinal direction). Distal to the stenotic vessel areas, these secondary flow recirculation regions are small but intense (D & G). In the middle of the healthy segment (E), flow becomes less chaotic, and eventually these secondary recirculation regions combine into a single recirculation region proximal to the middle lesion (F).
The pathogenic nature of flow reversal (Figure 1B, Figure 1C, Moving image 2) and secondary flow (Figure 1D-1G, Moving image 2) seen in our analysis may accelerate atherosclerosis in the healthy-appearing region between two untreated diseased bifurcations1,2. The large region exposed to low WSS (Figure 1B, Figure 1C, Moving image 1) may even contribute to the development of diffuse disease as plaque enlarges distally and becomes confluent with the diseased second bifurcation1-3. After bifurcation stenting, angiographically or even functionally insignificant downstream lesions may cause atherogenic haemodynamic recirculation affecting the upstream stented region. This may be one mechanism to explain consistently poor outcomes after bifurcation stenting.
This research suggests: 1) distal vessel geometry may be as important as the bifurcation lesion itself; 2) a possible, and admittedly controversial, role of assessing and potentially treating certain downstream lesions more aggressively. Further study is necessary to elucidate the clinical significance and optimal treatment of these observations.
Guest Editor
This paper was guest edited by Gerald Finet, MD, PhD; Department of Cardiology and Interventional Cardiology, Cardiovascular Hospital Louis Pradel, Claude Bernard University, Lyon, France.
Funding
The authors would like to acknowledge the support of the Australian Research Council for this research through ARC Linkage Project LP120100233. This research was also supported by a Victorian Life Sciences Computation Initiative (VLSCI) grant number [VR0210] on its Peak Computing Facility at the University of Melbourne, an initiative of the Victorian Government, Australia.
Computational fluid dynamic analysis in a population-based phantom model
PHANTOM MODEL
Six plexiglass phantoms, each of them mimicking a vessel with three successive bifurcations (18 bifurcations in total), were designed in 3D and manufactured with a tolerance <10 μm4. These population-based phantom models were initially developed to validate dedicated bifurcation quantitative coronary angiography (QCA) analysis software4-9. Every individual bifurcation had a lesion, wherein at least one vessel segment had a %DS of >60%. The bifurcation lesion characteristics of the 18 bifurcations were derived from relevant literature. The following factors were taken into account: frequency of occurrence of the Medina class; reference diameter (taking into account the fractal geometry described by Finet’s law), minimal lumen diameters (MLD), MLD location (within 3-6 mm from the point of bifurcation); lesion length and shape; and lesion angulation4.
3D SURFACE GEOMETRY RECONSTRUCTION
Angiographic images were acquired by Axiom Artis™ (Siemens, Forchheim, Germany). Two projections with ≥25° difference in acquisition angles were used to reconstruct the 3D surface geometry. The main vessel and all side branches were separately reconstructed by a validated 3D QCA software package (QAngio XA 3D RE 1.1; Medis Specials bv, Leiden, The Netherlands)10. The reconstructions were further merged into a tree structure11. The merged surface geometry was exported into STL format for subsequent CFD analysis.
CFD METHODOLOGY
The reconstructed 3D surface geometry of the population-based phantom model was imported into ICEM-CFD (ANSYS Inc., Canonsburg, PA, USA) for computational fluid dynamic (CFD) volume mesh generation. The CFD volume mesh consists of approximately five million cell elements. Six prism layers were created near the arterial wall in order to capture the important boundary layer characteristics. The haemodynamics (blood flow and pressure) were computed by directly solving the 3D incompressible Navier-Stokes equations in finite-volume formulations using OpenFOAM (OpenCFD Ltd.). Blood was assumed to be Newtonian with a density of 1,000 kg/m3 and a dynamics viscosity of 0.0025 Pa·s12. The assumption that blood behaves as a Newtonian fluid represents one of the limitations of current CFD studies, and its effect on the outcomes of CFD analyses requires further investigation. A time-dependent parabolic velocity profile was prescribed at the proximal end of the phantom model. Physiological waveform from the LCX was chosen13. It was reconstructed using Fast Fourier Transform with the first four Fourier coefficients. Blood flow was considered 1.3 cc/sec and heart rate 75 bpm (corresponds to an inflow Reynolds number of 138 and Womersley number of 4.25). No-slip and no-penetration boundary conditions were applied to the rigid arterial wall. At the distal ends of the phantom arterial tree, three-element Windkessel models were employed to mimic the vasculature resistance14. CFD studies were performed using high performance supercomputing facilities at the Victorian Life Science Computational Initiative with each case utilising 512 IBM Blue Gene/Q CPUs @ 1.6 GHz. Wall shear stress (WSS) was calculated from the surface traction vector at baseline. Results were presented using Tecplot360 2013R1 (Tecplot Inc., Bellevue, WA, USA).
Conflict of interest statement
S. Tu had an employment contract with Medis medical imaging systems bv until June 2014; currently Shanghai Jiao Tong University receives institutional grant support on his behalf from Medis. The other authors have no conflicts of interest to declare. The Guest Editor has no conflicts of interest to declare.
Online data supplement
Moving image 1. WSS colour map of a population-based phantom model from baseline CFD analysis. Highlighted areas distal to the proximal and middle bifurcation lesions indicate pathogenic low WSS (<0.5 Pa) throughout a cardiac cycle.
Moving image 2. Three-dimensional streamlines clearly demonstrate the occurrences of flow reversal distal to the proximal and middle bifurcation lesions in a cardiac cycle. The presence of secondary flow in these segments is shown using two-dimensional projected streamlines at selected locations.
Supplementary data
To read the full content of this article, please download the PDF.
Moving image 1. WSS colour map of a population-based phantom model from baseline CFD analysis. Highlighted areas distal to the proximal and middle bifurcation lesions indicate pathogenic low WSS (<0.5 Pa) throughout a cardiac cycle.
Moving image 2. Three-dimensional streamlines clearly demonstrate the occurrences of flow reversal distal to the proximal and middle bifurcation lesions in a cardiac cycle. The presence of secondary flow in these segments is shown using two-dimensional projected streamlines at selected locations.