Abstract
Aims: Bioresorbable vascular scaffolds (BVS) present different mechanical properties as compared to metallic platform stents. Therefore, the standard procedural technique to achieve appropriate deployment may differ.
Methods and results: Fifty-two lesions treated with a 3x18 mm BVS were imaged with optical coherence tomography (OCT) post-implantation and screened for parameters suggesting non-optimal deployment. These included minimal scaffold area (minSA)<5 mm2, residual area stenosis (RAS)>20%, edge dissections, incomplete scaffold/strut apposition (ISA)>5% and scaffold pattern irregularities. The angiographic proximal and distal maximal lumen diameters (DMAX) were measured by quantitative coronary angiography. Based on the DMAX values, the population was divided into three groups: DMAX <2.5 mm (n=13), DMAX between 2.5-3.3 mm (n=30) and DMAX >3.3 mm (n=9). All three groups presented with similar pre-implantation angiographic characteristics except for the vessel size and were treated with similar balloon/artery ratios. The group with a DMAX <2.5 mm presented with a higher percentage of lesions with minSA <5 mm2 (30.8% vs. 10.0% vs. 0%; p=0.08) and edge dissections (61.5% vs. 33.3% vs. 11.1%; p=0.05). Lesions with >5% of ISA were significantly higher in the group with DMAX >3.3 mm (7.7% vs. 36.7% vs. 66.7%; p=0.02). RAS >20% was similar between all groups (46.2 vs. 53.3 vs. 77.8%; p=0.47) and scaffold pattern irregularities were only documented in three cases.
Conclusions: BVS implantation guided with quantitative angiography may improve the OCT findings of optimal deployment. The clinical significance of these angiographic and OCT findings warranted long term follow-up of larger cohort of patients.
Abbreviations
BVS: bioresorbable vascular scaffold
DMAX: quantitative angiographic maximal lumen diameter
DS: diameter stenosis
IVUS: intravascular ultrasound
ISA: incomplete scaffold/strut apposition
MLD: minimal lumen diameter
minSA: minimal scaffold area
OCT: optical coherence tomography
QCA: quantitative coronary angiography
RAS: residual area stenosis
RVA: reference vessel area
RVD: reference vessel diameter
Introduction
Everolimus-eluting bioresorbable vascular scaffolds (BVS) are a promising new generation of intravascular devices that may potentially circumvent many of the drawbacks of permanently implanted metallic coronary stents1,2. The mechanical properties of the polymeric platforms undoubtedly differ from the features of metallic platform stents and should be taken into account during the procedure for appropriate deployment of the BVS. Previous studies using intravascular ultrasound (IVUS)-guided percutaneous coronary intervention (PCI) reported that the presence of minimal scaffold area (minSA) <5 mm2, residual area stenosis >20%, edge dissections, incomplete scaffold/strut apposition (ISA) and scaffold pattern disruptions have an impact on the short and long-term outcomes3-8. Optical coherence tomography (OCT) is a high resolution imaging technique that allows more accurate assessment of these parameters as compared to IVUS9, although the prognostic value of these refined observations measured or documented by OCT are so far unknown.
The ABSORB cohort B study used a single size BVS (3x18 mm). The study protocol did not allow the inclusion of patients with an interpolated reference diameter (RVD) <2.5 mm or >3.3 mm, although it was not mandatory to perform quantitative coronary angiography (QCA) prior to the implantation. The interpolated-RVD, as indicated by its name, is the virtual reference diameter measured at the site of the minimal lumen diameter (MLD) prior to the implantation. The interpolated-RVD can differ from any reference diameter arbitrary selected and measured in the segment located either proximal or distal to the MLD10. Amongst the multiple values of reference diameters measured in the proximal or distal segments to the MLD, the DMAX values (proximal or distal) represented the two single largest values of reference diameters observed in the segments proximal or distal to the lesions (Figure 1).
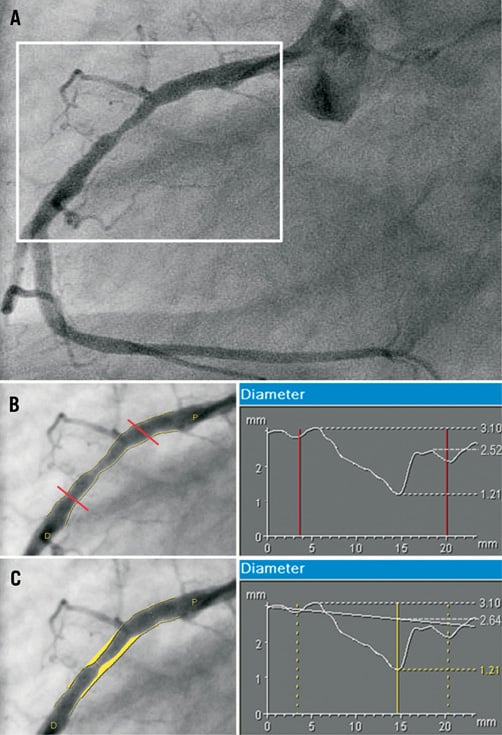
Figure 1. Assessment of the DMAX and interpolated-RVD values. Panel A shows a lesion in the mid right coronary artery at pre-treatment. The length of the region “to be scaffolded” is super-imposed on the pre-treatment angiogram (Panels B and C) with the corresponding diameter function obtained with quantitative coronary angiography. Image B shows the DMAX assessment. The three non-ambiguous points of the diameter function are: the proximal DMAX (3.10 mm), the MLD (1.21 mm) and the distal DMAX (2.52 mm). Panel C shows the interpolated-RVD assessment. According to the diameter function of the proximal and distal segments to the BVS edges an interpolated diameter line is generated. The “predicted” diameter at the site of the MLD (2.64 mm) defines the interpolated-RVD. DMAX: maximal lumen diameter; MLD: minimal lumen diameter; RVD: reference vessel diameter.
The aim of this study is to describe the angiographic DMAX prior to BVS implantation and to relate these angiographic measurements to the OCT criteria of appropriate BVS deployment. In addition, we report the inappropriate adverse events at medium term follow-up of 180 days potentially associated with the non-respect of the angiographic exclusion criteria and the consequent impact on scaffold deployment as documented by OCT.
Material and methods
Study design and population
The ABSORB Cohort B trial was a non-randomised, multicentre, single arm, efficacy-safety study that included 101 patients with 102 lesions treated with BVS. All the implanted devices were 3.0 mm in diameter and 18 mm in length. OCT imaging was an optional investigation performed in selected participating centres. The study design of the ABSORB Cohort B is available at clinicaltrials.gov (NCT00856856). In brief, the common inclusion criteria were patients aged 18 years or older, with a diagnosis of stable, unstable or silent ischaemia, which presented with a de novo stenosis in a native coronary artery. Exclusion criteria included patients with stenosis of an unprotected left main or ostial right coronary artery (RCA), presence of intracoronary thrombus or heavy calcification.
The present study is a post hoc analysis of the subset of patients included in the ABSORB Cohort B trial who had optical coherence tomography (OCT) imaging performed post-BVS implantation. The population included in the present study was divided in three groups based on the proximal and distal DMAX prior to the BVS implantation: group 1 included those patients with proximal or distal DMAX <2.5 mm; group 2 included those patients with proximal and distal DMAX between 2.5-3.3 mm; group 3 included those patients with proximal or distal DMAX >3.3 mm.
Bioresorbable vascular scaffold
The BVS 1.1 revision (Abbott Vascular, Santa Clara, CA, USA) is a balloon expandable device, consisting of a polymer backbone of Poly-L lactide (PLLA) coated with a thin layer of a 1:1 mixture of an amorphous matrix of Poly-D, L lactide (PDLLA) polymer containing 100 micrograms/cm2 of the antiproliferative drug everolimus. The implant is radiolucent, but has two platinum markers at each edge, that allow visualisation on angiography and other imaging modalities. Physically, the scaffold has struts with an approximate thickness of 150 μm arranged in-phase zigzag hoops linked together by three longitudinal bridges.
Treatment procedure
Lesions were treated with routine interventional techniques that included mandatory pre-dilation. The operator was requested to select an angiographic view with minimal foreshortening of the lesion and limited overlap with other vessels. This view was used for all phases of the treatment, including the inflation of the delivery system balloon or the post-dilation balloons at the highest pressures. The study protocol forbade the use of pre-dilation balloons longer than the pre-specified length of the device. According to the protocol, the BVS had to be implanted at a pressure not exceeding the rated burst pressure (16 atmospheres) corresponding to a predicted diameter of 3.3 mm as per the manufacturer’s chart. Post-dilatation with a balloon shorter than the implanted device and a maximum diameter of 3.25 mm was allowed at the operator’s discretion, as was post-dilatation balloon size, use of non-compliant balloons or bailout treatment. During the BVS implantation or the post-dilatation with other balloons, the highest inflated pressure of the largest balloon was used to calculate the “predicted device diameter” according to the manufacturer’s BVS or post-dilatation balloon charts, which describes the theoretical diameter of the BVS achieved at the end of the procedure.
Quantitative coronary angiography analysis
The 2D angiograms were stored in DICOM format and analysed by the core lab (Cardialysis, Rotterdam, The Netherlands) using the CASS II analysis system (Pie Medical BV, Maastricht, The Netherlands). In each patient, the treated region and the peri-treated regions (defined by a length of 5 mm proximal and distal to the device edge) were analysed. The following QCA analysis parameters were computed: MLD, interpolated-RVD and percentage of diameter stenosis (DS). The DMAX was measured as previously described (Figure 1).
During the BVS implantation or post-dilation with other balloons, the highest inflated pressure of the largest balloon was quantitatively measured as the ‘mean inflated-balloon diameter’. Balloon / artery ratio (B:A ratio) was estimated as: (mean inflated-balloon diameter/interpolated-RVD).
Optical coherence tomography acquisition
OCT imaging was performed using two different OCT systems (M3 Time-Domain System and C7XR Fourier-Domain System; LightLab Imaging, Westford, MA, USA) with the non-occlusive technique. The imaging was performed after the last dilatation and after a nitroglycerine infusion. The acquisition method of both systems has been previously described11.
Optical coherence tomography analysis
Offline quantitative and qualitative OCT data analysis was carried out by the core laboratory (Cardialysis BV, Rotterdam, The Netherlands) with proprietary software for offline analysis (LightLab Imaging, Westford, MA, USA). Adjusting for the pullback speed, the analysis of contiguous cross-sections was performed at each 1 mm longitudinal intervals within the treated segment. The BVS demonstrated important differences as compared to metallic stents when imaged by OCT1. The optically translucent polymeric struts did not shadow the vessel wall thereby allowing complete imaging of the struts and the lumen vessel wall contours.
Qualitative assessments of strut apposition, scaffold pattern continuity and edge dissections could therefore easily be performed (Figure 2). Incomplete strut apposition (ISA) was diagnosed when the back-side of the polymeric strut was separated from the vessel wall. The scaffold pattern was assessed for irregularities such as two struts overhanging each other in the same angular sector of the lumen perimeter, with or without malapposition, or for isolated struts located more or less at the centre of the vessel without obvious connection to the expected adjacent strut pattern12. An endoluminal flap at the BVS edge was reported as an edge dissection.
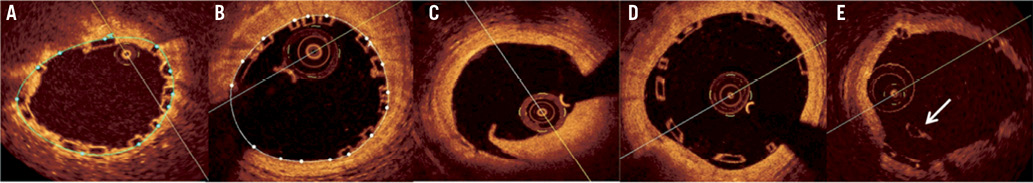
Figure 2. Optical coherence tomography optimal deployment criteria. A) Minimal scaffold area <5 mm2. This picture shows a scaffold area (blue line) of 4.2 mm2 in (minimum scaffold area of the BVS); B) Residual area stenosis >20%. This patient presents a minimal scaffold area of 5.7 mm2 (white line) and a reference vessel area of 7.9 mm2. The estimated residual area stenosis is 27.8%; C) Edge dissection distally to the BVS; D) Incomplete scaffold/strut apposition; E) Scaffold pattern irregularity with an overhanging strut (arrow) at the centre of the vessel without obvious connection to the expected/adjacent strut pattern.
Quantitative assessment of the scaffold area was measured at the back-side of the apposed struts. In the case of two consecutive frames with ISA, the area between the lumen and the scaffold was measured as the ISA area. Reference vessel area (RVA) was estimated as the mean between the two largest luminal areas in the outer 5 mm proximal and distal segments to the edges of the BVS11. In the cases of absence of any of the proximal or distal segments due to ostial lesions or the presence of near side branches the opposite segment was instead used as the RVA. Residual area stenosis (RAS) was calculated as: (1-[minSA / RVA])×100.
The corelab reproducibility for ISA, scaffold area and edge dissection assessment has been previously reported and showed an excellent inter and intra-observer agreement using OCT13. The detection of scaffold pattern irregularities was performed by two experienced analysts who analysed qualitatively the full length of the device in all the frames.
Non-optimal deployment endpoints
Non-optimal deployment endpoints were: presence of minSA <5 mm2, presence of RAS >20%, presence of edge dissections as assessed by OCT, presence of ISA per scaffold >5% and presence of any scaffold pattern irregularities3-8.
Statistical analysis
The Kolmogorov-Smirnov test was used to evaluate the normality assumptions of all continuous variables. Continuous variables were expressed as a mean ± standard deviation and categorical variables were presented as counts (%). Comparisons of continuous variables at lesion level and frame level analysis were estimated with the non-parametric Mann-Whitney test when comparing two groups or Kruskall-Wallis test when comparing three groups. Categorical variables were compared with the chi-square test. All measurements were obtained by SPSS 15 software version (SPSS Inc, Chicago IL, USA).
Results
Population
A total of 54 out of the 101 lesions included in the ABSORB cohort B trial were imaged by OCT after BVS deployment in 53 patients. Two of the pullbacks were not included because lack of visualisation of the full length and size of the device. Finally, 52 lesions in 51 patients are therefore reported in this study. A C7 OCT system was used in 36 lesions (69.2%) and a M3 system in 16 (30.8%). According to the baseline DMAX, either proximal or distal, 13 lesions were included in group 1 (DMAX <2.5 mm), 30 in group 2 (DMAX between 2.5 and 3.3 mm) and nine lesions in group 3 (DMAX >3.3 mm). The interpolated-RVD, the proximal and distal DMAX distribution values are shown in Figure 3.
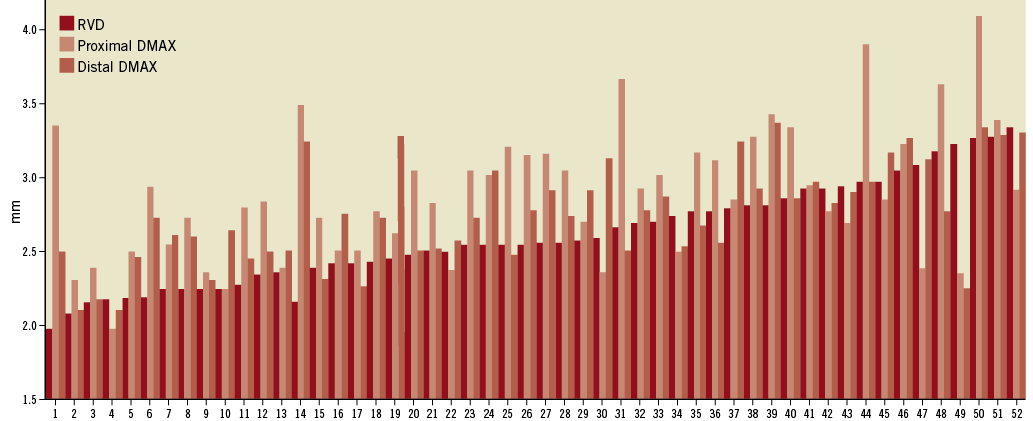
Figure 3. Distribution of the interpolated-reference vessel diameter and the proximal and distal DMAX in the global population.
Baseline clinical, angiographic and procedural characteristics
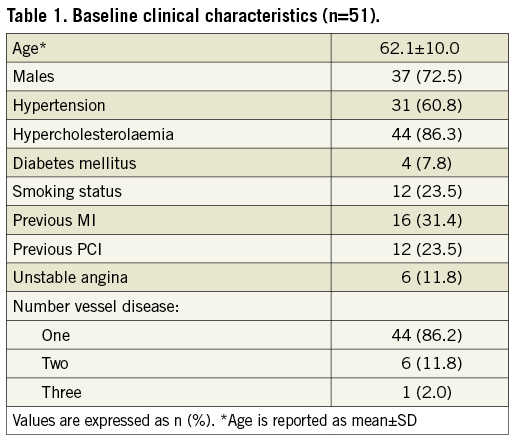
Baseline clinical characteristics are shown in Table 1. Briefly, 37 patients (72.5%) were males, mean age was 62.1±10.0 years, 88.2% of patients presented with stable angina as an indication for the procedure and only seven patients (13.8%) had more than single vessel disease.
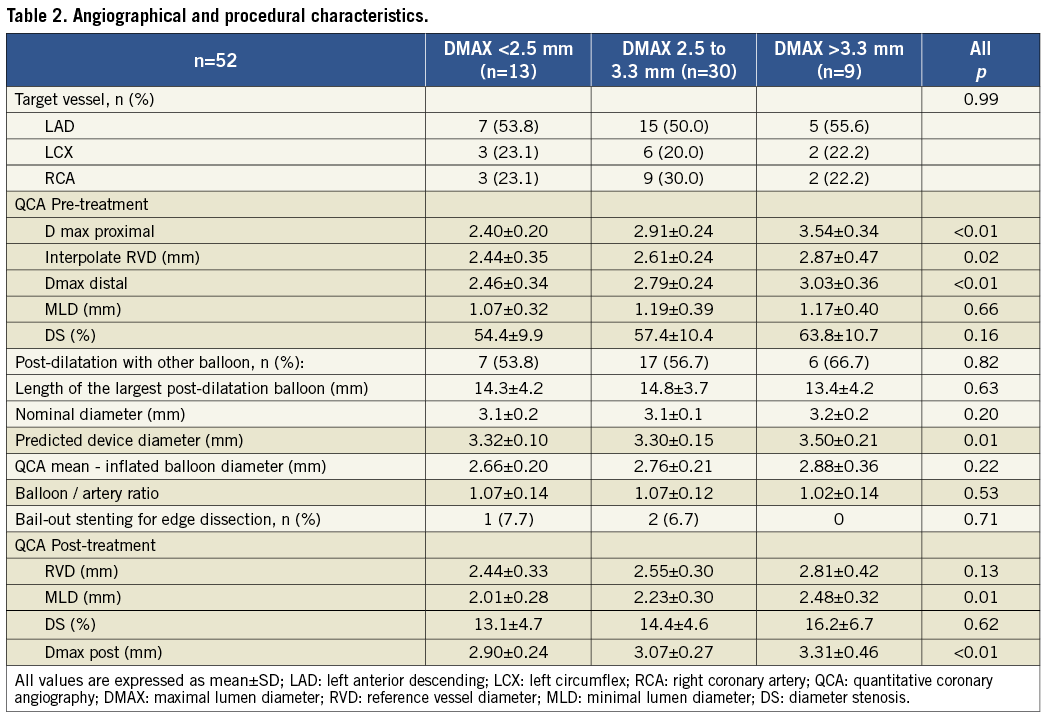
Angiographic and procedural characteristics are summarised in Table 2. The treated vessel was similar between all groups. Prior to BVS implantation, the interpolated-RVD value rose incrementally according to the DMAX subgroups (2.44 mm vs. 2.61 mm vs. 2.87 mm; p=0.02). The use of post-dilatation with other balloons was similar in all groups (53.8% vs. 56.7% vs. 66.7%; p=0.82) with no differences in balloon length or nominal sizes. However, the mean balloon-inflated diameter of the largest balloon inflated at highest pressure tend to be larger in group 3 (2.66 mm vs. 2.76 mm vs. 2.88 mm; p=0.22). The balloon/artery ratios were similar in all groups (1.07 vs. 1.07 vs. 1.02; p=0.53). Quantitative analysis of the final result showed larger MLD, interpolated-RVD and DMAX in group 3.
Optical coherence tomography findings
OCT findings are summarised in Table 3. A total of 1,001 frames and 8,634 struts were analysed. The lumen area, scaffold area, RVA, minSA and RAS were increasingly larger amongst the three subgroups.
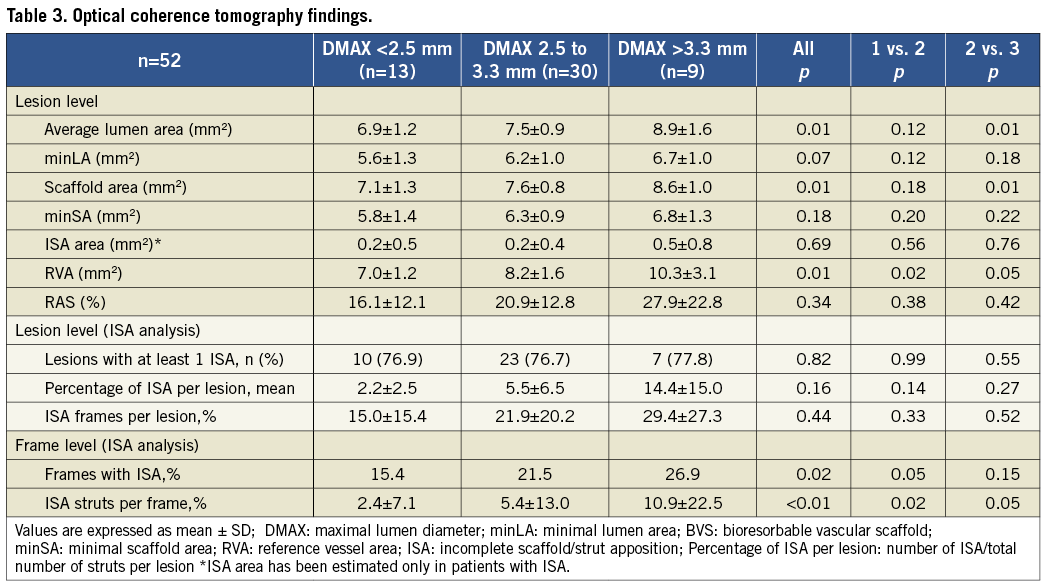
ISA analysis at lesion level showed a slight trend towards higher percentages of ISA struts in groups 2 and 3 (2.2% vs. 5.5% vs. 14.4%; p=0.16). At frame level analysis, the percentage of frames with malapposed struts was significantly higher in group 3 (15.4% vs. 21.5% vs. 26.9%; p=0.02) and the percentage of ISA struts per frame was significantly higher in group 3 (2.4% vs. 5.4% vs. 10.9%; p<0.01).
Non-optimal deployment endpoints
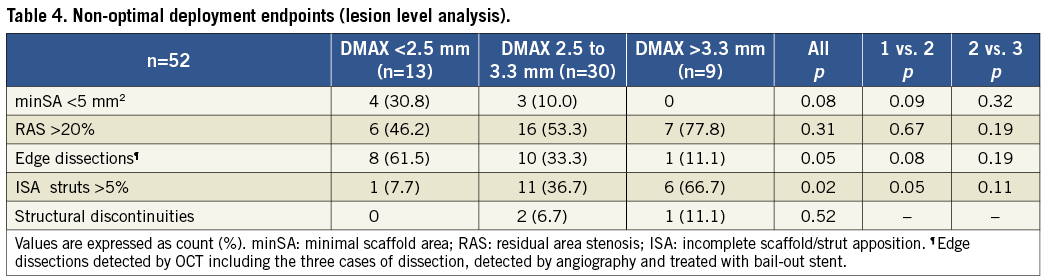
Non-optimal deployment endpoints are showed in Table 4. Lesions with minSA<5 mm2 were more frequent in group 1 (30.8% vs. 10.0% vs. 0%; p=0.08). Edge dissections as assessed by OCT were more frequently observed in group 1 (61.5% vs. 33.3% vs. 11.1%; p=0.05). Lesions with >5% of ISA struts were found in greater percentage in group 3 (7.7% vs. 36.7% vs. 66.7%; p=0.02). Lesions with RAS >20% were not related with DMAX and scaffold pattern irregularities were only documented in three cases at baseline.
Discussion
The main findings of our study are: 1) DMAX measured prior to the implantation has some bearing on the appropriate deployment of the BVS as assessed by OCT criteria; 2) Lesions with DMAX <2.5 mm showed a trend toward higher incidence of minSA <5 mm2 and presented with higher rates of edge dissections; 3) Lesions with DMAX >3.3 mm presented with a higher incidence of malapposed struts.
The assessment of the lumen size using QCA has been extensively used since the beginning of the interventional cardiology field. There are different methods to assess the lumen size taking into account different regions of the vessel10. The interpolated-RVD predicts the “expected lumen diameter” at the site of the MLD taking as a reference the proximal and distal segments to the stenotic region. However, the interpolated-RVD does not assume the actual lumen dimensions of the predicted “landing zone” and is highly influenced by proximal or distal side branches not included in the scaffolded segment. The Dmax estimation is an interactive measurement that helps the investigator to select the appropriate “landing zone”, especially in the setting of a single size device study (Figure 1). Figure 3 shows that in the majority of occasions the interpolated-RVD underestimated the maximal lumen diameter within the scaffolded region.
Since there are no widely accepted OCT criteria for optimal stent deployment, our OCT endpoints have been directly inferred from the IVUS criteria previously used for the evaluation of metallic platform stents. IVUS criteria of non-optimal deployment have been validated with 1-year clinical outcomes as previously described in the literature5-9.
Minimal scaffold area: Baseline minSA<5 mm2 imaged after the implantation of sirolimus-eluting stents resulted on average in a minSA <4 mm2 at eight months follow-up as assessed by IVUS6; this threshold has been associated with adverse events, especially with restenosis14,15. In our study, seven lesions (13.5%) did not achieve a minSA ≥5 mm2 at the end of the procedure and one of them (1.9%) presented with a minSA <4 mm2. These percentages are similar to those reported for metallic platform stents (29% had minimal stent area <5 mm2 and 4% had <4 mm2)15. However, in our series, none of those patients presented with clinical events in the first 180 days.
Residual area stenosis: IVUS studies measured the RAS as the expansion index (minimal stent area/reference vessel area)5,15. In the setting of metallic platform stents, which do not suffer from acute or late recoil, this index reflects the grade of the device expansion at the site of the minimum area with respect to the normal vessel area. This value is commonly higher than one when the final procedure result shows the typical angiographic image of “step-up/ step-down”. An expansion index below 0.80 (that corresponds to a RAS >20%) was previously related with acute/subacute stent thrombosis3,5. In these studies, the mean expansion index and the rate of patients with a RAS >20% at the end of the procedure in the group of patients without adverse events were 0.85 and 23%, respectively3,5. In our study, the mean expansion index was 0.79 (RAS=21%), but 29 patients (56%) presented with a residual area stenosis ≥20%, independently from the DMAX subgroups. We hypothesise that this slightly higher incidence of underexpansion compared to the metallic stents is the result of weaker radial forces of the BVS as compared to metallic stents16. However, this moderate level of under-expansion does not seem to have any acute or subacute thrombosis as well as restenosis implications in these patients.
Edge dissections: Non-treated edge dissections, as assessed by IVUS, is a controvert topic in the current literature. Nishida et al did not find different acute clinical outcomes in 97 patients with edge dissection compared to 100 patients without IVUS-detected edge dissections17. On the other hand, Cheneau et al demonstrated that non-obstructive edge dissections were related to subacute stent thromboses5. The incidence of edge dissection reported in these studies was around 9.2%17,18. Since the resolution of OCT is 10 times higher than IVUS, OCT has better accuracy in detecting edge dissections9; and indeed, the reported incidence of edge dissections higher (25-40%)19,20. Our study found 19 edge dissections (36.5%) with only one patient (5.3%) presenting with an adverse event (periprocedural myocardial infarction). This patient belonged to the group with DMAX <2.5 mm and presented with an angiographically-detected dissection that caused slow-flow and required bail-out treatment with a metallic stent. Apparently, the higher rate of edge dissections in group 1 was not related with the balloon/artery ratio, which was very similar in the three groups. (1.07 vs. 1.07 vs. 1.02; p=0.53). However, the predicted device diameter achieved at the end of the procedure as assessed by the manufacture’s chart was similar between groups 1 and 2, showing that the group with DMAX <2.5 mm was treated more aggressively according to the reference vessel size. A correct assessment of the vessel size prior to the BVS implantation can potentially discourage the operator from performing additional aggressive post-dilatation in under-sized vessels, possibly avoiding edge dissection in these undersized vessels. Nevertheless, there is little information regarding the clinical implications of OCT-detected dissections. Two reports even failed to relate these findings to acute clinical events19,20.
Incomplete scaffold/strut apposition: Despite angiographic and IVUS-guided PCI procedures, acute ISA as assessed by IVUS is still common following the deployment of metallic platform stents. In elective patients, IVUS-studies have reported rates of stents with at least one ISA ranging between 2.6 to 11.6%8,21; and more than 30% in patients with ST-elevation myocardial infarction22. OCT imaging has a considerably higher resolution and sensitivity in detecting ISA as compared to IVUS and therefore, detects higher rates of malapposed struts9. Translucency of the BVS struts enhances this detection capability. Recent OCT studies have reported a percentage of lesions with at least one ISA of 88% and a percentage of malapposed struts between 4.5 to 9.1%23,24. Our study reports 39 lesions (75.0%) with at least one malapposed strut and a mean percentage of ISA of 6.2%.
The clinical impact of acute ISA is not completely understood, considering the small rate of adverse events observed with drug-eluting stents. IVUS studies with baseline and 6 month follow-up imaging showed that the presence of post-procedural and follow-up ISA were not related to death, myocardial infarction, target vessel revascularisation or stent thrombosis21,25. Nevertheless, around 40-70% of the acute ISA persisted at follow-up25. The presence of late ISA has been clearly related with a delay in or lack of neointimal coverage at follow-up26; and patients who had sustained late or very late stent thromboses presented with higher rates of ISA and a lack of neointimal coverage27,28. In our study, two out of four patients with adverse events in the firsts 180 days presented with ISA >5% after the deployment. In one patient the ISA was related to significant disruption of the scaffold at deployment. At day 33, the patient presented with chest pain with documented exercise induced ischaemia. Although angiographically patent, the patient underwent target lesion revascularisation. A second patient suffered a periprocedural acute myocardial infarction due to the occlusion of a diagonal branch.
Due to the high rate of lesions with at least one ISA imaged by OCT, the same IVUS criteria to define optimal deployment cannot be applied to OCT. Therefore, we defined a 5% of malapposed struts in each device as one of the criteria of non-optimal BVS deployment. This value is arbitrary but corresponds to the highest tertile of our population with malapposed struts and has been reported in previous studies as a widely accepted cut-off29.
Scaffold pattern irregularities: Metallic stent fractures have been related to metal fatigue, mostly detected at follow-up. Stent fractures were more frequently found in overlapping stents, hinging points, angulated vessels and with some specific types of drug-eluting stents30,31. Moreover, stent fractures were also related with adverse events, especially with target lesion revascularisation32. The incidence of stent fracture ranged from 1.3% to 28.8%, and it depended on the used imaging technique30,33.
In our study, BVS pattern irregularities were observed with OCT at baseline. These irregularities ranged from local overhanging single struts shifted out of their expected pattern position during deployment, to complete pattern disruptions possibly involving structural discontinuities. We report three cases of scaffold pattern irregularities at baseline (5.8%). All of them were associated with the use of post-dilatation balloons that over-stretched the polymeric device beyond 3.3 mm (as assessed by the balloons charts). Post-dilatation with other balloons was needed in two cases due to a sub-optimal residual stenosis after the BVS deployment and in one case because of the presence of severe ISA as assessed by OCT. The last one was observed in a patient with a DMAX >3.3 mm and required target lesion revascularisation after 33 days.
Clinical outcomes: A total of four out of 51 patients (7.8%) included in the present study had an adverse cardiac event at follow-up in the first 180 days after the procedure. Two patients presented with adverse events not related to mismatch of the vessel/device size: one patient suffered a periprocedural myocardial infarction without further complications due to the occlusion of a small side branch and the other patient presented a myocardial infarction during an unscheduled angiogram not related with the device. The adverse event of the first patient with vessel / device mismatch was caused by a periprocedural myocardial infarction during the BVS implantation (the troponin value raised 2.5 times after the procedure without any further complications). The patient presented with a mild lesion (DS 52%) of a small second marginal (proximal and distal DMAX of 2.4 and 2.2 mm, respectively). After the predilation with a 2.75×10.00 mm compliance balloon a flow-limiting dissection was observed. The BVS implantation was not enough to seal the dissection and the patient did not recover the TIMI flow 3. Finally, a bail-out stenting with a metallic stent was implanted successfully and the patient recovered TIMI flow 3. The second patient presented with a moderate lesion in a large obtuse marginal (Figure 4). After the 3×18 mm BVS implantation the OCT imaging showed severe ISA in the proximal part of the device and the patient was treated with a 3.5×9 mm post-dilatation compliance balloon. The predicted device diameter at the end of the procedure was 3.96 mm. After the post-dilatation, a new OCT pullback showed scaffold pattern irregularities that were not treated and the patient was discharged the day after. At day 33, the patient complained of chest pain with documented exercise induced ischaemia. The angiography showed a patent coronary vessel with a diameter stenosis of 23% by QCA. However, OCT confirmed multiple signs of scaffold pattern irregularities. It was decided to treat with a metallic stent. After the procedure, the troponin value raised three times the upper limit of normality.34
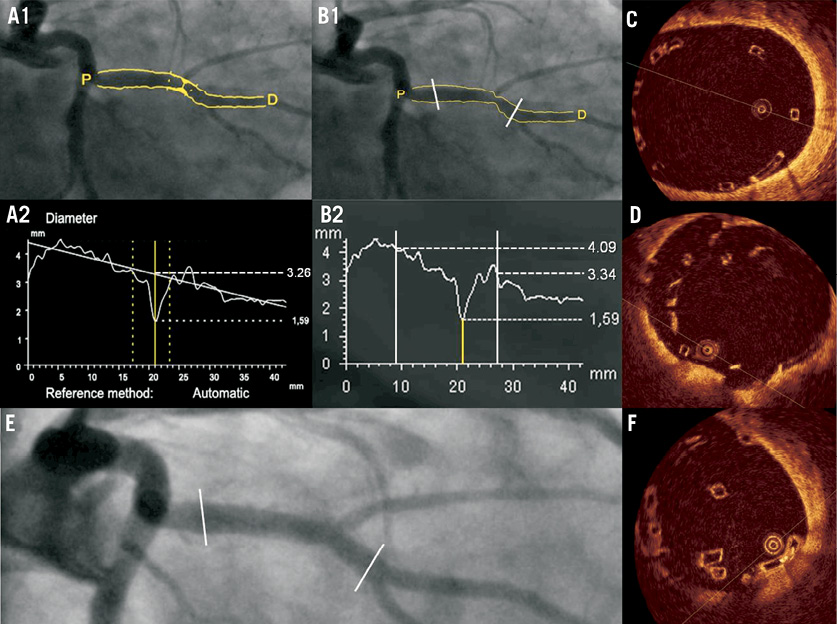
Figure 4. Coronary angiography and OCT of a patient with scaffold pattern irregularity at post-implantation. Patient affected of a moderate lesion in the obtuse marginal. The interpolated-RVD was 3.26 mm (A) and the proximal and distal Dmax of the scaffolded segment (prior to the implantation) were 4.09 and 3.34 mm respectively (B). After the BVS implantation the OCT imaging showed severe malapposition of the scaffold (C); and the operator decided to post-dilate with a compliance balloon up to 3.96 mm of predicted diameter. A second OCT pullback showed scaffold pattern irregularities highly suggestive of fracture (D) that were untreated. At day 33, the patient presented with ischaemia and was re-catheterised (E). A new OCT (F) showed scaffold pattern irregularities with attached thrombi (arrow).
For all these reasons it seems advisable to perform BVS implantation using precise measurements for accurate vessel sizing. We recommend a mandatory predilatation in all patients ensuring an optimal expansion of the balloon. The quantification of the maximal lumen diameter (DMAX) in the proximal and distal segments of the MLD is currently viewed as one of the preventative measures used to ensure accurate sizing of the BVS with respect to the target vessel dimensions (Figure 1). According to the DMAX results, an appropriate device size and inflated balloon pressure should be chosen to achieve optimal device apposition and expansion. Post-dilation can be performed but without over-stretching the BVS beyond 3.3 mm. Consequently, in the on-going ABSORB EXTEND single-arm study, currently recruiting more than 1000 patients, the operator is requested to assess the DMAX prior to BVS implantation. In the case of DMAX <2.5 mm or >3.3 mm the patient should not be included in the study. A third generation of the device with a slightly modified pattern is intended to raise the current upper limit of deployment of the 3.0 mm (nominal diameter) device to 3.8 mm.
Limitations
The first limitation is the few number of patients included in our study, despite the data representing one of the largest studies ever made with baseline optical coherence tomography. The second limitation refers to the OCT endpoints of non-optimal deployment. Due to a lack of expert consensus we decided to infer the IVUS definitions to the OCT technology; these criteria have however not yet been validated with clinical outcomes in formal randomised controlled trials. Third, this study is a description of the OCT findings observed in the ABSORB Cohort B study. The selected DMAX cut-offs of 2.5 and 3.3 mm are arbitrary and not evidence-based. They are however inferred from the knowledge of the mechanical properties of the polymeric BVS device. The BVS chart of the 3.0 mm nominal size diameter sets the burst pressure at 16 atmospheres, which corresponds to a predicted device diameter of 3.35 mm. The expansion of the device exceeding this boundary can potentially fracture the polymeric struts. On the other hand, when the BVS is under-expanded below 2.5 mm, the actual diameter may potentially be even smaller than 2.2 mm since the 150 µm thickness of the apposed struts to each side of the lumen (2×150 µm=0.3 mm) has to be subtracted from the scaffold diameter of 2.5 mm.
Conclusions
Appropriate deployment of the bioresorbable vascular scaffold as assessed by optical coherence tomography is related to the quantitative angiographic assessment of the maximal lumen diameter prior to the implantation. Lesions between 2.5 to 3.3 mm of maximal lumen diameter achieved better deployment criteria than those with a maximal lumen diameter <2.5 mm and >3.3 mm. Further investigations are warranted to correlate the angiographic guidelines with the OCT findings and clinical outcomes at short, medium and long-term follow-up.
Funding
The ABSORB Cohort B trial has been supported by Abbott Vascular (Santa Clara, CA, USA).
Conflict of interest statement
Cécile Dorange, Susan Veldhof and Richard Rapoza are employees of Abbott Vascular. None of the other authors have conflicts of interest to declare.