Abstract
Aims: The RESOLVE score is a validated angiographic scoring system to evaluate the risk of side branch (SB) occlusion in bifurcation intervention. However, the inclusion of quantitative coronary angiography (QCA)-derived parameters limits its use in real-time procedures. We sought to evaluate the capability of risk prediction of SB occlusion based upon a visually estimated risk score (V-RESOLVE).
Methods and results: The present study included all of the lesions (N=1,601) analysed in the study for development and validation of the QCA-based RESOLVE score. An independent observer, blinded to previous QCA data, performed visual estimation to derive a V-RESOLVE score for each bifurcation procedure. The performance characteristics of the V-RESOLVE score were derived and compared to those of the QCA-based RESOLVE score. Considering the variability of visual estimation, statistical simulation of 30 different observers was performed to assess the performance of the V-RESOLVE score further. The SB occlusion rate was significantly higher in the high-risk group (16.7%) than in the non-high-risk group (4.3%) as assessed by the V-RESOLVE score. The consistency between visual estimation and QCA analysis showed fair to moderate agreement (weighted kappa range: 0.22-0.44). The c-statistic of the V-RESOLVE score was 0.76 (95% CI: 0.71 to 0.80), which was comparable to the c-statistic of the QCA-based RESOLVE score (0.77, 95% CI: 0.72 to 0.81) (p=0.74 for comparison). In simulations modelling inter-observer variability, the c-statistic of the V-RESOLVE score ranged from 0.65 to 0.77, all with p<0.01.
Conclusions: The V-RESOLVE score performs similarly to the QCA-based RESOLVE score and can help stratify the risk of SB occlusion during bifurcation intervention.
Abbreviations
HL: Hosmer-Lemeshow test
IDI: integrated discriminatory index
MV: main vessel
NRI: net reclassification improvement
PCI: percutaneous coronary intervention
QCA: quantitative coronary angiography
RESOLVE: Risk prEdiction of Side branch OccLusion in coronary bifurcation interVEntion
ROC: receiver operating characteristic curve
SB: side branch
TIMI: Thrombolysis In Myocardial Infarction
Introduction
Approximately 15% to 20% of percutaneous coronary interventions (PCI) are performed to treat coronary bifurcation lesions1,2. Despite an abundance of randomised data, the optimal interventional strategy selection for true coronary bifurcation lesions remains somewhat controversial because of the variability in side branch (SB) disease and the desire to preserve patency of large diseased side branches3-5. While a provisional approach is generally preferred, evaluating the risk of side branch occlusion during coronary bifurcation intervention is vital in interventional strategy selection. Neither a provisional nor a two-stenting approach should be the default strategy in 100% of patients with bifurcation lesions due to the variability in anatomy and the clinical context of side branch disease6. Risk stratification of SB occlusion makes it possible for precision and personalised medicine in coronary bifurcation intervention. Therefore, clinical prediction models may be helpful for medical decision making in real time.
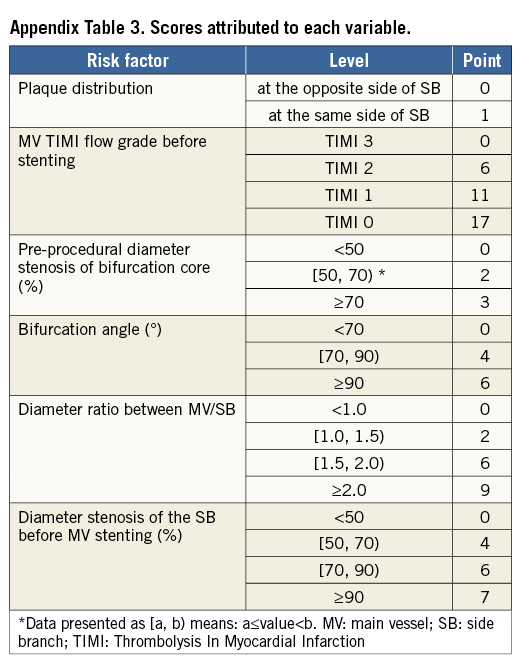
The QCA-based RESOLVE (Risk prEdiction of Side branch OccLusion in coronary bifurcation interVEntion) score is a validated angiographic risk stratification tool (Appendix), which can help identify patients at risk of SB occlusion during bifurcation intervention7. The QCA-based RESOLVE score system contains six independent risk factors for SB occlusion: two visual estimation predictors (plaque distribution and main vessel [MV] Thrombolysis In Myocardial Infarction [TIMI] flow grade before stenting), and four quantitative coronary angiography (QCA) analysis predictors (pre-procedural diameter stenosis of bifurcation core, bifurcation angle, diameter ratio between MV/SB and diameter stenosis of SB before MV stenting). Although QCA provides a more objective determination of the extent and severity of coronary artery disease, it may be more time-consuming and/or not immediately available in real time. As a result, the inclusion of QCA data within the QCA-based RESOLVE score limits its ability to be used at the time of bifurcation intervention8.
Accordingly, the purpose of the present study was to evaluate the ability of a visually estimated RESOLVE (V-RESOLVE) score to predict the risk of side branch occlusion during bifurcation intervention.
Methods
QCA-BASED RESOLVE SCORE
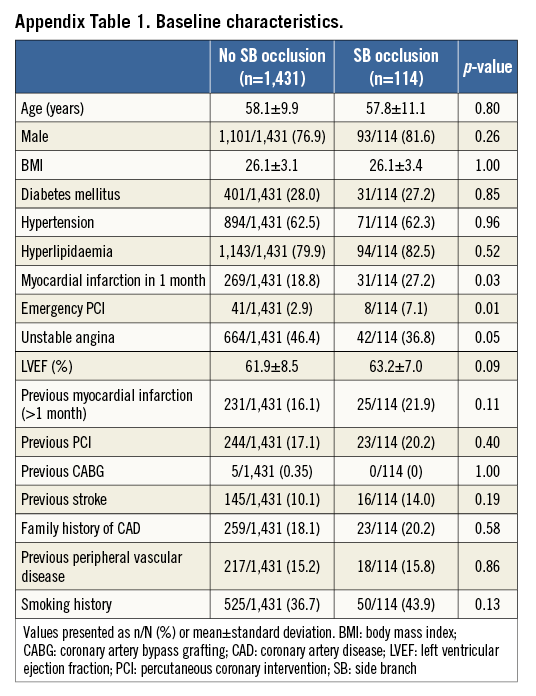
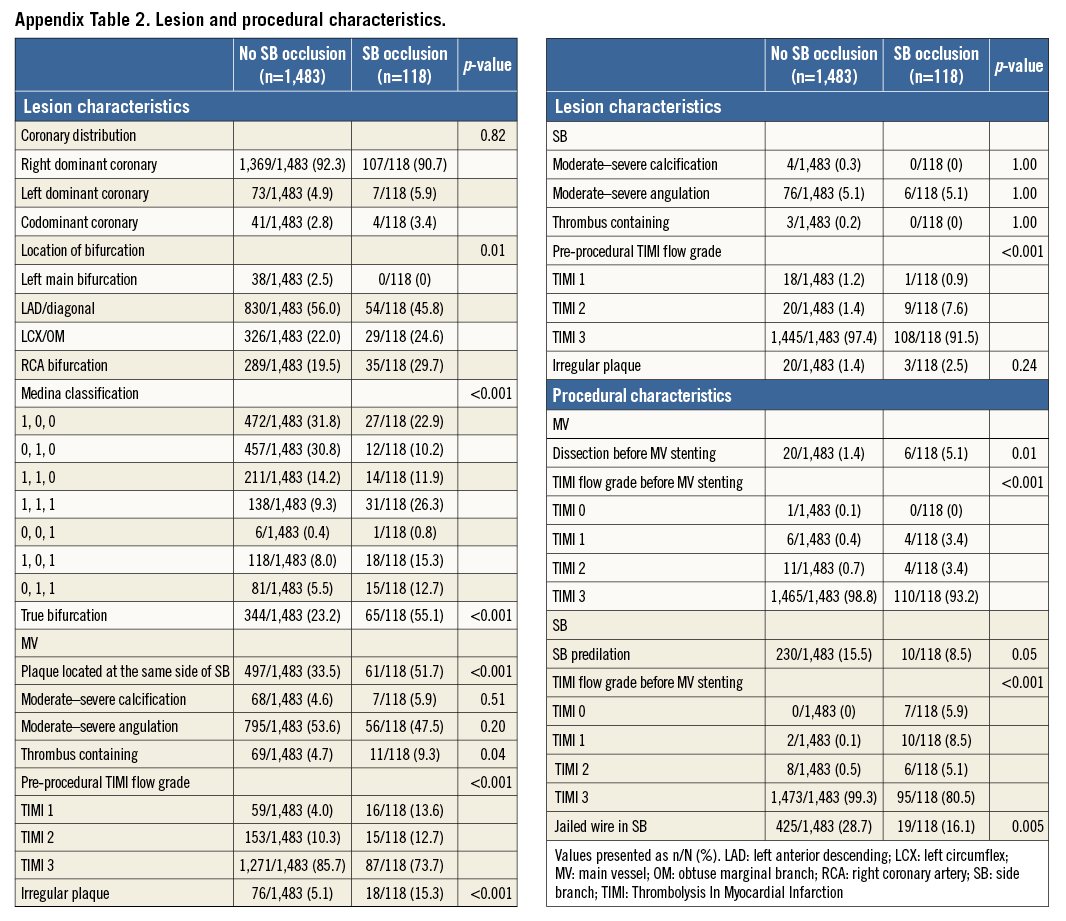
The development and validation of the QCA-based RESOLVE score system has been reported in our previous study7. In brief, the QCA-based RESOLVE score was established and validated in a data set of 1,601 consecutive bifurcation lesions (a developmental data set of 1,200 lesions which served for the construction of the QCA-based RESOLVE score, and a validation subset of 401 lesions for testing and validating the score system) in Fuwai Hospital, Beijing, China. All clinical data, angiographic characteristics, procedural characteristics, baseline and post-predilation QCA data were collected (Appendix Table 1, Appendix Table 2). After univariate and multivariate analysis, six independent risk predictors (two visually assessed predictors and four QCA predictors) remained independently associated with the risk of SB occlusion. The score was then derived by assigning integer-based weights to these risk factors according to their estimated coefficients. The QCA-based RESOLVE score was shown to predict the risk of SB occlusion accurately in patients undergoing coronary bifurcation intervention with good discrimination and calibration. Additionally, the score was used to discriminate between high-risk and non-high-risk groups of patients for side branch occlusion (high-risk group SB occlusion rate of 18.04% vs. non-high-risk SB occlusion rate of 3.35%).
STUDY POPULATION AND PATIENT GROUPS
The present study included all the lesions (1,601 consecutive bifurcation lesions) analysed in the original study used for the development and validation of the QCA-based RESOLVE score. The inclusion and exclusion criteria were detailed in our previous study7. From January to July 2012, a cohort of 1,545 consecutive patients with 1,601 bifurcation lesions underwent provisional single-stent PCI at Fuwai Hospital, meeting all inclusion/exclusion criteria. According to whether the SB occluded or not, patients were divided into two groups: 114 patients with 118 bifurcation lesions in the SB occlusion group and 1,431 patients with 1,483 bifurcation lesions in the no SB occlusion group.
VISUAL ESTIMATION
Both baseline and post-predilation cineangiograms were reviewed by an experienced independent observer in the core laboratory of Fuwai Hospital. The independent observer was blinded to previous QCA data as well as to the incidence of SB occlusion. All QCA analysis predictors (pre-procedural diameter stenosis of the bifurcation core, bifurcation angle, diameter ratio between MV/SB and diameter stenosis of SB before MV stenting) within the QCA-based RESOLVE score were re-assessed by visual estimation.
V-RESOLVE SCORE CALCULATION
The V-RESOLVE score was calculated utilising the weights from the QCA-based RESOLVE score (Appendix Table 3), but utilising only visually assessed data. For the selection of a specific high-/non-high-risk cut-off point, quartiles 1-3 of the V-RESOLVE score were determined as the non-high-risk group, and quartile 4 was determined as the high-risk group.
DEFINITIONS
A coronary bifurcation lesion was defined as a coronary artery narrowing occurring adjacent to or involving the origin of a significant SB undergoing PCI. The criteria for a significant SB were based upon those defined by the European Bifurcation Club9, i.e., a branch that the operator would not want to lose in the global context of a particular patient (symptoms, location of ischaemia, viability, collateralising vessel, left ventricular function, etc.). A significant SB was confirmed by the treating physician and the core laboratory based upon clinical parameters; the selection of a significant SB was not solely based on the SB reference diameter due to the possibility of neglecting small (or underfilled) SB with important clinical significance. For visual estimation, the bifurcation core was defined as the 5 mm part of the main vessel before the carina. SB occlusion after MV stenting was defined as any decrease in TIMI flow grade or the absence of flow in the SB after MV stenting.
STATISTICAL METHODS
Continuous data are presented as mean±SD and were compared using the Student’s t-test. Categorical variables were summarised as counts and percentages and were compared by the chi-square test or Fisher’s exact test as appropriate. All p-values were two-tailed, and a p-value of <0.05 was considered statistically significant. All analyses were performed with the SAS 9.4 system (SAS Institute, Cary, NC, USA).
Agreement between visual estimation and QCA analysis was evaluated with a weighted kappa statistic10,11. The degree of agreement was considered excellent if kappa was >0.80; substantial 0.61-0.80; moderate 0.41-0.60; fair 0.21-0.40; and slight or poor <0.20 or less. We also compared the capability of risk prediction of side branch occlusion using receiver operating characteristic (ROC) analyses12 in order to derive the c-statistic of the overall model as well as the net reclassification improvement (NRI), and the integrated discriminatory index (IDI)13. Calibration was determined by the Hosmer-Lemeshow (HL) goodness-of-fit test14.
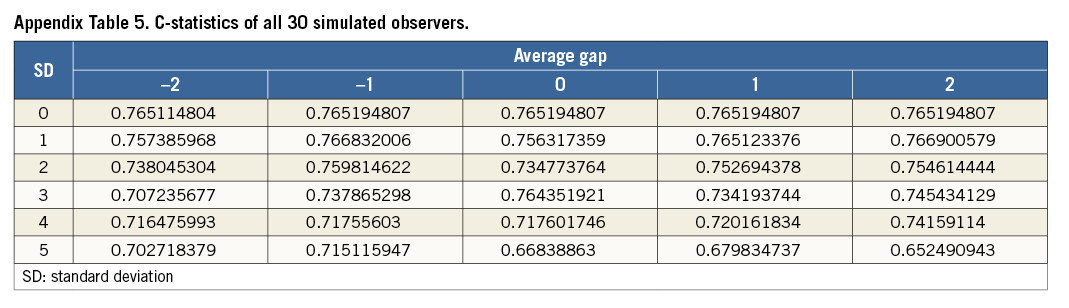
Considering the variation of visual estimation, statistical simulation of 30 different observers was performed to validate the V-RESOLVE score further. Simulated observers were set to have an average absolute difference range from –2 to 2 (–2, –1, 0, 1, 2) with the QCA-based RESOLVE score, and the standard deviation of the calculated V-RESOLVE score was set to range from 0 to 5 (0, 1, 2, 3, 4, 5).
Results
VISUAL ESTIMATION CHARACTERISTICS
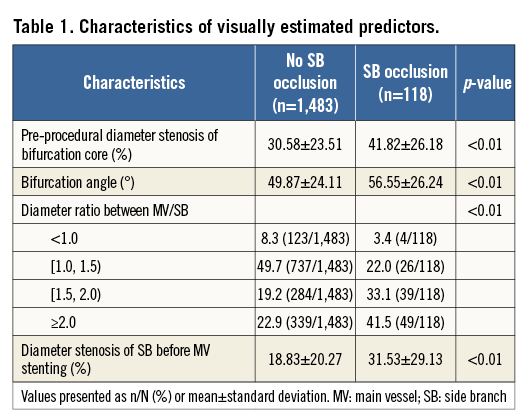
The characteristics of visual estimation predictors are shown in Table 1. The pre-procedural diameter stenosis of the bifurcation core, diameter stenosis of the SB before MV stenting, and the bifurcation angle were significantly higher in the SB occlusion group. The diameter ratio between MV/SB of the SB occlusion group was significantly higher than in the no SB occlusion group. The results were similar to those using the QCA-based RESOLVE score.
AGREEMENT BETWEEN VISUAL ESTIMATION AND QCA ANALYSIS
The agreement between visual estimation and QCA-based analysis showed fair agreement for the measurement of pre-procedural diameter stenosis of the bifurcation core (weighted kappa=0.22), diameter ratio between the MV/SB (weighted kappa=0.22), and the diameter stenosis of the SB before MV stenting (weighted kappa=0.24) (Figure 1). Analysis of the bifurcation angle showed moderate agreement between visual estimation and QCA analysis (weighted kappa=0.44).
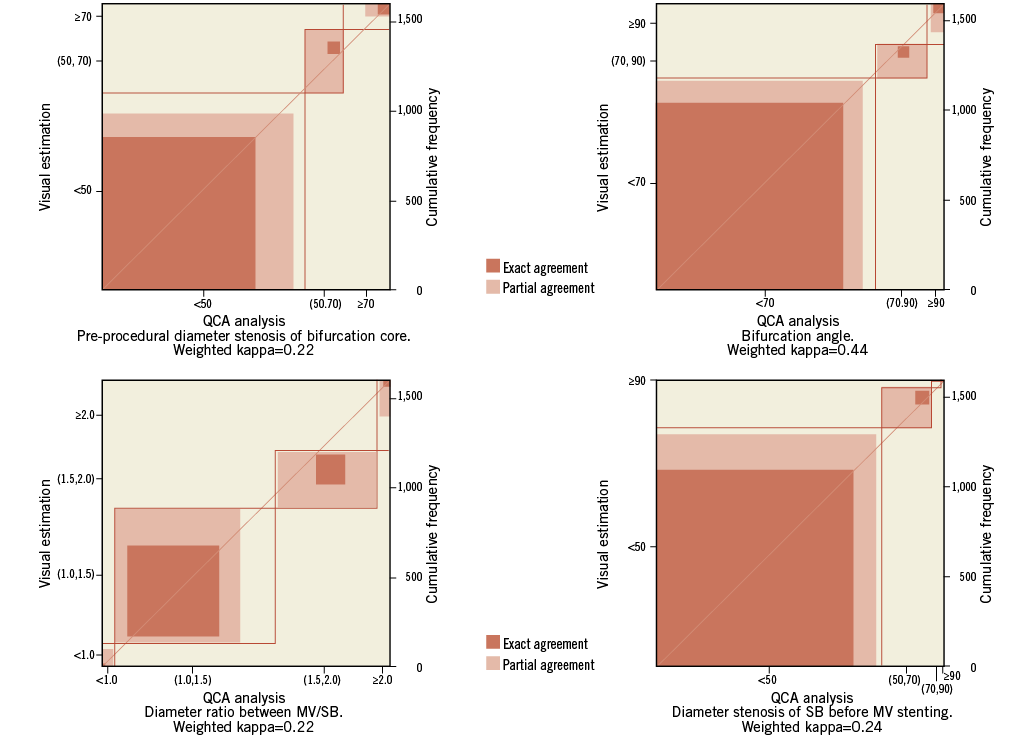
Figure 1. Agreement between visual estimation and QCA analysis. The agreement between visual estimation and QCA analysis for the measurement of pre-procedural diameter stenosis of the bifurcation core (weighted kappa=0.22), bifurcation angle (weighted kappa=0.44), diameter ratio between the MV/SB (weighted kappa=0.22), and the diameter stenosis of the SB before MV stenting (weighted kappa=0.24). MV: main vessel; QCA: quantitative coronary angiography; SB: side branch
ROC ANALYSES
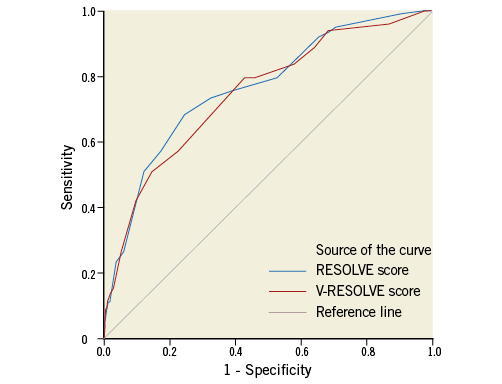
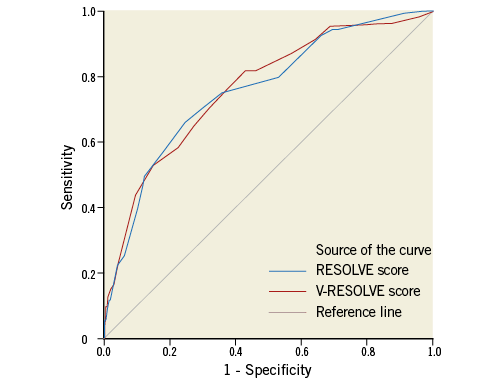
Using SB occlusion after main vessel stenting as a state variable and all these visually estimated predictors as test variables, an ROC curve was generated (Figure 2). The area under the ROC curve was 0.76 (95% CI: 0.71 to 0.80, p<0.001), not significantly different compared with the c-statistic of the QCA-based RESOLVE score (0.77, 95% CI: 0.72 to 0.81) (p=0.74 for comparison). Good calibration of the V-RESOLVE score was observed (HL=10.33, p=0.17). The NRI of the QCA-based RESOLVE score over the V-RESOLVE score was 15.4% (p=0.11) and the IDI of the QCA-based RESOLVE score over the V-RESOLVE score was 0.9% (p=0.42). When SB occlusion is defined as a decrease of the SB TIMI flow grade to 0-1 or is defined as a permanent occlusion, the ROC curves of the RESOLVE and V-RESOLVE score are shown in Appendix Figure 1 and Appendix Figure 2, respectively.
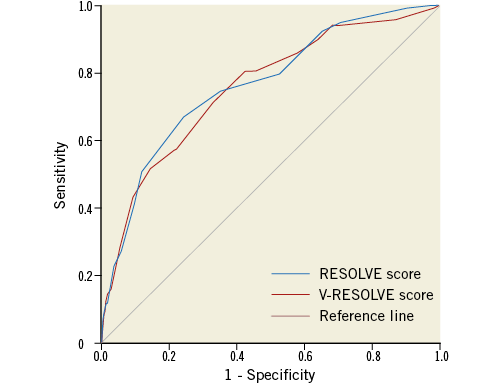
Figure 2. ROC curves of the V-RESOLVE score and the QCA-based RESOLVE score in all 1,601 lesions. Receiver operating characteristic (ROC) curves of V-RESOLVE score (red line) and QCA-based RESOLVE score (blue line) in all 1,601 lesions: the area under the curve (AUC) for the V-RESOLVE score was 0.76 (95% CI: 0.71 to 0.80, p<0.01) and the AUC for the QCA-based RESOLVE score was 0.77 (95% CI: 0.72 to 0.81, p<0.01). There was no significant difference in the AUC between the V-RESOLVE score and the QCA-based RESOLVE score (p=0.74).
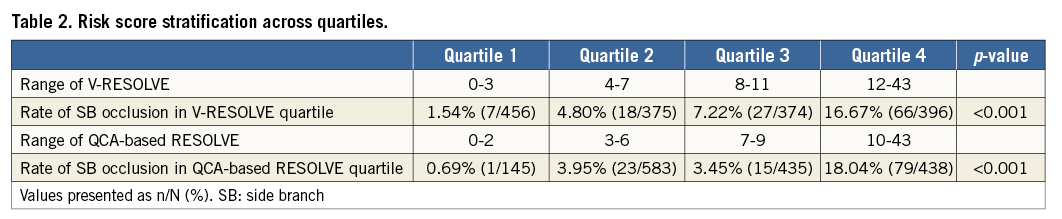
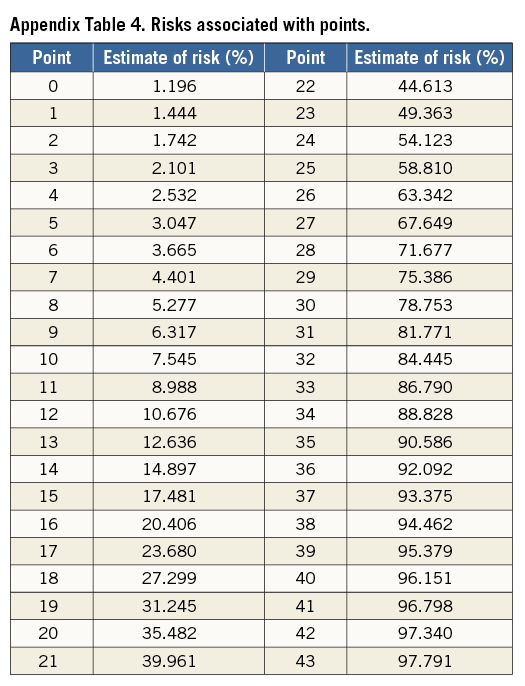
RISK SCORE STRATIFICATION ACROSS QUARTILES OF V-RESOLVE SCORE
The V-RESOLVE score values ranged from 0 to 43. The risks of SB occlusion associated with each point are presented in Appendix Table 4. The V-RESOLVE score had an average difference of 0.65±4.94 from the QCA-based RESOLVE score. The interquartile range and the frequency distribution of each variable across quartiles of the V-RESOLVE score are displayed in Table 2. As shown in the Table, event rates in all the 1,601 lesions across quartiles of the V-RESOLVE score were: 1.5% in quartile 1 (V-RESOLVE score: 0-3); 4.8% in quartile 2 (V-RESOLVE score: 4-7); 7.2% in quartile 3 (V-RESOLVE score: 8-11); and 16.7% in quartile 4 (V-RESOLVE score: ≥12) (p<0.001). The odds of SB occlusion were 13.33 (95% CI: 6.02 to 29.41) for quartile 4 versus quartile 1, 4.65 (95% CI: 2.65 to 8.20) for quartile 4 versus quartile 2, and 2.67 (95% CI: 1.66 to 4.27) for quartile 4 versus quartile 3.
HIGH- AND NON-HIGH-RISK GROUPS
Consistent with the QCA-based RESOLVE score, quartiles 1-3 were determined as the non-high-risk group (score: 0-11), and quartile 4 described the high-risk group (score: 12-43) in the V-RESOLVE score (Table 3). The rate of SB occlusion was significantly higher in the high-risk group (16.7%) than in the non-high-risk group (4.3%) (p<0.01). Compared with the risk groups divided by the QCA-based RESOLVE score, there were no appreciable differences in the rate of SB occlusion in the non-high-risk group (4.3% vs. 3.4%, p=0.22) and the high-risk group (16.7% vs. 18.0%, p=0.60).
STATISTICAL SIMULATION
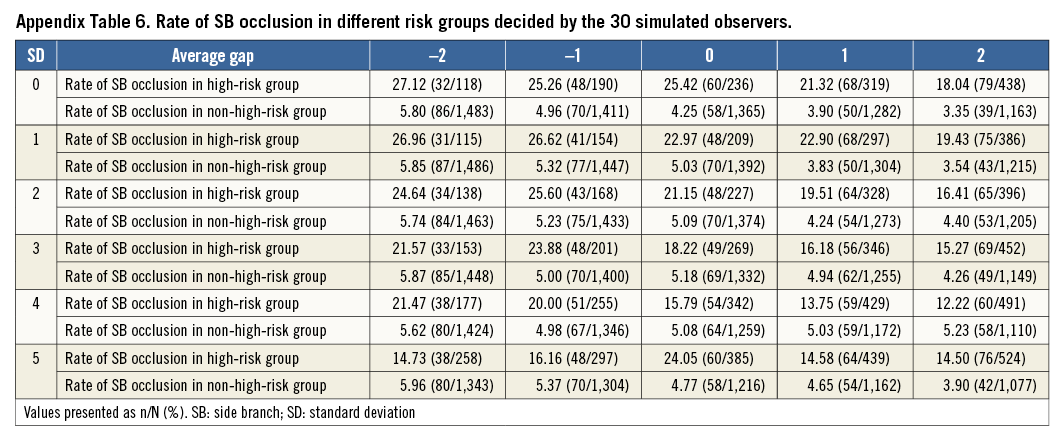
In simulations, the c-statistic of the V-RESOLVE score ranged from 0.65 to 0.77, all with p<0.01 (Appendix Table 5). Using a score of 12 as the cut-off value in order to discriminate non-high-risk vs. high-risk (<12 vs. ≥12), the V-RESOLVE score calculated by all 30 simulations showed good discrimination (Appendix Table 6). Similarly, the rates of SB occlusion were significantly higher in the high-risk group compared with the corresponding non-high-risk group for each observer.
Discussion
While a provisional approach is generally preferred to treat coronary bifurcation disease, SB occlusion can occur with this approach, and can be a source of significant periprocedural risk. This risk may be modifiable through a variety of techniques, but these techniques may not be necessary for many cases of bifurcation intervention. Because the risk of SB occlusion is affected by several different predictors, clinical prediction models containing multiple risk factors could help interventionalists to evaluate the risk of SB occlusion up-front, and therefore modify the approach to bifurcation disease accordingly. This was the original basis for the calculation of the QCA-based RESOLVE score; however, the methodology required for the score’s computation was admittedly time-consuming and required on-line QCA measurements, limiting its use in daily practice. Although previous studies have reported that visual estimation is highly variable even among experts in interventional cardiology15, visual estimation remains the most commonly used method for risk prediction of SB occlusion in clinical practice due to its convenience and easy application. The major findings of the present study were: 1) when calculating the RESOLVE score completely with visually estimated predictors (V-RESOLVE score), this score was still able to predict accurately the risk of SB occlusion in patients undergoing coronary bifurcation intervention; 2) there were only minor appreciable differences in discrimination and calibration between the V-RESOLVE score and the QCA-based RESOLVE score.
It has been proved that precision medicine can improve the safety of medical care by pre-procedural risk stratification16. To our knowledge, the QCA-based RESOLVE score and V-RESOLVE score are the first attempt to stratify the risk of SB occlusion during coronary bifurcation intervention. Risk prediction of SB occlusion is the foundation of precision and personalised interventional strategy selection. The V-RESOLVE score makes precision medicine possible in the daily practice of coronary bifurcation intervention because of its easy use.
Previous studies have reported that visual assessment is more variable and less precise in the analysis of bifurcation lesions compared to QCA software which is dedicated to bifurcation analysis15. Physicians tended to assess coronary lesions treated with percutaneous coronary intervention as more severe than measurements by QCA17. In the present study, the agreements between visual estimation and QCA analysis showed fair to moderate agreement for the measurement of pre-procedural diameter stenosis of the bifurcation core, bifurcation angle, diameter ratio between the MV/SB and diameter stenosis of the SB before MV stenting (weighted kappa range: 0.22-0.44). The agreement between visual estimation and QCA analysis was slightly better than in previous studies (kappa=0.109 for European Bifurcation Club experts)18. Considering the intra- and inter-observer variability for visual estimation, we performed the simulation analysis (in order to account for the potential training effect). The c-statistic of the V-RESOLVE score ranged from 0.65 to 0.77, all with p<0.01, which is acceptable. Intra- and inter-observer variability for visual estimation is always a question for every score system and is also a major concern of ours. The statistics simulation presents acceptable results and may indicate that the V-RESOLVE score is still predictable even when high intra- and inter-observer variability exists. As for the overall V-RESOLVE score – which was calculated completely with visually estimated predictors – the mean difference was only 0.65 from the QCA-based RESOLVE score. Additionally, there was no significant difference in c-statistics between the V-RESOLVE score and the QCA-based RESOLVE score, with only minor reclassification observed. Thus, the capability of risk prediction of side branch occlusion of the V-RESOLVE score and the QCA-based RESOLVE score was comparable. Notably, the ability of the V-RESOLVE score to stratify patients into high- and non-high-risk groups of SB compromise was retained, despite these differences. The potential explanation for the similar performance of the two scores is that the agreements between visual estimation and QCA analysis showed acceptable agreement.
Consistent with the QCA-based RESOLVE score, the lowest score in quartile 4 of the V-RESOLVE score (12 points) was selected as the cut-off value of the non-high-risk group (<12) and the high-risk group (≥12). The lowest score in quartile 4 of the V-RESOLVE score is higher than that in the QCA-based RESOLVE score (10 points) because visual estimation tends to evaluate the diameter stenosis as 8.2% greater than QCA analysis17. In the present study, two visually estimated predictors were related to the diameter stenosis of the bifurcation lesion. The overestimated diameter stenosis may explain the relatively higher cut-off value.
When taking <12 and ≥12 as the definition of the non-high-risk group and the high-risk group in the V-RESOLVE score, the incidence of SB occlusion in the high-risk group was significantly higher than in the non-high-risk group. In the high-risk group decided by the V-RESOLVE score and QCA-based RESOLVE score, the SB occlusion rate was 16.7% and 18.0% (p=0.60), respectively. As for the non-high-risk group, the SB occlusion rate was 4.3% (52/1,205) and 3.4% (39/1,163) (p=0.22). Thus, the V-RESOLVE score offers the ability to discriminate among patients at greater risk of SB occlusion.
The discussion regarding these risk factors of SB occlusion has been detailed in our previous study7. The mechanism of SB occlusion can be variable: either plaque shift or carina shift has been thought to be the potential mechanism of SB occlusion19. Plaque shift seemed to explain most of the predictors in the present study, which was consistent with a previous study20. Despite the variability in visual estimation, the bifurcation angle in the SB occlusion group was significantly higher than that in the no SB occlusion group, consistent with the results of QCA analysis. The possible mechanism of how a high bifurcation angle contributes to SB occlusion has been illustrated in our previous studies7,21,22. In brief, a high bifurcation angle may cause a more difficult flow division into the SB, higher plaque volume in the bifurcation core, and a lower rate of successful jailed wire placement in the SB. All of these characteristics related to a high bifurcation angle may contribute to SB occlusion.
The strength of our study is that we have evaluated the capability of risk prediction of SB occlusion of the V-RESOLVE score. The acceptable discrimination and calibration provide the foundation for using the V-RESOLVE score in clinical practice. The V-RESOLVE score could also be widely utilised to select a particular study population for a clinical trial design concerning coronary bifurcation treatment in the future.
STUDY LIMITATIONS
Our study has several limitations. First, the V-RESOLVE risk score was based on the visual estimation of only one independent observer. Some training effect may have led to the ability of the observer to perform well. Nevertheless, the simulated score calculations included as a sensitivity analysis did demonstrate that, even with the added variability of the V-RESOLVE score, its repeatability and predictive accuracy of SB occlusion could be useful. Nonetheless, the score should be further validated by different observers and different study data sets. Second, our study was limited by the retrospective, single-centre design, and unknown confounding factors cannot be excluded. Prospective studies are therefore warranted to validate the performance of the V-RESOLVE score in daily practice. Last, as we know, intra- and inter-observer variability is inevitable in any evaluation system depending on visual observation, even when evaluated by experienced operators, including the V-RESOLVE score. Furthermore, although the statistics simulation presented acceptable results given the existence of high intra- and inter-observer variability, the study results were based on the evaluation of experienced core lab personnel but not operators, which might decrease the rate of prediction success. The V-RESOLVE score only provides information regarding the possibility of SB occlusion but not the exact fate of the SB after MV stenting. Consequently, the V-RESOLVE score should not be regarded as the only criterion of strategy selection. Interventionalists should select the optimal strategy after consideration of both SB clinical significance and the risk of its occlusion. In future, a randomised clinical trial is needed to validate the V-RESOLVE score in daily practice.
Conclusions
The V-RESOLVE score, an easy-to-use score system based on visual estimation, can help risk stratification of SB occlusion during coronary bifurcation intervention.
| Impact on daily practice The V-RESOLVE score can help risk stratification of SB occlusion during coronary bifurcation intervention. Evaluating the risk of SB occlusion during coronary bifurcation intervention is vital in interventional strategy selection. Thus, the potential for use of the V-RESOLVE score prospectively at the time of bifurcation PCI offers the promise of allowing operators to choose a bifurcation strategy systematically in real time (a form of “precision medicine”). |
Funding
This research was supported by Peking Union Medical College Youth Fund and Fundamental Research Funds for the Central Universities (Grant number: 33320140166) and Beijing Municipal Science & Technology Commission (Grant number: Z141107002514096).
Conflict of interest statement
The authors have no conflicts of interest to declare.
SUPPLEMENTARY DATA
Appendix. Development of the RESOLVE score
STUDY POPULATION
From January to July 2012, a cohort of 7,007 consecutive patients underwent PCI at Fuwai Hospital in Beijing, China. For the RESOLVE study, specific inclusion criteria were: 1) patients with a coronary bifurcation lesion (defined as a coronary artery narrowing occurring adjacent to or involving the origin of a significant SB) undergoing PCI; and 2) a bifurcation lesion consisting of a significant SB confirmed by the treating physician and the core laboratory. Selection of the SB was not based on the reference diameter of the SB because of the possibility of neglecting a small SB with important clinical significance. The criteria for a significant SB were based upon those defined by the European Bifurcation Club9, i.e., a branch that the operator would not want to lose in the global context of a particular patient (symptoms, location of ischaemia, viability, collateralising vessel, left ventricular function, etc.). Exclusion criteria were: patients undergoing elective SB stenting before MV stenting. Among the 7,007 patients, 5,172 patients without bifurcation lesions and 290 patients with bifurcation lesions undergoing elective SB stenting were excluded. A total of 1,545 patients with 1,601 bifurcation lesions who met all the inclusion criteria and had no exclusion criteria were included. PCI procedure and periprocedural medications were based on the operator’s discretion and current guidelines.
DATA COLLECTION AND QUANTITATIVE CORONARY ANGIOGRAPHY
Clinical data were obtained through a review of the medical records. All baseline and procedural cineangiograms were reviewed and analysed by an independent core laboratory. Quantitative coronary angiography (QCA) was performed by using standard quantitative analyses and definitions23. Angiograms obtained at baseline and post predilation were analysed with the use of a computer-based system dedicated to bifurcation analysis (QAngio XA, version 7.3; Medis, Leiden, The Netherlands). We obtained quantitative angiographic measurements of the four segments of the bifurcation lesion: the proximal MV segment, the distal MV segment, the SB segment and the bifurcation core segment. Bifurcation core was defined as the central part of the bifurcation which begins where the common vessel starts to split into two branches and ends at the carinal point24, which area is calculated by the QAngio XA software. We also obtained the bifurcation angle (the angle between the distal MV and the SB) from the analysis system.
In addition to the intrinsic data generated by the QCA system, another variable was derived based on the raw QCA data: the diameter ratio between MV/SB (formula=[reference diameter of proximal MV+reference diameter of distal MV] ⁄2 [reference diameter of SB]), which is a parameter reflecting the relative plaque shift burden from MV to SB.
Baseline clinical, angiographic, and procedural information of both groups are shown in Appendix Table 1 and Appendix Table 2.
STATISTICAL METHODS AND SCORE DETERMINATION
The database was divided into two subsets by procedural chronological order: a developmental data set of 1,200 lesions which served for the construction of the risk model, and a validation subset of 401 lesions for testing and validating the model. The multivariable model was built by stepwise variable selection with the same entry and exit criteria as in the univariable analyses. The score was then derived by attributing integer numbers to the variables retained in the multivariable model. Additionally, the scoring system was then used to define three risk groups (low, intermediate and high risk). All p-values were two-tailed, and a p-value of <0.05 was considered statistically significant. All analyses were performed with the SAS 9.3 system (SAS Institute, Cary, NC, USA).
THE RESOLVE RISK MODEL AND THE RESOLVE RISK SCORE
After univariable and multivariable selection, five primary angiographic variables (plaque distribution, MV TIMI flow grade before stenting, pre-procedural diameter stenosis of the bifurcation core, bifurcation angle and diameter stenosis of the SB before MV stenting) and one derived variable (the diameter ratio between MV/SB) remained independently associated with the risk of SB occlusion. There was little correlation apparent between these variables; the variance inflation factor showed the absence of multicollinearity among variables in the model. Within the derivation sample, the c-statistic for this model was 0.80 (95% CI: 0.75 to 0.85) and excellent calibration was observed (Hosmer-Lemeshow p=1.00).
The scores attributed to each variable according to their estimated coefficients from the derivation data set are shown in Appendix Table 3. The c-statistic for the risk score was only slightly worse than that of the original model; c=0.76 (95% CI: 0.71 to 0.82); HL p=0.12.
The RESOLVE score ranged from 0 to 43. Event rates in the derivation cohort across quartiles of RESOLVE score were: 1.0% in quartile 1; 3.9% in quartile 2; 3.6% in quartile 3; and 17.5% in quartile 4. There were no differences in SB occlusion rate between quartile 2 and quartile 3 (p=0.80). Thus, quartile 1 was determined as the low-risk group (quartile 1, score: 0-2); quartiles 2 and 3 were combined into an intermediate-risk group (quartile 2 and quartile 3, score: 3-9); and quartile 4 described the high-risk group (quartile 4, score: 10-42).
VALIDATION OF THE RESOLVE SCORE
For the 401 lesions included in the validation cohort, the RESOLVE model displayed good prognostic accuracy with a c-statistic of 0.81 (95% CI: 0.73 to 0.89); HL p=0.77. The RESOLVE score also displayed good prognostic accuracy with a c-statistic of 0.77 (95% CI: 0.69 to 0.86); HL p=0.58. SB occlusion rates in the validation cohort increased significantly across different risk groups: 0.0% in the low-risk group; 3.8% in the intermediate-risk group; and 19.8% in the high-risk group (p<0.001).
SUPPLEMENTARY RESULTS
The positive and negative predictive values of the V-RESOLVE score for SB occlusion were 16.67% and 95.68%, respectively. The risk of SB occlusion associated with each point is presented in Appendix Table 4.
In simulations, the c-statistic of the V-RESOLVE score ranged from 0.65 to 0.77, all with p<0.01 (Appendix Table 5). Using a score of 12 as the cut-off value in order to discriminate non-high-risk vs. high-risk (<12 vs. ≥12), the V-RESOLVE score calculated by all 30 simulations showed good discrimination (Appendix Table 6).
When SB occlusion was defined as TIMI flow grade of SB decrease to 0-1, the rate of SB occlusion was 6.43% (103/1,601). The ROC curves of the RESOLVE and the V-RESOLVE scores are shown in Appendix Figure 1. The area under the curve was 0.758 (95% CI: 0.709-0.806) and 0.762 (95% CI: 0.713-0.811) for the RESOLVE and the V-RESOLVE scores, respectively.
Appendix Figure 1. ROC curves of V-RESOLVE score and QCA-based RESOLVE score for SB with TIMI flow grade decreased to 0-1. The area under the curve was 0.758 (95% CI: 0.709-0.806) and 0.762 (95% CI: 0.713-0.811) for the RESOLVE and the V-RESOLVE scores, respectively.
In the present study, blood flow in the SB was restored spontaneously in 12 (10.2%) lesions and by SB intervention in eight (6.8%) lesions of 118 occluded SB. Ninety-eight (83.0%) lesions occluded permanently. Using persistent SB occlusion as a state variable, receiver operating characteristic (ROC) curves were generated. The ROC curves of the RESOLVE and the V-RESOLVE scores are shown in Appendix Figure 2. The area under the curve was 0.762 (95% CI: 0.711-0.812) and 0.746 (95% CI: 0.694-0.798) for the RESOLVE and the V-RESOLVE scores, respectively.
Appendix Figure 2. ROC curves of V-RESOLVE score and QCA-based RESOLVE score for permanently occluded SB. The area under the curve was 0.762 (95% CI: 0.711-0.812) and 0.746 (95% CI: 0.694-0.798) for the RESOLVE and the V-RESOLVE scores, respectively.