Preamble
Recent publications on the SYNTAX (SYNergy between percutaneous coronary intervention with TAXus and cardiac surgery) score have caught our attention and triggered a written reaction on the history and evolution of the SYNTAX score over the last decades. Among these publications, there is the editorial of Marie-Claude Morice, “Has the SYNTAX score become obsolete?”1. The most recent guidelines on revascularisation also question the ability of the SYNTAX II score to predict four-year all-cause mortality … even if the rate of mortality at four years in the EXCEL study was not yet available at the time of the writing of the guidelines…2. A publication from Fuwai Hospital raises the following question, “Is the SYNTAX score II applicable in all percutaneous coronary intervention (PCI) patients?”3. Similarly, the team of the Thoraxcenter has published a paper in PLoS One entitled “SYNTAX score II predicts long-term mortality in patients with one- or two-vessel disease”4. A simplified anatomic scoring system designed by the Veterans Affairs based on the randomised population of the EXCEL trial is in preparation but needs to be validated before being publishable … and the temptation to recalibrate the SYNTAX score II after completion of the EXCEL trial is appealing and may lure some of us.
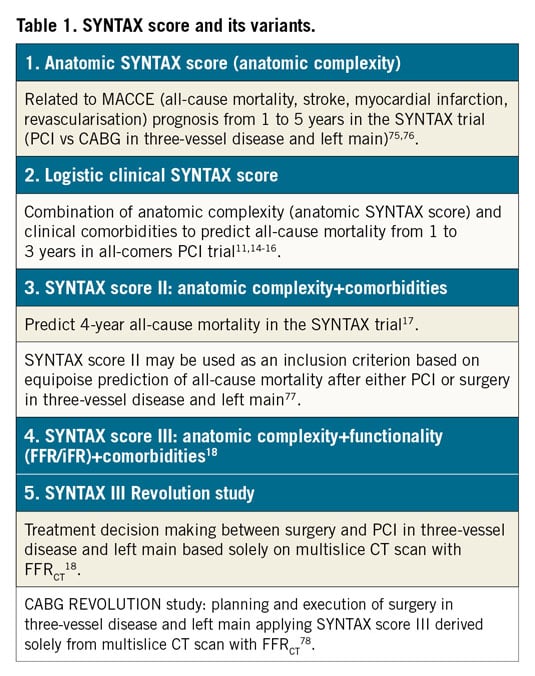
All the past and future publications raise legitimate questions but conceptually run somewhat behind the facts or are misinterpreting the significance of the variety of scores derived from the original design of the anatomical SYNTAX score (Figure 1, Table 1),5,6,7,8,9,10,11,12,13,14,15,16,17,18,19.
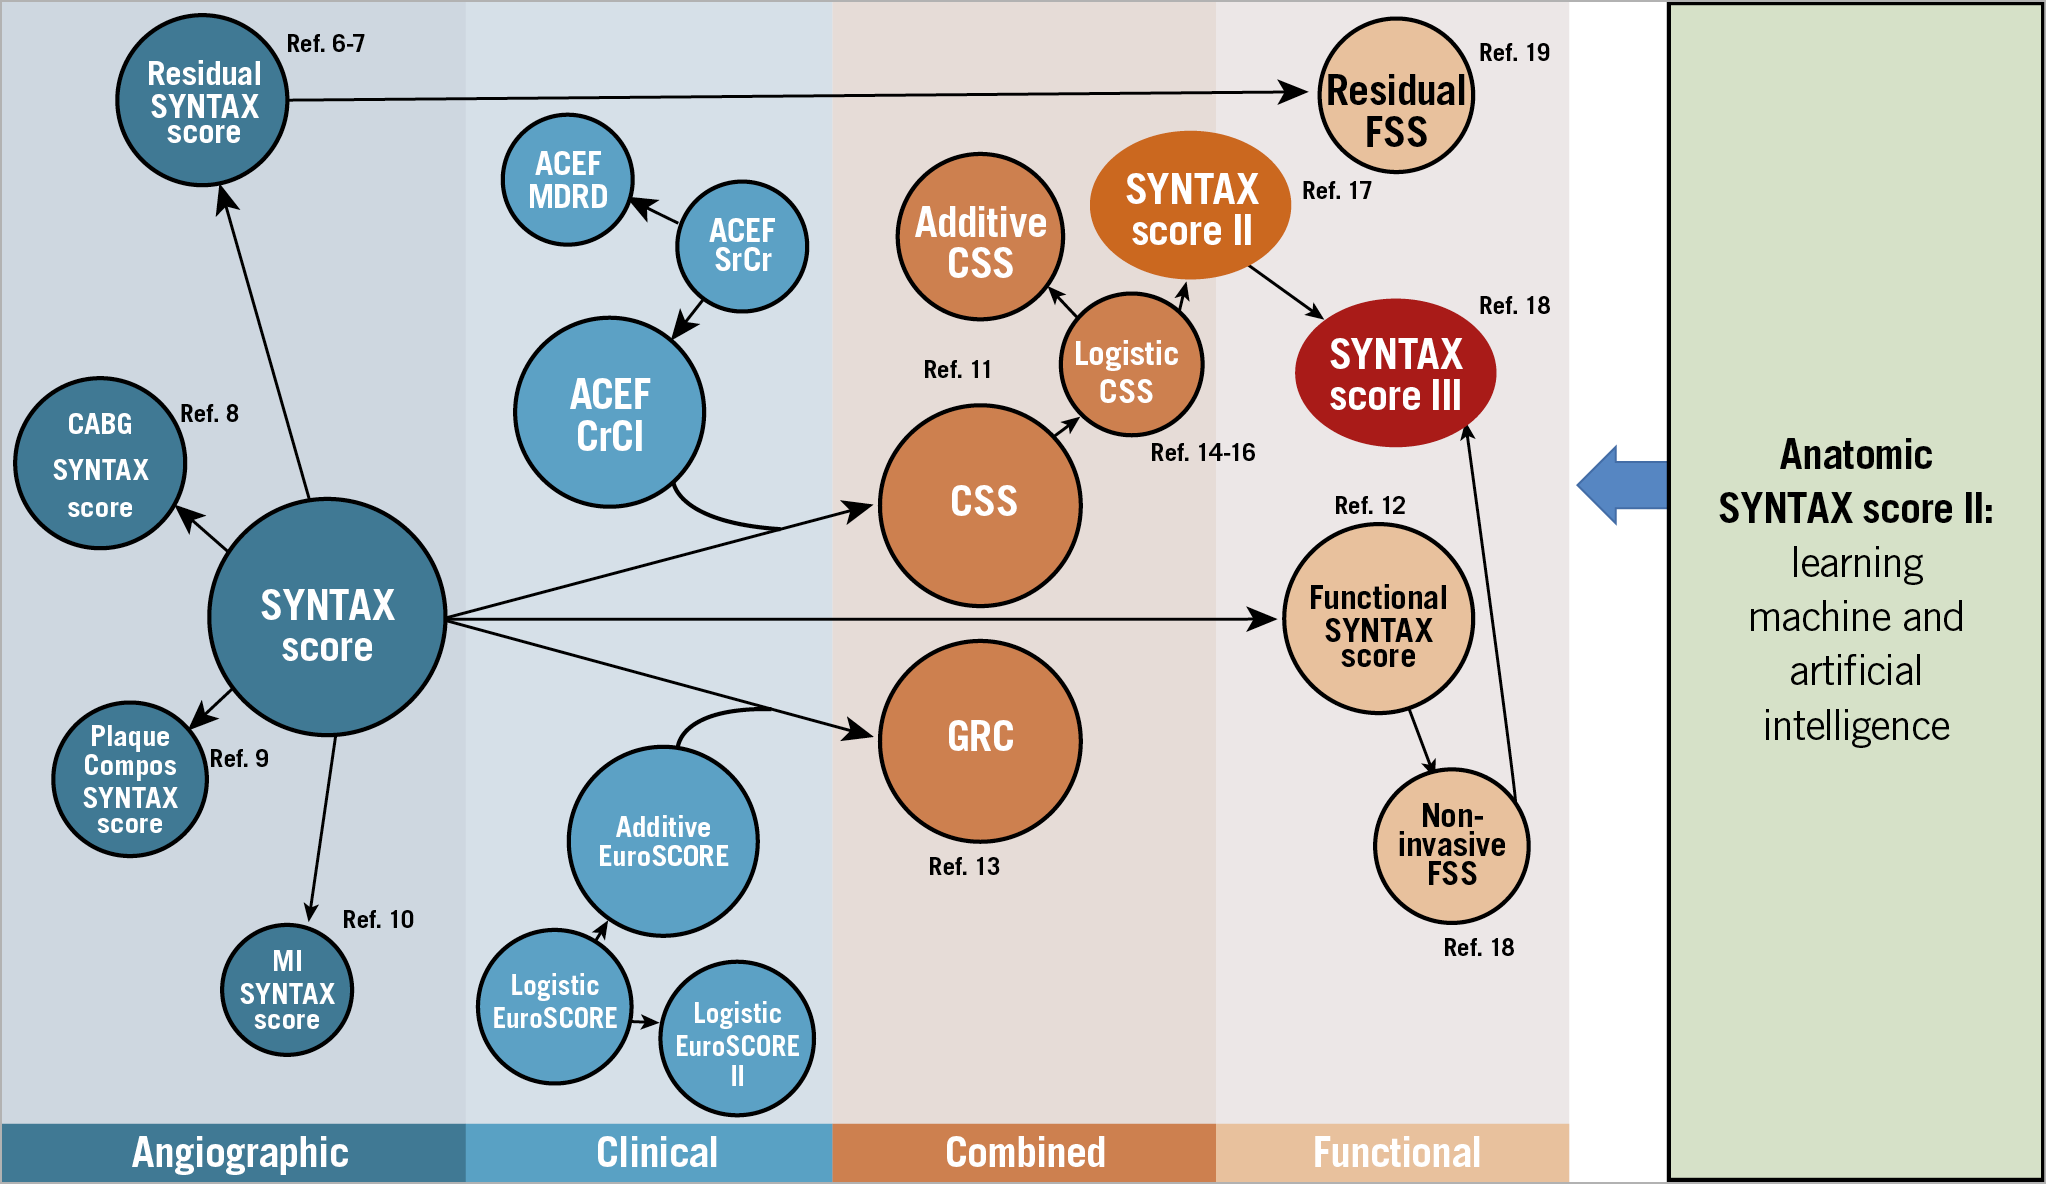
Figure 1. Evolution of the risk score algorithms derived from the historical SYNTAX I trial. ACEF: age, creatinine, ejection fraction; CABG: coronary artery bypass grafting; Compos: compositional; CrCl: creatinine clearance; CSS: clinical SYNTAX score; FSS: functional SYNTAX score; GRC: global risk classification; MI: myocardial infarction; MDRD: Modification of Diet in Renal Disease; SrCr: serum creatinine; SYNTAX: SYNergy between PCI with TAXus and Cardiac Surgery. Adapted with permission from Capodanno5 and Modolo et al72.
The SYNTAX III Revolution trial has, for the first time, randomised two Heart Teams to use either the SYNTAX score II (anatomy plus comorbidities) derived from a conventional cineangiography or a SYNTAX score III (anatomy, plus functional significance, plus comorbidities) derived from a multislice computed tomography (MSCT), providing the Heart Team with a fractional flow reserve (FFR) for the assessment of the functional impact of the stenotic lesions18.
The next historic milestone will be the use of machine learning and artificial intelligence to provide the practitioner with a non-invasive, automatic, objective and reproducible analysis of the anatomic and functional SYNTAX score derived from MSCT, that will be automatically combined with the collected comorbidities of the patient in order to provide clinicians with a SYNTAX score III, a predictive assessment of late all-cause mortality, in case of either surgical or percutaneous treatment, based on anatomy, comorbidities and functionality. However, before describing these future options, let us review the historical foundation, the evolution and peripeteia of the score over the last decades.
THE ROLE OF SCORES IN THE FIELD OF INTERVENTIONAL CARDIOLOGY
A risk score combines multiple predictors to forecast objectively the probability of specific outcomes such as procedural complications, morbidities or mortality that may affect individual patients in the short or long term20. Many risk scores have been developed to serve various purposes within the field of cardiology20. The anatomic SYNTAX score was initially developed as an objective tool to assess the complexity of coronary artery disease (CAD) in the context of a randomised trial comparing PCI and coronary artery bypass grafting (CABG). Subsequently, other scores (such as the logistic clinical SYNTAX score, the age, creatinine, ejection fraction [ACEF] score and a novel risk score) started to target specifically the short-term and long-term prognosis of PCI treatment14,21. Alternatively, the PRECISE-DAPT score, the PARIS risk score and the dual antiplatelet therapy (DAPT) score have attempted to predict bleeding, thereby providing guidance on antiplatelet strategies after PCI22,23,24.
The SYNTAX score II, which combined the anatomic SYNTAX score and clinical predictors, was developed to predict four-year all-cause mortality and on this basis to advise the best and safest revascularisation strategy (PCI versus CABG) in patients with multivessel disease with or without a left main stenotic lesion17.
Another aspect of the clinical impact of the risk score is related to clinical trials: for example, in the historical development of transcatheter aortic valve replacement (TAVR), the Society of Thoracic Surgeons risk score was used to classify patients into low, intermediate and high risk25. The score was then used to assess various levels of risk and helped to conduct trials with progressively decreasing risk: from non-operable to high-, intermediate- and low-risk patients26,27,28. Another purpose of the score is its ability to characterise the level of objective risk that patients endured when treated by specific operators and hospitals. In that respect, the use of risk scores allows appropriate adjustment of treatment failure or success in the most difficult patients treated in a particular hospital.
Before integration into practice, the predictive performance of risk scores needs to be tested in a population different from the one in which the score was developed (external validation). Ultimately, the value of risk scores needs to be tested in a randomised trial to assess their predictive performance in outcomes and patient care.
Furthermore, the score itself is not static. There are changes in the risk profiles of the patients, such as advanced age, higher prevalence of diabetes, etc. Moreover, there is also change in technology, and risk scores have to be adjusted and adapted continuously with the identification of new predictors with additional prognostic value. Furthermore, the predictive performances of scores can be dissimilar from their derivation cohort due to differences in the level of care such as primary versus secondary or tertiary, or related to the geographic areas in which the scores are applied29. Therefore, scores should be revised or updated on a regular basis as soon as they show a loss of predictive value (e.g., discrimination and calibration).
(PRE) HISTORICAL FOUNDATION OF THE SYNTAX SCORES: THE LEAMAN SCORE
In 1976, when Patrick W. Serruys arrived at the Thoraxcenter, he was immediately assigned to a surgical research project: measurement of reactive hyperaemia in bypass grafts combined with regional wall motion assessed from biplane cine-filming of the systolic/diastolic motion of epicardial radiopaque markers implanted at the time of surgery, distally to the site of the graft anastomosis (Figure 2),30,31. In brief, at the end of surgical bypass grafting and when the patient was no longer on cardiopulmonary bypass, the surgeon clamped transiently the saphenous graft or the left internal mammary artery, and the reactive hyperaemia following the transient occlusion was measured with a magnetic flow meter fitted around the graft. The major finding was that in 40% of the cases graft occlusion was not followed by reactive hyperaemia, in other words it was conceivable that 40% of the stenotic native vessels were not flow-limiting (Figure 2),32,33. The only non-surgeon author (P.W. Serruys) of the publication was then introduced and “initiated” to the field of reactive hyperaemia and segmental blood supply to the human left ventricle.
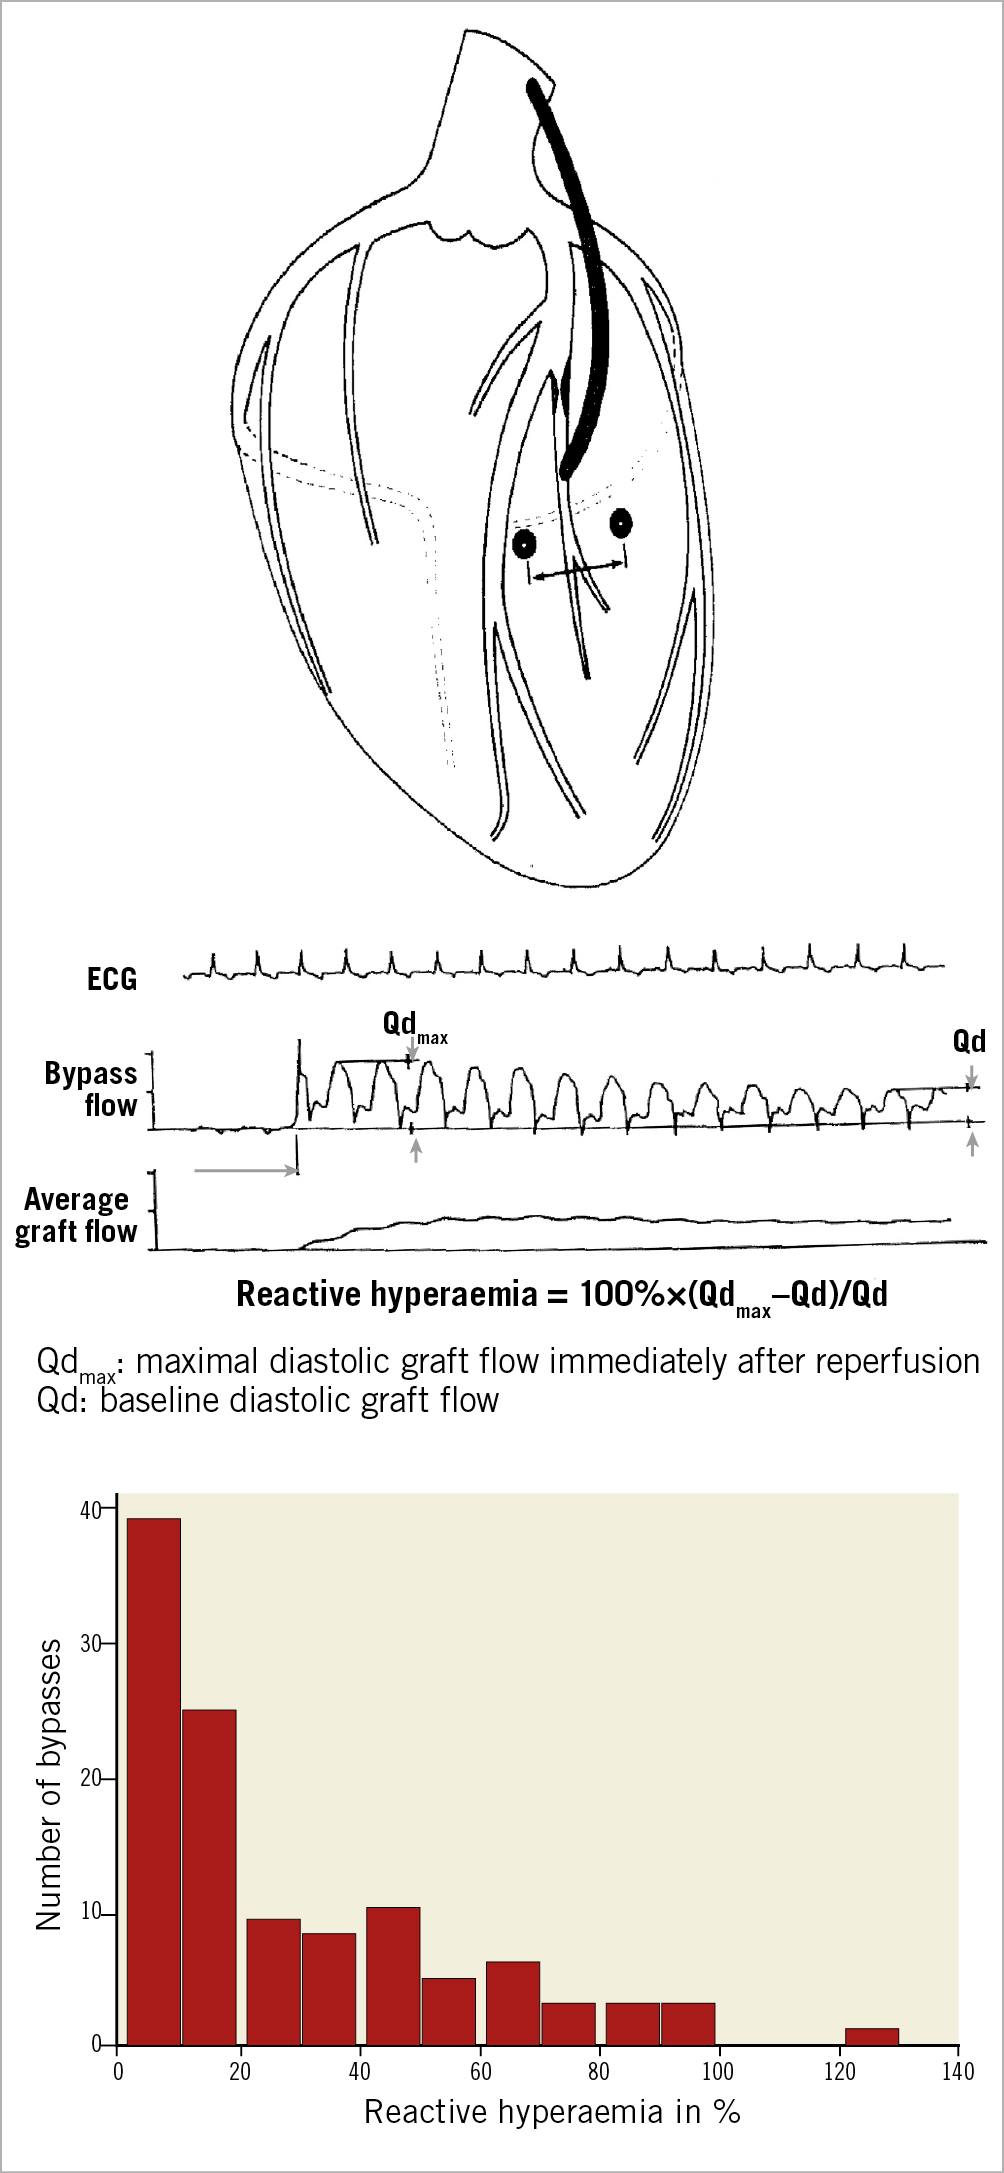
Figure 2. Measurement of reactive hyperaemia in bypass graft. Radiopaque epicardial marker pairs were implanted during surgery in the newly revascularised regions near the coronary anastomosis to assess regional wall systolic and diastolic motion (top). Bypass flow and reactive hyperaemia were measured using magnetic flow after transient occlusion of the bypass graft (middle). Maximal diastolic graft flow recorded immediately after reperfusion (Qdmax) and baseline diastolic graft flow (Qd) were measured to calculate percentage of reactive hyperaemia. The reactive hyperaemia histogram shows a non-Gaussian distribution with almost 40% of grafts showing no reactive hyperaemia (bottom). Adapted from Serruys et al33 and Brower et al32, with permission.
A few years later, a similar attempt to measure reactive hyperaemia was reported in the clinical setting of PCI, with the use of a Grüntzig balloon instrumented at its tip with a Doppler emitter/receiver device allowing the measurement of reactive hyperaemia after balloon deflation (Figure 3),34.
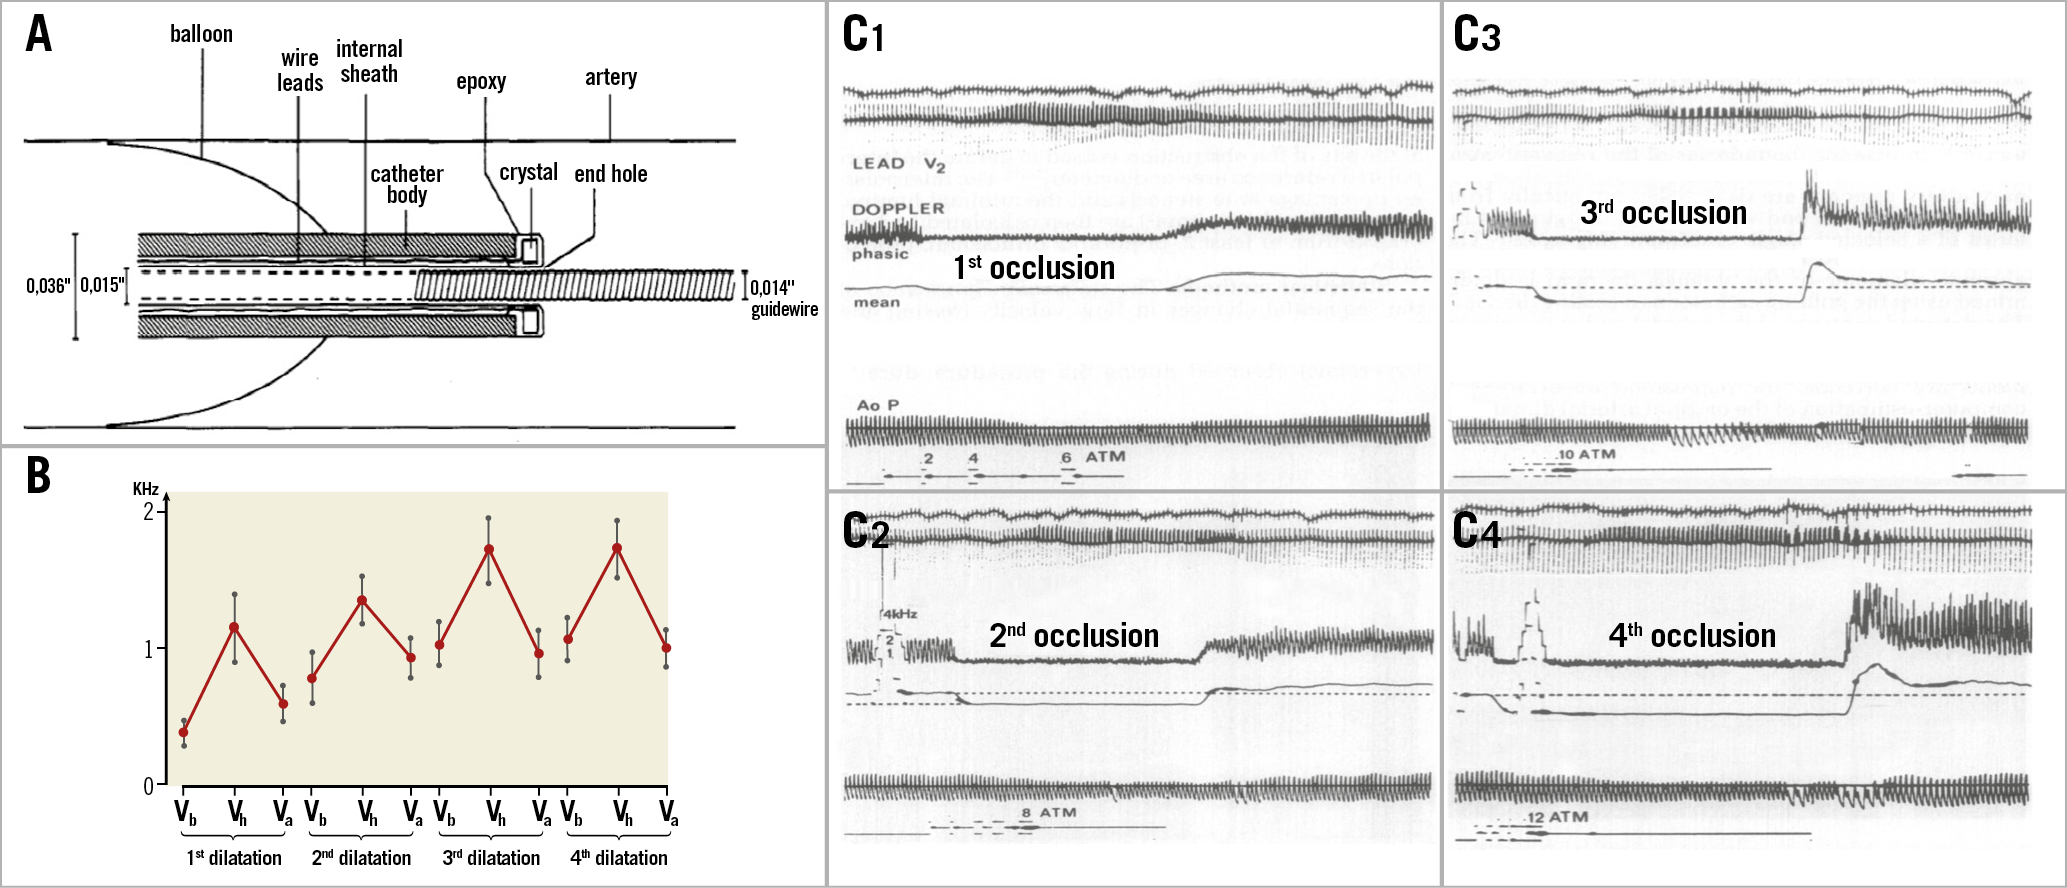
Figure 3. Reactive hyperaemia measurement of the coronary artery stenosis during percutaneous transluminal coronary angioplasty as a guide for functional assessment. A) Schematic cross-sectional drawing of Doppler tip angioplasty catheter with inflated balloon in an artery. B) Doppler shift (kHz, mean±standard error) during four sequential dilatations. C) Examples of mean and phasic Doppler signals before, during and after balloon inflation. Reactive hyperaemia occurs after balloon deflation. C1) First transluminal occlusion using a balloon inflation pressure of 6 atmospheres (atm). C2) Second transluminal occlusion using a balloon inflation pressure of 8 atm. C3) Third transluminal occlusion using a balloon inflation pressure of 10 atm. C4) Fourth transluminal occlusion using a balloon inflation pressure of 12 atm. Va: resting velocity after dilatation; Vb; resting velocity before dilatation; Vh: peak reactive hyperaemia. Reprinted from Serruys et al34, with permission.
In those days, reactive or pharmacological hyperaemia as a marker of flow-limiting stenosis became part of the “physiological” background and mindset of P.W. Serruys. For the rest of his career, hyperaemia (and coronary flow reserve), flow-limiting anatomy35, microvascular resistance (pressure flow loop and hyperaemic index)36,37, pressure gradient across stenosis (stenotic flow reserve [SFR])38 became obsessional topics of research38,39,40.
In 1979, a senior American cardiologist, David Leaman, joined the Thoraxcenter for a sabbatical year during which he worked with the team of the Thoraxcenter on the long-term follow-up of CABG, a project subsidised by the Interuniversity Cardiology Institute of the Netherlands (ICIN). For that project, D. Leaman and P.W. Serruys reviewed the existing literature on blood supply to the left ventricle by regional (segmental) coronary circulation and came up with a weighted assessment of the relative and absolute supply of blood to the human left ventricle by each main branch and side branch of the coronary tree (Figure 4),41.
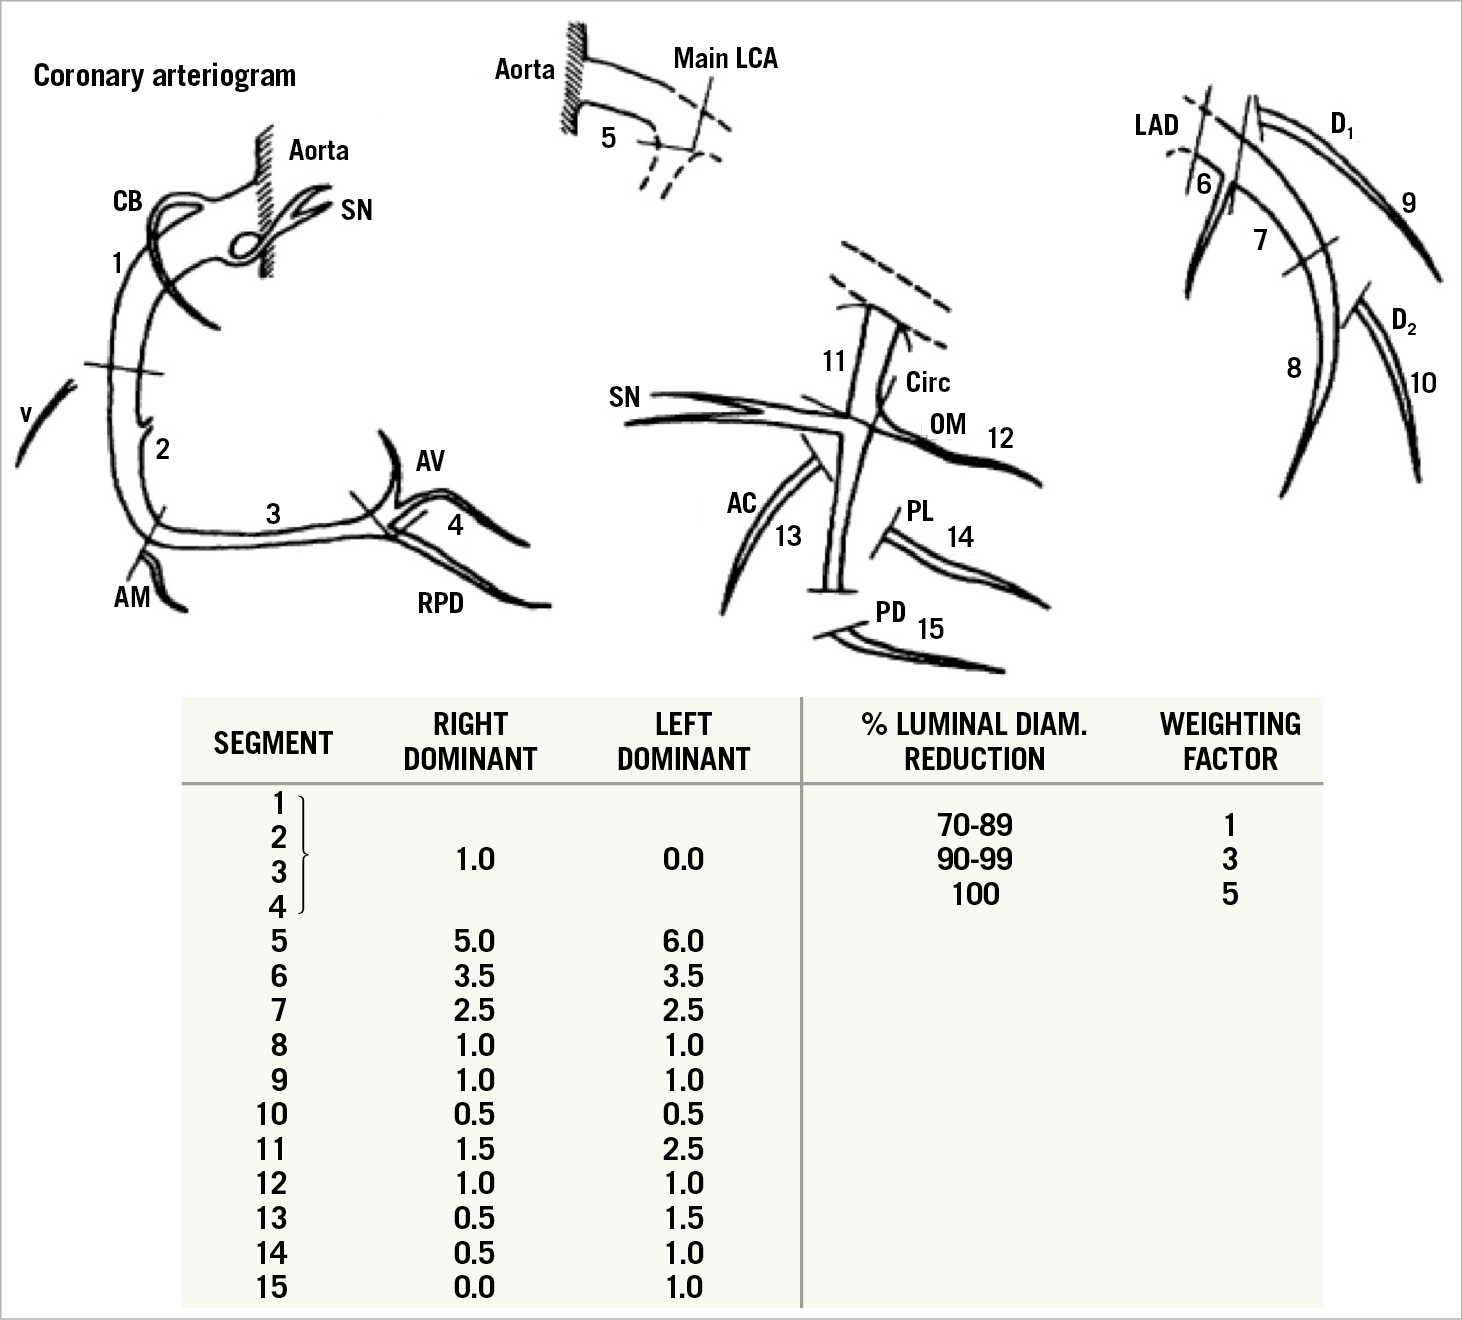
Figure 4. The Leaman score; weighted assessment of the relative and absolute supply of blood to the human left ventricle by each main branch and side branch of the coronary tree. Coronary artery segments and the weighting factor assigned to each segment in the right-dominant and left-dominant coronary artery system. Also, the percent luminal diameter reduction of the coronary artery segment and the weighting factor assigned to the specific percentage reductions. AC: atrial circumflex; AM: acute marginal branches; AV: atrioventricular nodal branch; LAD: left anterior descending: LCA: left coronary artery: OM: obtuse marginal: PD: posterior descending branch; PL: posterolateral branch; RPD: right posterior descending: SN: sinus node branch: V: ventricular branch. Reprinted from Leaman et al41, with permission.
For an understanding of the anatomic SYNTAX score, it is essential to keep that concept in mind; it is essential groundwork that cannot be destabilised by another weight calibration derived, for instance, from the therapeutic impact of a revascularisation approach as investigated in CABG/PCI trials. Indeed, it has been argued that the Leaman score (or the anatomic SYNTAX score) for the left main trunk was “overestimated”, considering the current good PCI prognosis of left main treatment. The opinion related to therapeutic results of trials comparing PCI with CABG is a “disruptive interaction” on an otherwise sound physiologic concept: closure of the left main is almost inevitably associated with a deadly consequence, but fortunately stenting of the left main seldom results in fatal outcome. However, it does not invalidate the intrinsic physiological weight of the left main as a major source of blood supply. One criticism so far not reported is the excessive weight given to the presence of occlusion compared with non-occlusive stenosis. With the progress of chronic total occlusion (CTO) recanalisation and more than 90% success in selected centres, this can possibly be considered overweighted.
By the way, more than 24 years after its creation, the Leaman score was reintroduced in the era of non-invasive CT angiography: a seven-year follow up of 1,196 patients investigated to rule out obstructive CAD by MSCT showed that the worst prognosis was observed in patients with obstructive or non-obstructive coronary artery (NOCA) lesions and a high Leaman score, which, indeed, reflects the diffuse and extensive character of the disease (Figure 5),42.
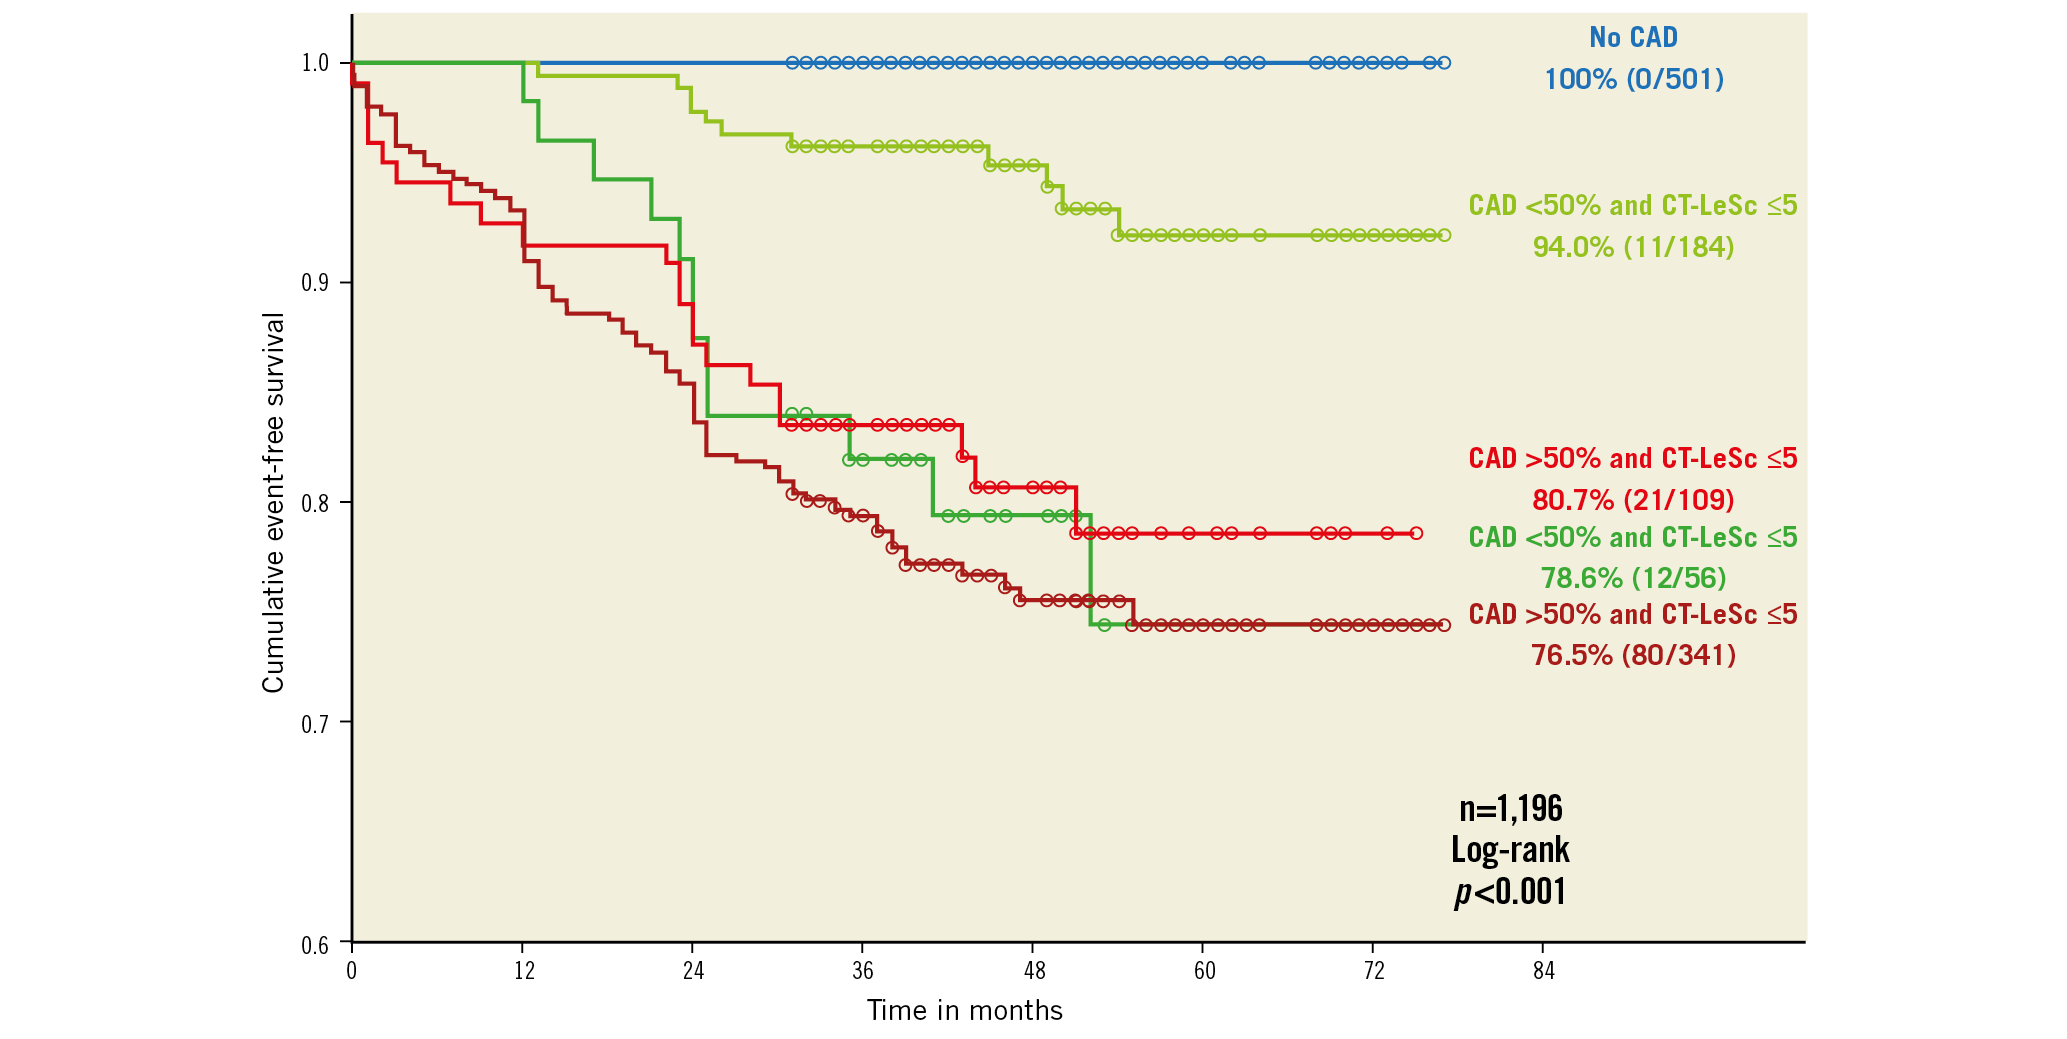
Figure 5. Kaplan-Meier survival curves for hard cardiac events stratified by CAD severity (obstructive versus non-obstructive) and coronary atherosclerotic burden (CT-LeSc >5 vs ≤5). The event-free survival for the patients with non-obstructive CAD and a high (>5) CT-LeSc (78.6%) was similar to that for patients with obstructive CAD and a high CT-LeSc (76.5%; log-rank, p=0.63) and was even numerically lower than that for patients with obstructive CAD and a low CT-LeSc (80.7%; log-rank, p=0.810). CAD: coronary artery disease; CT-LeSC: CT-adapted Leaman score. Reprinted from Mushtaq et al42, with permission.
1979: Pd/Pa ERUPTED INTO OUR CLINICAL WORLD
In the same year (1979) and following the attendance of the second course of Andreas Grüntzig in Zurich, Marcel van den Brand (Marcel van den Brand deceased in 2018) and P.W. Serruys purchased five Grüntzig DG balloons (one 4.2 Fr, two 3.7 Fr and two 3.5 Fr) on behalf of the Thoraxcenter.
Younger generations of interventional cardiologists are probably unaware that coronary angiography during the angioplasty procedure was barely feasible (except that very diluted contrast medium and high injection pressure were used) as soon as the bulky Grüntzig balloon had been inserted in the shaft of the guiding catheter in spite of its large calibre (9.5 Fr O.D.). Therefore, the entire procedure was guided by watching, not the fluoroscopic screen, but two pressure curves on the haemodynamic monitoring screen. Indeed, the central lumen of the Grüntzig balloon allowed the measurement of the pressure at the tip of the balloon catheter (John Simpson had not yet invented the steerable movable guidewire).
In advancing the balloon in the coronaries, we knew that we had crossed the stenotic lesion when Pd/Pa suddenly decreased. In a few cases, Pd/Pa further decreased when the balloon was inflated (recording then a wedge pressure), while, after deflation, Pd/Pa gradient had to disappear immediately and the two pressure curves eventually had to become superimposed … (Figure 6),43. If the pressure curves (Pd/Pa) after balloon deflation remained separated, it was time to call the surgeon…
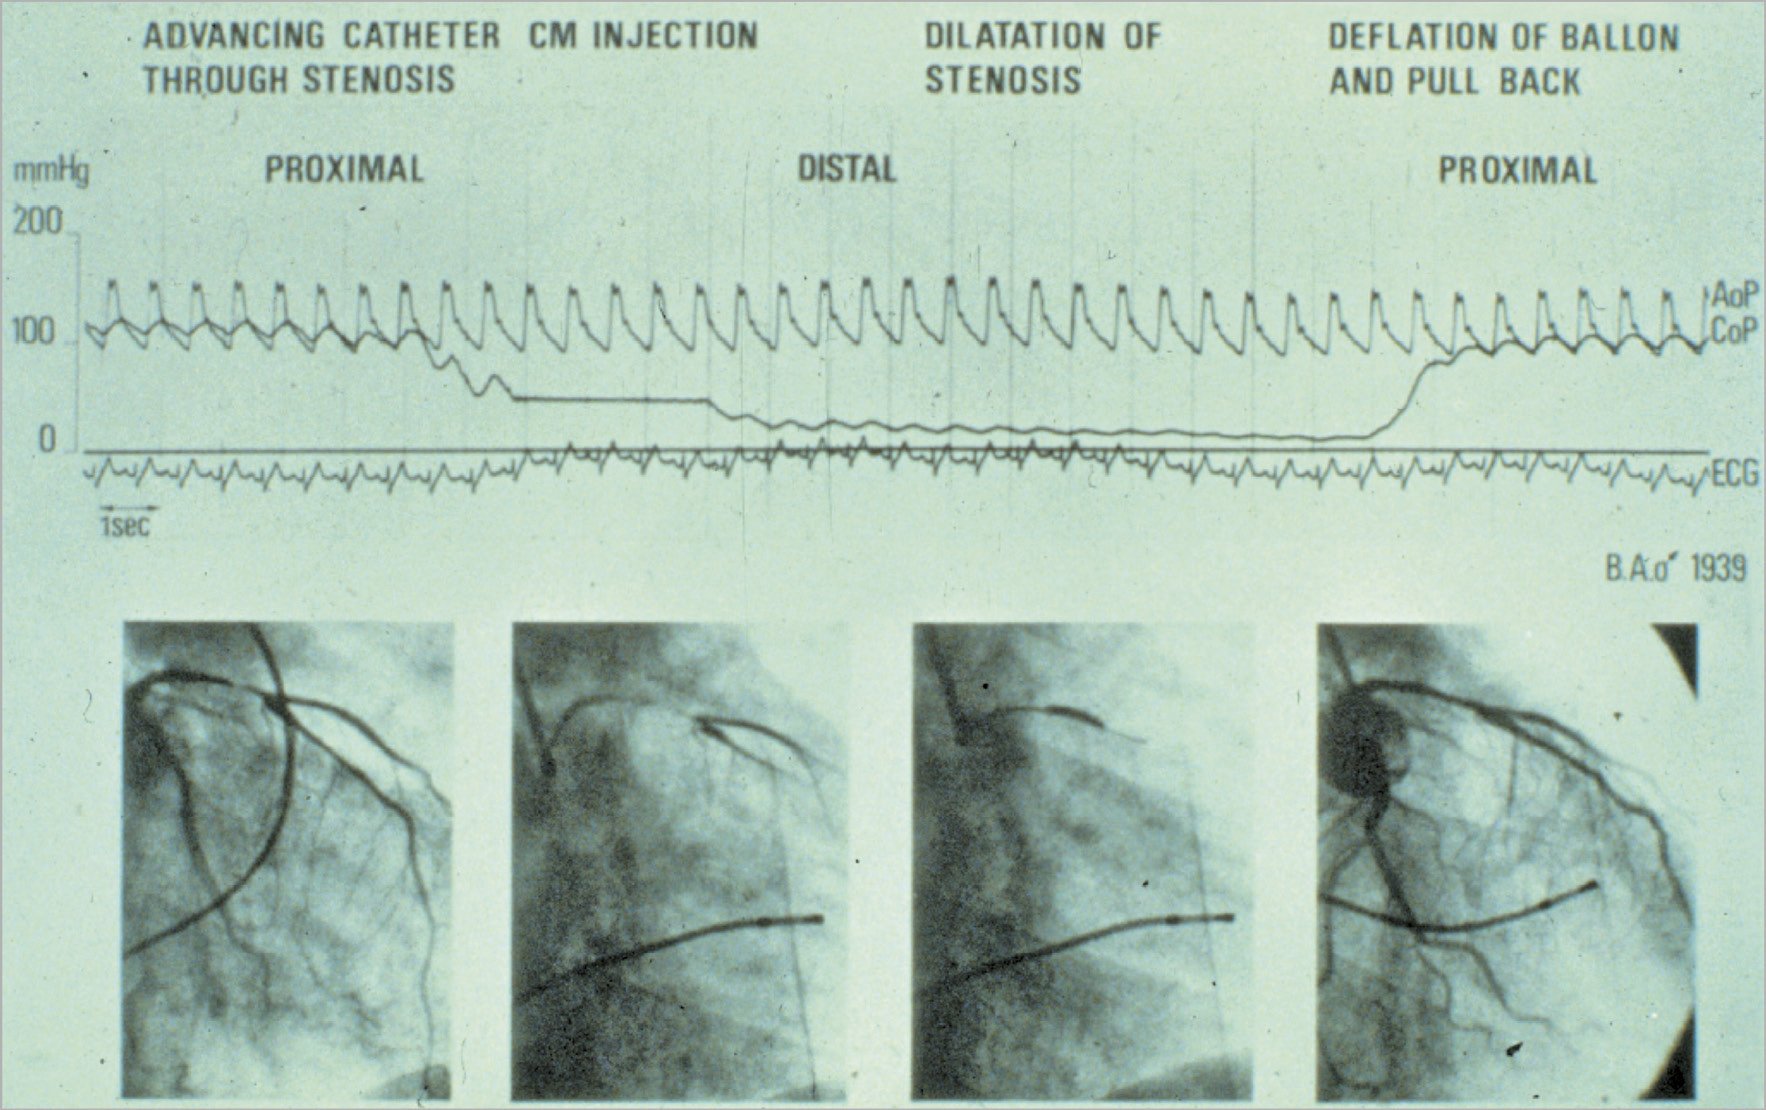
Figure 6. Intracoronary pressure changing during percutaneous transluminal coronary angioplasty. Documentation of pressures during the world’s first coronary angioplasty on 16 September 1977 at the University Hospital of Zurich in Switzerland. The top curve represents the aortic pressure at the tip of the guiding catheter in the coronary cusp (AoP). The bottom curve represents the pressure at the tip of the balloon catheter while in the coronary artery (CoP, damped because of the tiny lumen transmitting the pressure). During advancement of the deflated balloon into the diseased vessel, the distal pressure dropped when the tip of the deflated balloon crossed the stenotic lesion; during the inflation of the balloon the distal pressure further decreased (wedge pressure); at the time of the deflation and in the absence of residual stenosis the tracing of the distal pressure rejoined the curve of the central pressure. This testifies to a good haemodynamic result of angioplasty. Reprinted from Meier B43, with permission from Europa Digital & Publishing.
It was a vivid, life or death “introduction” to the field of Pd/Pa, that would keep us intellectually busy for the four decades to come.
As early as 1985, William Wijns (then in interventional cardiology training at the Thoraxcenter) and P.W. Serruys reported on Pd/Pa, minimal lumen area by quantitative coronary angiography (QCA)44, ST-T changes and thallium scintigraphy during maximal exercise in an era preceding the invention of the velocity and pressure wire. Some of the published figures in Circulation still look very contemporary and would today mislead many young fellows on the historical date of their creation (Figure 7),45.
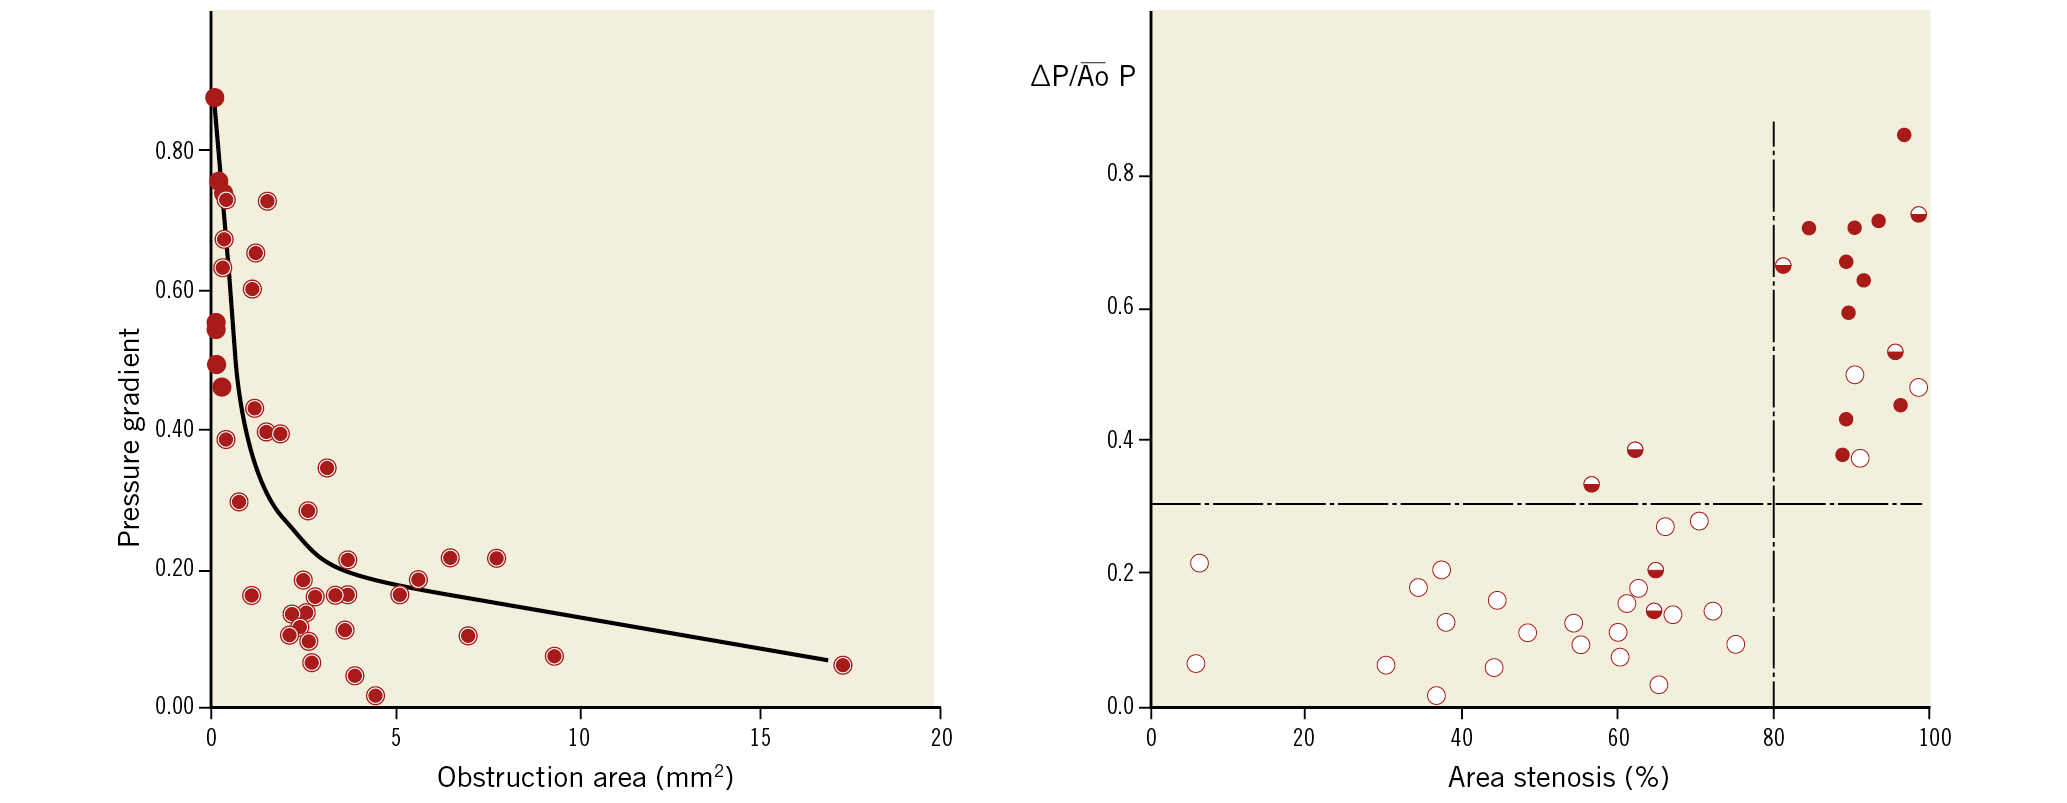
Figure 7. The relationship between pressure gradient across a stenotic lesion, area stenosis and results of thallium scintigraphy during maximal exercise. The relationship between the mean pressure gradient normalised for the mean aortic pressure and the residual obstruction area (in mm2) (after subtraction of the area of the angioplasty catheter) is non-linear; the best fit is obtained by a logarithmic function (r=0.74) (left panel). The relationships among mean normalised pressure gradient, percentage area stenosis, and the results of thallium scintigraphy are shown in the right panel. Open circles represent patients with normal scintigrams (group I, n=25), half-filled circles represent patients with abnormal thallium but normal exercise tests (group II, n=7) and filled circles represent patients with both abnormal thallium and exercise tests (group lII, n=10). Reprinted from Wijns et al45, with permission.
When the paper was flatly rejected by Circulation, the first two authors (W. Wijns and P.W. Serruys) shipped to the journal in small containers all the pressure tracings, all the contour detections of the QCA and all the exercise thallium scintigraphies quantified by, at that time, a brand-new software by Hans Reiber, a brilliant engineer of the bioengineering group at the Thoraxcenter. As a testimony to that shipping, the reader may find in the 1985 publication a footnote informing the readership that they could obtain from the publisher of Circulation – for the modest sum of three dollars– microfilms of all the data reported in the paper… an early version of the “big data and data sharing” era45.
P.W. Serruys believes that, when the group of Eindhoven and Aalst performed their spectacular validation of the FFR concept versus exercise testing, dobutamine stress, and thallium scintigraphy, published in the New England Journal of Medicine46, this probably took W. Wijns’ mind back to that seminal observation made at the Thoraxcenter almost one decade earlier.
Following the publication of W. Wijns and P.W. Serruys and as early as 1988, Poiseuille and Bernoulli resistance values derived from QCA as well as the graphical representation of the Lance Gould equation35, pre and post percutaneous transluminal coronary angioplasty, were available on line in the catheterisation laboratory of the Thoraxcenter and reported in the literature (Figure 8),47. These technical assessments came too early in the history of interventional cardiology, were not disseminated and adopted by the emerging community of interventional cardiologists and were only appreciated by a very small minority of pioneers.
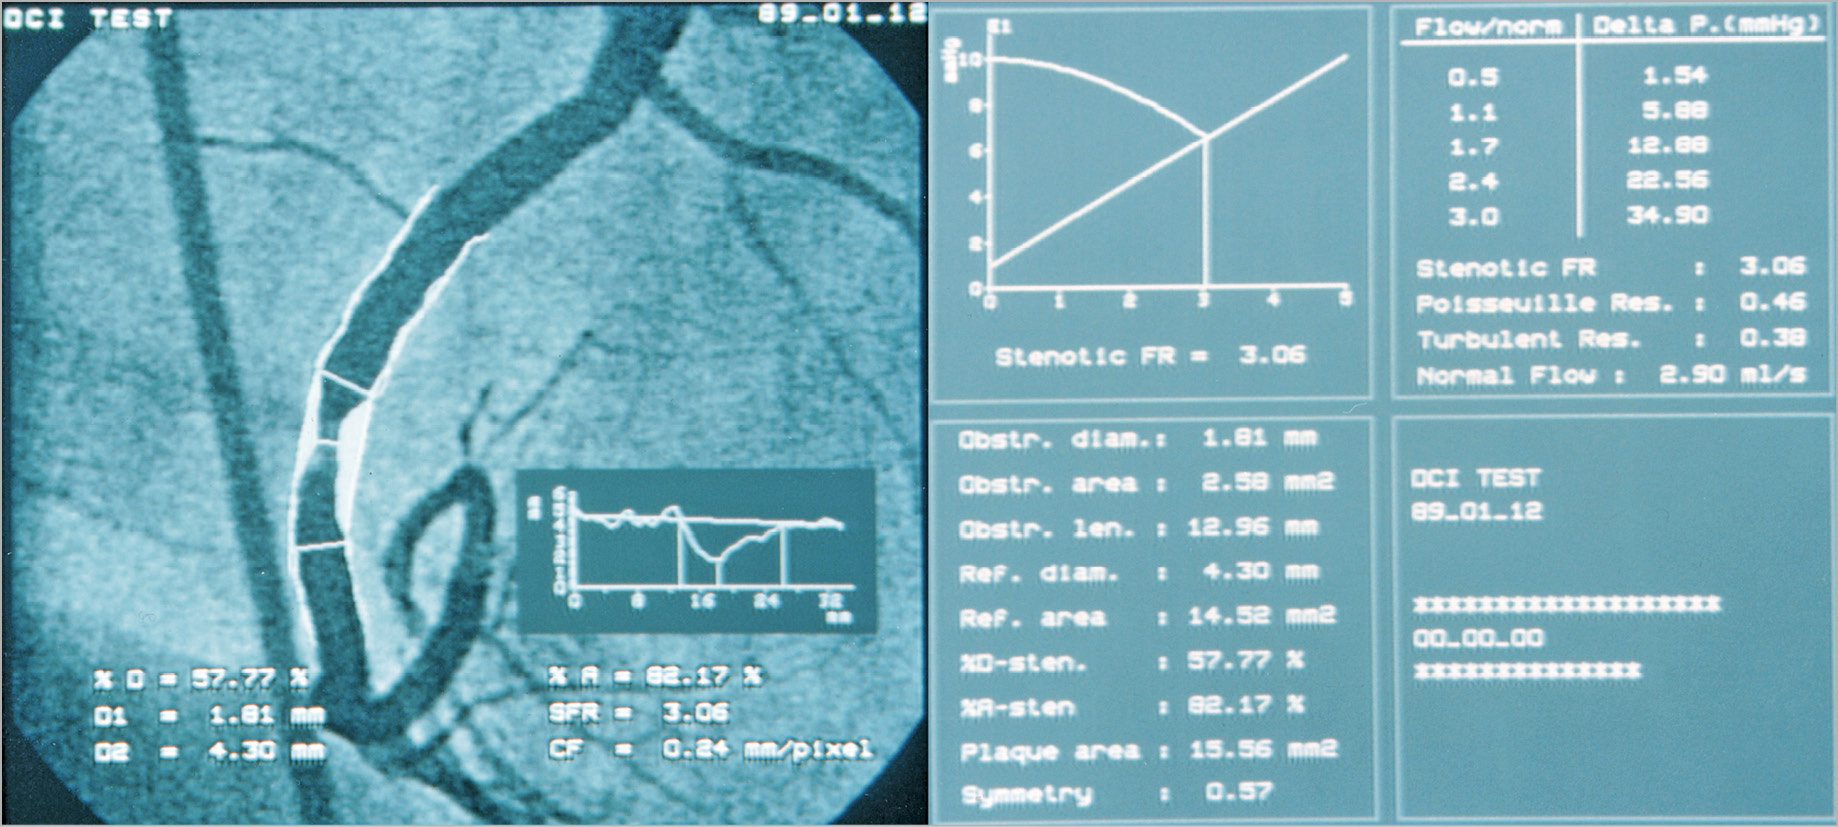
Figure 8. Final result of the analysis of the coronary segment by quantitative coronary angiography. The screenshot (dated 12.01.1989) on the left-hand side shows the automatically detected luminal contours, the interpolated reference diameter, and the diameter function. The screenshot on the right-hand side shows on the vertical axis Pd/Pa dropping with the increase of hyperaemic flow up to the point where the post-stenotic driving pressure becomes the limiting factor in the further increase of the hyperaemic flow (cross point on the diagram depicting the line reflecting the linear relationship between pressure and maximal hyperaemic flow). The stenotic flow reserve (SFR), the Poiseuille resistance, the turbulence resistance and the flow reserve were displayed on the screen, online in the lab. CF: calibration factor; % D; percentage diameter stenosis; D1: minimal lumen diameter; D2: reference lumen diameter; Delta P. (mmHg): difference of pressure between PA (aortic pressure) and Pd (distal coronary pressure); FR: flow reserve; % A: percentage area stenosis; SFR: stenotic flow reserve
FROM YOUNG’S EQUATION TO ANGIOGRAPHICALLY DERIVED FFR
Let us open another parenthesis and illustrate by a cartoon how physiology made its professional entry into percutaneous intervention. When P.W. Serruys left the ranks of the university the master equation for determining a gradient across a stenosis was the Young equation 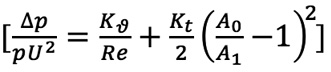 which was simplified as follows:
 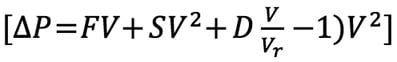 and popularised by L. Gould35 and R.L. Kirkeeide49. In brief, friction of laminar layers of flow at the entry and inside the stenosis and separation of the laminar layers with loss of kinetic energy at the exit of the stenosis (swirling, flow reversal, etc.) were the two major haemodynamic generators of the pressure gradient. Scientists always rediscover the laws of the universe… Daniel Bernoulli (1700-1782) and Jean Léonard Marie Poiseuille (1799-1869) were the Swiss and French physicists who described these principles in the eighteenth and nineteenth century, respectively. For the interventional cardiologists, the excitement mounted with the creation of the velocity wire, that allowed us to measure the coronary flow velocity and the coronary flow reserve. A series of trials using the flow velocity wire and the assessment of coronary flow reserve (DEBATE I, II, DESTINI) were conducted to prove or dismiss the value of provisional balloon angioplasty versus upfront and definitive stenting39,40.
In these trials, the guidance of the procedure relied on the sequential improvement of diameter stenosis assessed by QCA, combined with increase in coronary flow reserve (2.5 threshold) assessed with velocity wire. These trials helped us to demonstrate that upfront and systematic stenting was superior to provisional balloon angioplasty. Three years later (1991), the pressure wire was manufactured in Sweden by Radi Medical Systems and became a powerful tool of research before becoming a clinical device. During his sabbatical time at the Thoraxcenter, Håkan Emanuelsson carried out the first clinical evaluation of the new device50.
For the team at the Thoraxcenter (Carlo di Mario and Javier Escaned were part of the team), combining left ventricular pressure, its first derivative, intracoronary pressure and velocity parameter became an intense topic of clinical investigation and research (Figure 9-Figure 11),51, whereas Nico Pijls used the pressure device as an investigational tool initially to study the collateral circulation in dogs52. Later, together with Bernard de Bruyne and W. Wijns, they formulated the concept of FFR and beautifully validated it as a diagnostic clinical tool, non-inferior to exercise testing, dobutamine stress echocardiography, and thallium scintigraphy. Today these three diagnostic modalities are disregarded as non-specific or non-sensitive! The above-mentioned trials with coronary flow reserve (CFR) and diameter stenosis (DEBATE I, II) were historically posterior to the creation of the FFR concept in 1996 (Figure 9), but for the pioneers of FFR numerous years of hard work were needed to demonstrate the good prognostic value of treatment deferral when the stenosis was physiologically non-significant (DEFER53, FAME I54 and FAME II studies55).
Figure 9. A helicopter view of the field of coronary physiology, its development and ramifications. Adapted from Echavarria-Pinto et al51. With permission from Europa Digital & Publishing.
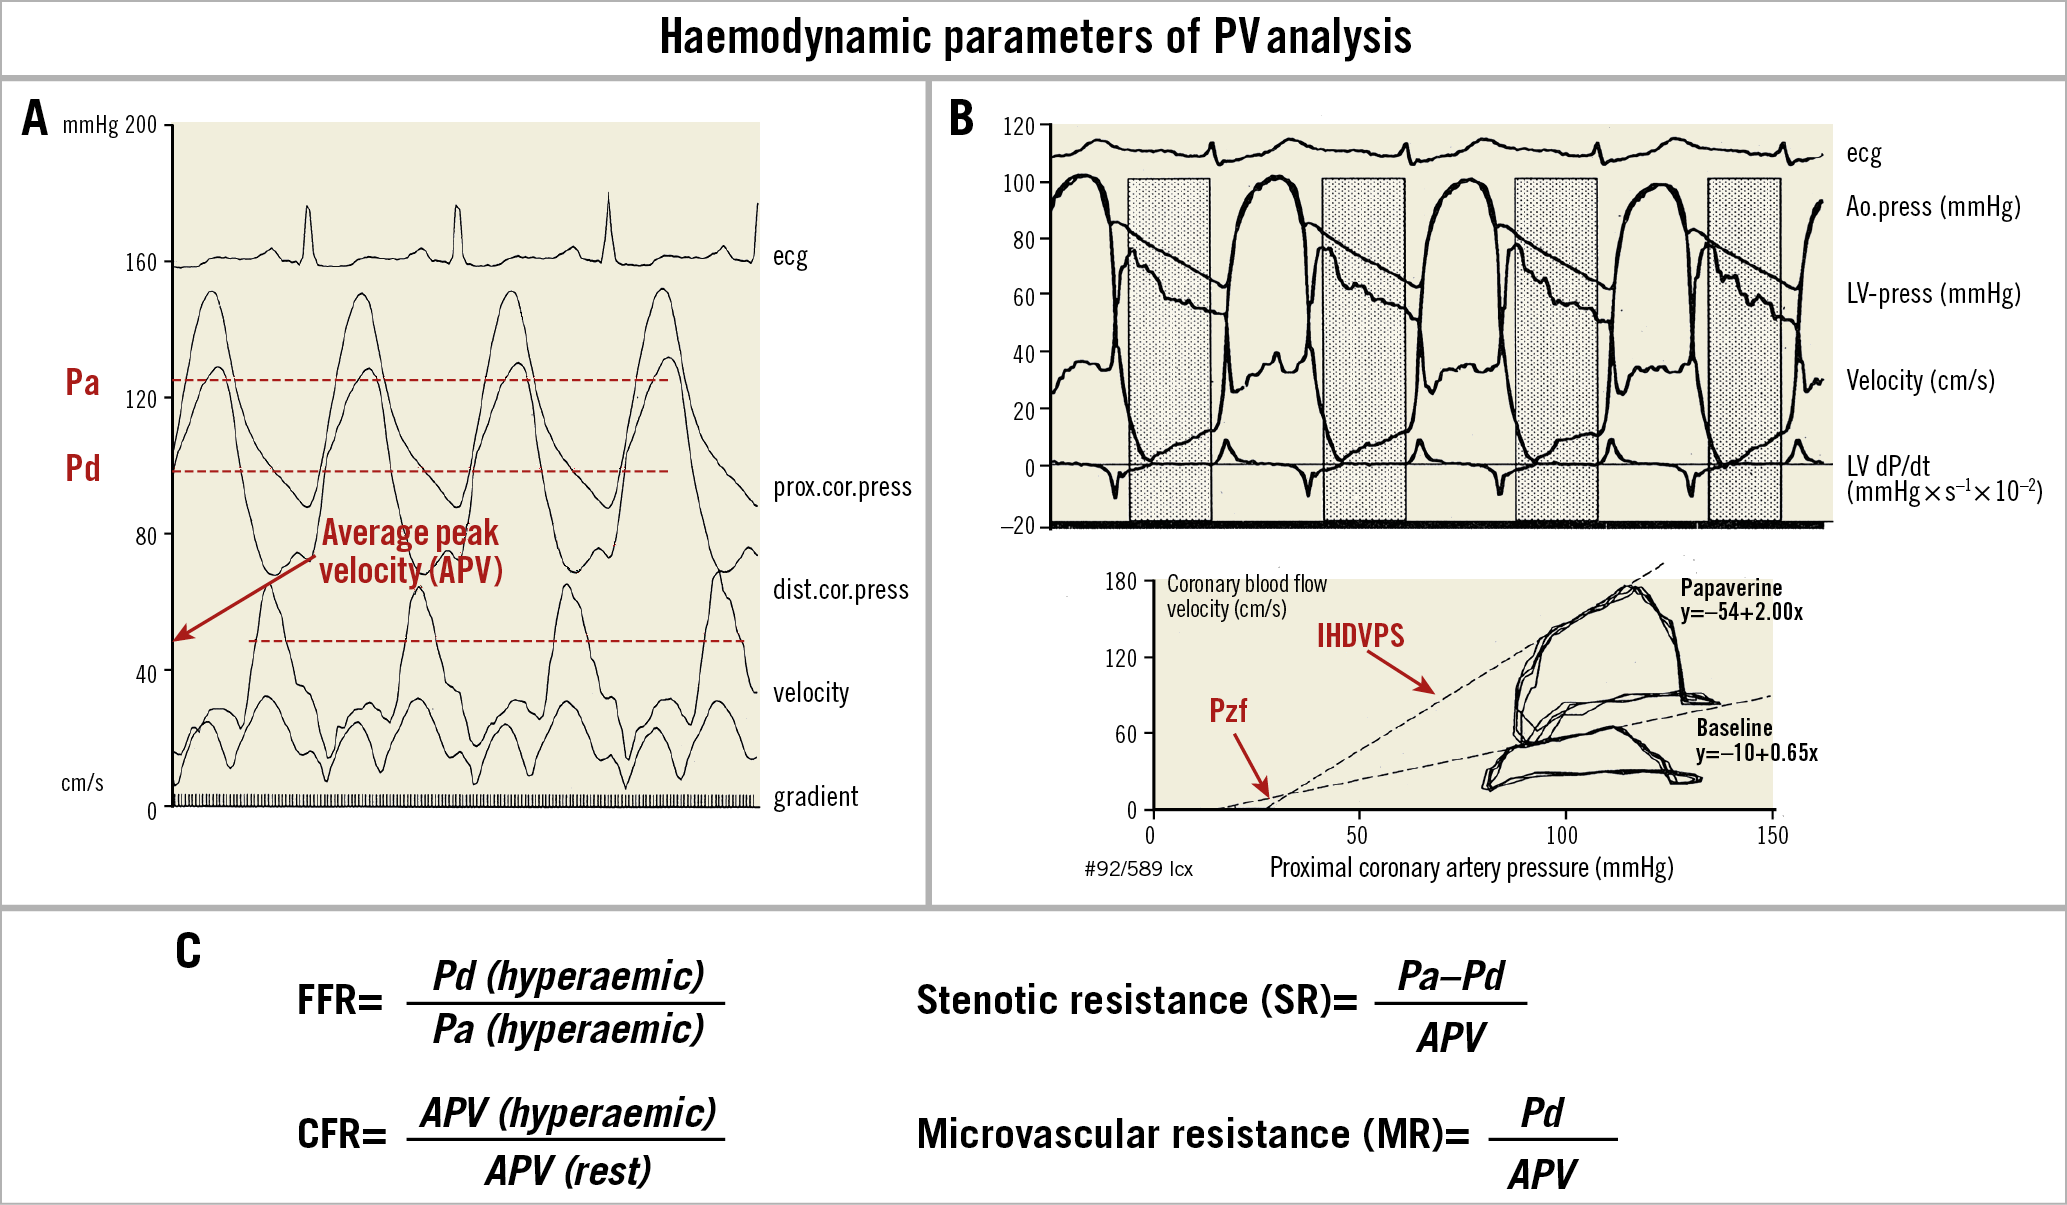
Figure 10. Pressure-velocity analysis and haemodynamic parameters (the 1993 approach). A) From top to bottom: electrocardiogram (ecg), proximal coronary pressure (prox.cor.press) recorded through the guiding catheter (mmHg), distal coronary pressure (dist.cor.press) recorded with a tip-mounted pressure guidewire (mmHg), coronary flow velocity recorded with a Doppler guidewire (cm/s), and instantaneous transstenotic pressure gradient (mmHg) recorded with a pressure wire. Note that the systolic/diastolic changes in flow velocity correspond to the phasic variations of the transstenotic gradient, with the maximal velocity and gradient in proto-mid-diastole. B) Upper panel from top to bottom: electrocardiogram (ecg), aortic pressure (Ao.press; tip manometry), left ventricular pressure (LV-press; tip manometry), coronary blood flow velocity (Doppler guidewire), and first derivative of the left ventricular pressure (dP/dt). The dotted areas indicate the intervals (a precursor of the instantaneous wave-free ratio) used for the analysis of the pressure/flow velocity relation from the digitised pressure and flow velocity (starting point, 20 msec after peak negative dP/dt, endpoint: left ventricular end-diastolic pressure/upstroke of the positive left ventricular dP/dt). Lower panel: velocity/pressure loops of three consecutive cardiac cycles superimposed (clockwise rotation) in baseline conditions and at the peak effect of papaverine. The regression lines (IHDVPS – index of hyperaemic diastolic velocity pressure slope) calculated in the mid-late diastolic phases are displayed and extrapolated up to the zero-flow pressure (Pzf). C) Equations to calculate fractional flow reserve (FFR), coronary flow reserve (CFR), stenotic resistance (SR) and microvascular resistance (MR). Adapted from Serruys et al36, with permission.
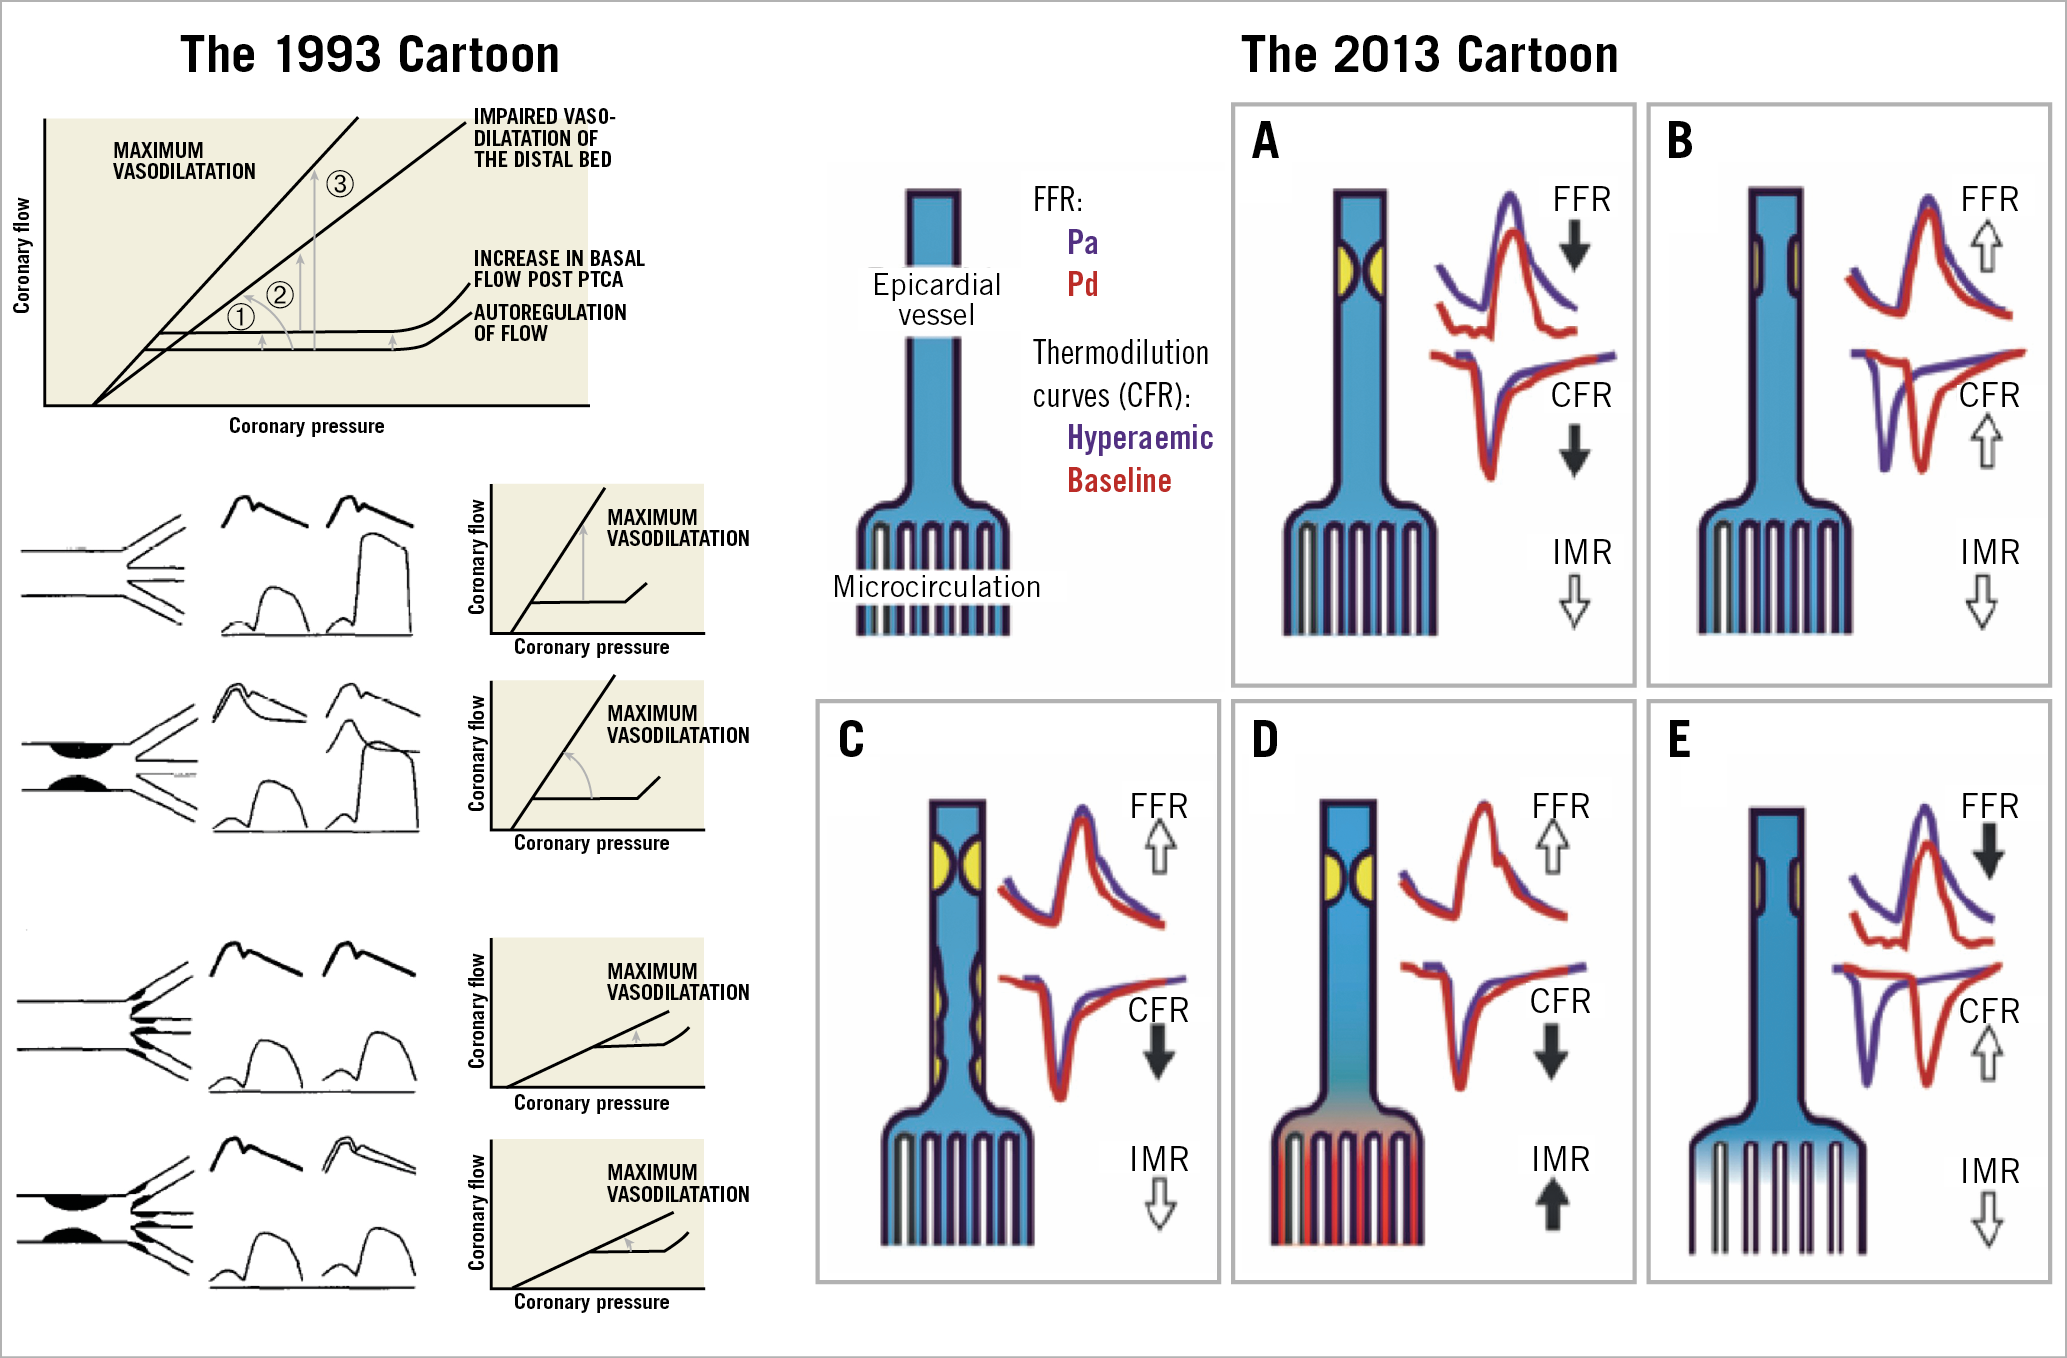
Figure 11. Relation between coronary flow and pressure and coronary haemodynamic patterns in resting and hyperaemic conditions. Left panel shows the illustration from Serruys et al in the American Journal of Cardiology 199336. Upper part, flow/pressure relation in resting and hyperaemic conditions according to the description of Klocke73. Three confounding factors may obscure the interpretation of the change in coronary flow reserve following a percutaneous transluminal coronary angioplasty procedure: (1) an increase in resting blood flow; (2) acute or chronic changes in the flow/pressure relation during hyperaemia; (3) alteration of the severity of the stenotic lesion treated by balloon angioplasty. Lower part, from top to bottom, an example of normal epicardial artery with normal distal vascular response and of a significant epicardial stenosis inducing a pressure gradient in baseline and hyperaemic conditions and an impaired coronary flow reserve. The presence of an abnormal distal vascular response (last two series of diagrams) minimises the changes in the transstenotic pressure gradient and in maximal flow observed with and without an epicardial stenosis. Right panel shows the schematic representation of the coronary haemodynamic patterns documented 20 years later by Echavarria-Pinto et al69. A) Vessel with concordantly abnormal FFR and CFR and normal (low) index of microcirculatory resistance (IMR). B) Vessel with a non-severe focal stenosis without associated diffuse atherosclerotic narrowing (DAN) or microcirculatory dysfunction (MCD). C) Vessel with a focal stenosis and DAN. Despite a normal FFR, an abnormal CFR with low IMR suggests that diffuse epicardial atherosclerosis is the predominantly affected compartment. D) Stenosis with normal FFR and abnormal CFR. At difference with the case shown in C, the presence of MCD, and not DAN, may account for the discrepancy between FFR and CFR. E) Vessel with a stenosis that, despite showing an abnormal FFR, has preserved CFR as a result of well-preserved microcirculation and absence of significant DAN. Reprinted from Serruys et al36 and Echavarria-Pinto et al69, with permission.
With the advent of FFR, the classic 2D QCA was progressively discredited, if not ridiculed. To be honest, P.W. Serruys did not pay too much attention to this denigrating process since his clinical work was dedicated to the promotion of the emerging stent technology following the clinical success of the BENESTENT trial in 199456. Today, it is somewhat ironic to see a colour-coded, pseudo 3D QCA (an elliptical surface derived from two diameters not even orthogonal), with quantitative flow ratio being embraced as a good surrogate for the pressure-derived FFR by pioneers such as W. Wijns, B. de Bruyne, William Fearon and others… (including P.W. Serruys, who fully endorsed their enthusiasm for that methodological approach)18,57,58; besides, the Erasmus University in collaboration with the University of Ioannina was among the first to validate the so-called virtual FFR – FFR estimated from 3D QCA using computational flow dynamic techniques versus the real pressure-derived FFR59. The value of computational flow dynamics (CFD)-derived FFR in the clinical arena is apparent especially in China, India… and the rest of the world which needs a software tool such as angiographically derived FFR, that is less expensive than the pressure wire hardware to justify physiologically PCI treatment in their overpopulated countries.
On the other hand, the anatomic SYNTAX score did benefit from the introduction of physiology in interventional cardiology. The functional SYNTAX score was generated by the “physiologist” interventional cardiologist and became a “must” in the evaluation of three-vessel disease: only flow-limiting stenosis had to be taken into account in the SYNTAX score calculation (Figure 1),12.
In 2010, the FFR pioneers were intellectually destabilised by the introduction of instantaneous wave-free ratio (iFR) originating from the lab of Justin Davies60. Large outcome trials (the DEFINE-FLAIR61 and iFR-SWEDEHEART studies62) trivialised the fierce debate that was progressively evolving at that time between the proponents of iFR and FFR.
In the meantime, but a decade before, another equation (the Navier-Stokes equation) made its entry into the field of cardiology with the use of finite element and shear stress computation and simulation63. The Navier-Stokes equations describe the fluid movement in 3D space based on the law of conservation of energy and mass. By solving the Navier-Stokes equations, the fluid velocities at certain locations can be obtained64. Pressure gradient across an anatomic stenosis was derived using computational fluid dynamic techniques and, thanks to the fundamental work of Charles Taylor, FFR derived from computed tomography angiography (FFRCT) was derived from MSCT and colour coded along the coronary lumen delineated by the MSCT65.
The colour-coded 3D MSCT image inspired the companies that used to quantify 2D contours on coronary cineangiograms. Two angiographic views separated by more than 25-degree projection were considered as theoretically sufficient to create a pseudo 3D angiogram. To apply to this 3D lumen the simple equation of Gould (pseudo CFD)59,66 or the complex Navier-Stokes equation (true CFD)67 was then a technical “piece of cake”. From then on, everybody could have their own angiographically derived FFR or FFRCT without instrumenting the coronary artery with a pressure wire, and the functional SYNTAX score became a firmly established entity. In 2017, the National Institute for Health and Care Excellence (NICE) recommended FFRCT in their clinical pathway for the assessment and diagnosis of patients with suspected stable angina68.
Over the years, many investigators (e.g., Jan J. Piek, J. Escaned, Mauro Echavarria-Pinto) have emphasised the need to combine FFR and CFR (as we did originally) to elucidate fully whether ischaemia is related to the altered conductance of the major epicardial vessel or the altered resistance of the microvasculature or both (Figure 11). Multiple areas of concordance, discordance, positive and negative mismatch between FFR and CFR have been clearly identified by these authors (Figure 12),69.
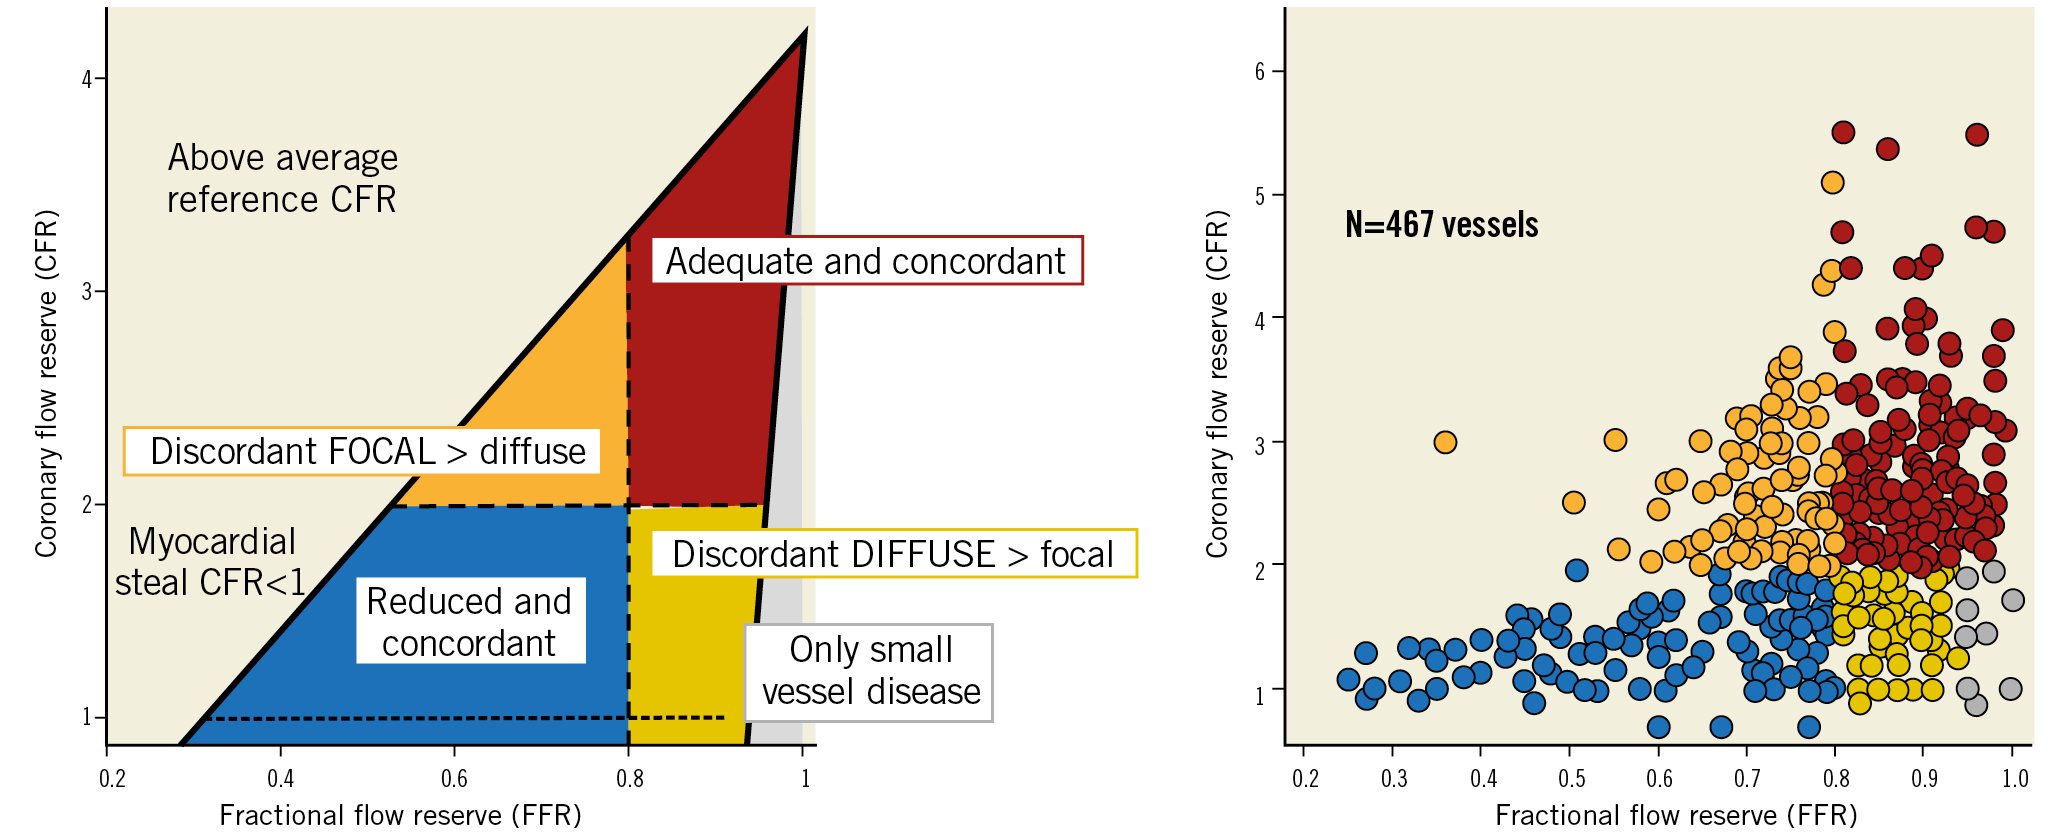
Figure 12. Combined use of intracoronary pressure and flow to assess ischaemic heart disease. Left panel shows the conceptual plot of the coronary flow reserve (CFR) and fractional flow reserve (FFR) relationship showing the four different quadrants. Right panel shows the scatter plot of FFR and CFR relationship across 467 vessels (299 investigated with Doppler-derived flow and 168 with thermodilution-derived flow) with intermediate stenosis evaluated with pressure and flow sensors, at Hospital Clinico San Carlos, Madrid, Spain, and Academic Medical Center-University of Amsterdam, Amsterdam, the Netherlands. Vessels in blue and red were concordantly abnormal (CFR <2 and FFR ≤0.80) and concordantly normal (CFR ≥2 and FFR >0.80), respectively. Vessels in orange exhibited CFR ≥2 and FFR <0.80, suggestive of predominantly focal disease. The yellow region contains vessels with CFR <2 and FFR >0.80 suggestive of predominantly diffuse epicardial or microcirculatory disease. Finally, within this region, vessels in grey exhibited only a minor hyperaemic pressure drop (<5 mmHg) suggestive of predominant microcirculatory disease. Adapted from Echavarria-Pinto et al74, with permission.
Today, without pressure/velocity hardware, they (e.g., J. Piek, J. Escaned, M. Echavarria-Pinto…and others) could easily resolve their intellectual dilemma and have, through a single coronary injection of angiographic contrast medium, the simultaneous acquisition of both angiographically derived FFR and CFR. We would not be surprised to see the so-called “Vogel’s technique” being resurrected. This digital angiographic technique was introduced by Vogel et al in 1984 to measure CFR using the myocardial contrast appearance time from a simple electrocardiography-triggered coronary angiogram70. The method quantified the time of the contrast medium appearance in the major epicardial vessel divided by the change in density of the contrast medium in the myocardium at baseline and maximal hyperaemia. Therefore, the operator could evaluate, online in the lab, the CFR derived from conventional angiography71 (Figure 9, bottom right). The question is … who in the industry will close the loop and jump back to this technical opportunity, “Vogel’s technique”, that used to be an online software in the cine-fluoroscopic system of Philips71.
Appendix. Authors’ affiliations
1. NHLI, Imperial College London, London, United Kingdom; 2. Amsterdam UMC, University of Amsterdam, Heart Center, Department of Clinical and Experimental Cardiology, Amsterdam Cardiovascular Sciences, Amsterdam, the Netherlands; 3. Cardiology Unit, Department of Internal Medicine, Faculty of Medicine, Prince of Songkla University, Songkhla, Thailand; 4. Department of Internal Medicine, Cardiology Division, University of Campinas (UNICAMP), Campinas, Brazil; 5. Milton Hershey Medical Center, Penn State Heart and Vascular Institute, Hershey, PA, USA; 6. Department of Radiology, Division of Image Processing, Leiden University Medical Center, Leiden, the Netherlands; 7. Astra Charnwood Clinical R & D, Loughborough, United Kingdom; 8. Division of Structural Interventional Cardiology, Careggi University Hospital, Florence, Italy; 9. Department of Cardiology, Catharina Hospital, Eindhoven, the Netherlands; 10. Department of Biomedical Engineering, -Eindhoven University of Technology, Eindhoven, the Netherlands; 11. Cardialysis BV, Rotterdam, the Netherlands; 12. Department of Cardiology, Bern University Hospital, Bern, Switzerland; 13. University Hospital of Wales, -Cardiff, United Kingdom; 14. Department of Public Health, Erasmus University Medical Center, -Rotterdam, the Netherlands: 15. Division of Cardiology, Cardio-Thoracic-Vascular Department, Azienda Ospedaliero Universitaria “Policlinico-Vittorio Emanuele”, -Catania, Italy; 16. Centro Cardiologico Monzino, IRCCS, Milan, Italy; 17. Department of Clinical Sciences and Community Health, University of Milan, Milan, Italy; 18. Department of Cardiology, Barts Heart Centre, Barts Health NHS Trust, London, United Kingdom; 19. Oxford Heart Centre, Oxford University Hospitals NHS Foundation Trust, Oxford, United Kingdom; 20. Department of Cardiology, Hospital Clinico San Carlos, Madrid, Spain; 21. HeartFlow, Redwood City, CA, USA; 22. GE Healthcare, Waukesha, WI, USA; 23. Cardiovascular Center Aalst, OLV Clinic, Aalst, -Belgium; 24. Department of Biomedical and Clinical Sciences “Luigi Sacco”, University of Milan, Milan, Italy; 25. Biomedical Image Analysis Group, Department of Computing, Imperial College London, -London, United Kingdom; 26. Cardiovascular Research Foundation, New York, NY, USA; 27. The Zena and Michael A. Wiener Cardiovascular Institute, Icahn School of Medicine at Mount Sinai, New York and the Cardiovascular Research Foundation, New York, NY, USA; 28. Department of Cardiology, Thoraxcenter, Erasmus Medical Center, Rotterdam, the Netherlands
Guest Editor
This paper was guest edited by Alec Vahanian, MD, PhD; Department of Cardiology, Hôpital Bichat-Claude Bernard, and University Paris VII, Paris, France.
Acknowledgements
We wish to acknowledge all those who contributed to the SYNTAX score.
Conflict of interest statement
P.W. Serruys reports personal fees from Abbott Laboratories, AstraZeneca, Biotronik, Cardialysis, GLG Research, Medtronic, Sino Medical Sciences Technology, Société Europa Digital & Publishing, Stentys France, Svelte Medical Systems, Philips/Volcano, St. Jude Medical, Qualimed, and Xeltis, outside the submitted work. P. Chichareon reports a research grant from Biosensors outside the submitted work. R. Modolo has received research grants from Biosensors outside the submitted work and from the Sao Paulo Research Foundation (FAPESP - grant number 2017/22013-8). N. Pijls has received institutional research grants from Abbott, Hexacath and HeartFlow, is a consultant for Abbott, Opsens, and GE Healthcare, and possesses equity in Philips, HeartFlow, and ASML. M. Valgimigli reports grants and personal fees from Abbott, Terumo and AstraZeneca, personal fees from Chiesi, Bayer, Daiichi Sankyo, Amgen, Idorsia, Alvimedica, Biosensors, CoreFlow, Vifor and Bristol-Myers Squibb, and grants from Medicure, outside the submitted work. J. Davies reports grants, personal fees and other from Philips Volcano, outside the submitted work; in addition, J. Davies has a patent iFR with royalties paid by Philips Volcano to Imperial College London. A. Banning is partially supported by the NIHR Oxford Biomedical Research Centre and reports grants from Boston Scientific and personal fees from Boston Scientific, Medtronic and Abbott Vascular, during the conduct of the study. J.J. Piek reports non-financial support from Abbott Vascular and personal fees and non-financial support from Philips/Volcano, outside the submitted work. B. Thomsen is an employee of GE Healthcare. B. Glocker reports grants from HeartFlow and the European Commission, during the conduct of the study, personal fees from Kheiron Medical Technologies, Definiens, Axon Advisors and GlaxoSmithKline, grants from UKRI, EPSRC, Innovate UK, and MRC/NIHR, outside the submitted work. C. Collet reports grants and personal fees from HeartFlow Inc, and personal fees from Philips and Abbott Vascular, outside the submitted work. G.W. Stone reports personal fees from Terumo, Amaranth, Shockwave, Valfix, TherOx, Reva, Vascular Dynamics, Robocath, HeartFlow, Gore, Ablative Solutions, Matrizyme, Miracor, Neovasc, V-wave, Abiomed, Claret, Backbeat, Sirtex and MAIA Pharmaceuticals, personal fees and other from Ancora, Qool Therapeutics and SpectraWave, other from Cagent, Applied Therapeutics, Biostar family of funds and MedFocus family of funds, outside the submitted work; Columbia University, his employer, receives royalties from Abbott for sales of the MitraClip. Y. Onuma reports being a member of the advisory board of Abbott Vascular. C. Taylor reports being a shareholder in and an employee of HeartFlow. The other authors have no conflicts of interest to declare. The Guest Editor is a consultant for Edwards Lifesciences.
Supplementary data
To read the full content of this article, please download the PDF.