Abstract
Aims: Introduction of a novel contrast injection protocol during rotational C-arm CT (RCT) in cardiac catheterisation of patients with aortic stenosis for aortic root assessment.
Methods and results: Fifty-two patients underwent RCT imaging with contrast injection performed either into the aorta (Ao-RCT, n=25) or into the left ventricle (LV-RCT, n=27). Aortic annulus diameters were assessed in a multiplanar reconstruction view and compared with corresponding multidetector computed tomography (MDCT). LV contrast injection additionally enabled measurement of the left ventricular outflow tract (LVOT). LV-RCT improved the accuracy of annulus measurements and correlated well with MDCT data in comparison with Ao-RCT and MDCT (r=0.91, r=0.76, respectively). The Bland-Altman analysis showed smaller differences in MDCT and LV-RCT annulus measurements than between MDCT and Ao-RCT (LV-RCT: mean=0.4 mm, limits of agreement –1.5-2.3 mm vs. Ao-RCT: mean=0.1 mm, limits of agreement –3.4-3.6 mm). The inter-observer agreement for the annulus measurements was significantly increased for LV-RCT as calculated by the intra-class coefficient (ICC=0.85) in comparison with Ao-RCT (ICC=0.52).
Conclusions: Cardiac catheterisation including LV-RCT offers complementary assessment of left ventricular function, aortic valve anatomy, coronary angiography and arterial access routes. LV-RCT for aortic root measurements shows better correlation to MDCT than standard Ao-RCT protocols.
Abbreviations
Ao-RCT: aortic injection rotational C-arm CT
CI: confidence interval
CTA: computed tomography angiography
LCA: left coronary artery
LV: left ventricle
LVOT: left ventricular outflow tract
LV-RCT: left ventricular injection rotational C-arm CT
MDCT: multidetector computed tomography
MPR: multiplanar reconstruction
RCA: right coronary artery
RV: right ventricle
RVP: rapid ventricular pacing
SAVR: surgical aortic valve replacement
STJ: sinotubular junction
TAVI: transcatheter aortic valve implantation
Introduction
TAVI is an established treatment option for patients with severe aortic stenosis ineligible or at high risk for conventional aortic valve replacement surgery (SAVR)1. The diagnostic pre-procedural work-up encompasses echocardiography, cardiac multidetector computed tomography (MDCT) and cardiac catheterisation. These imaging modalities for visualisation of the aortic root key areas (Figure 1A) complement each other with their individual strengths and weaknesses (Figure 1B)2. Objectives for optimal imaging strategies are to minimise complications such as prosthesis mismatch, annulus rupture or severe aortic regurgitation. MDCT shows excellent inter- and intra-observer variability of annular measurements and has therefore been recommended for routine pre-procedural screening3,4, according to current guidelines5. Rotational C-arm imaging (RCT) during cardiac catheterisation could be a new and complementary method for aortic root assessment combining multiplanar three-dimensional (3D) imaging with haemodynamic assessment, but recent studies have identified significant discrepancies in the measurement of aortic annulus diameters6,7. Furthermore, RCT imaging is based on aortic root injection protocols, which do not provide opacification of the subvalvular anatomic structures. Therefore, the aims of our study were: 1) to evaluate different protocols of RCT during cardiac catheterisation and to compare these with the “gold standard” reference imaging modality MDCT; and 2) to show that left ventricular contrast injection during RCT with rapid ventricular pacing (RVP) is feasible (Moving Image 1), enables reliable aortic valve annulus measurements and allows the assessment of the left ventricular outflow tract (LVOT).
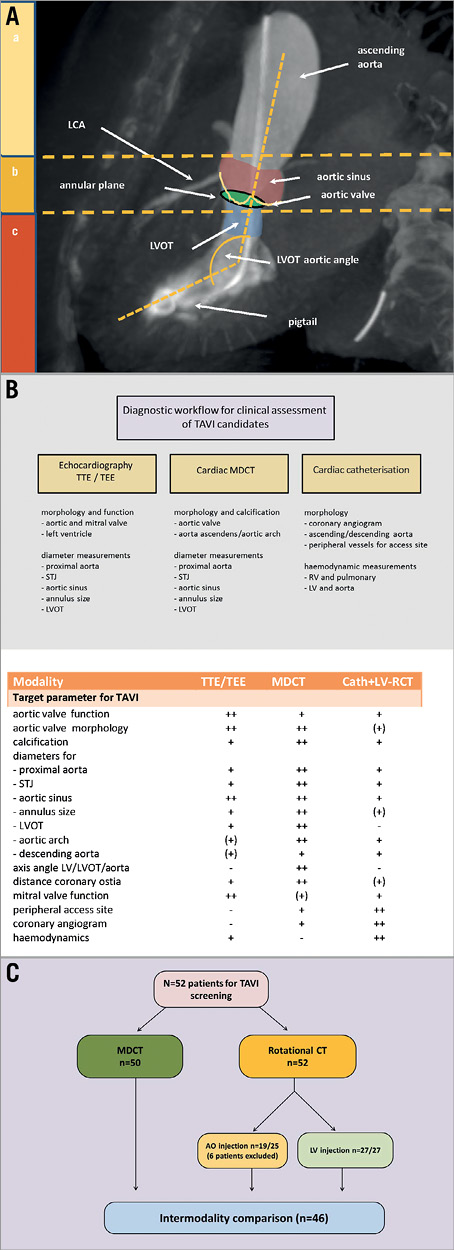
Figure 1. Multimodality imaging of aortic valve region. A) Scheme of key areas of the aortic root assessment for prosthetic valve selection at their different anatomic levels: a) ascending aorta, b) aortic root, and c) subvalvular structures. B) Diagnostic workflow for TAVI/SAVR candidates with table below illustrating each modality’s advantages/disadvantages. C) Flow chart of study design.
Methods
STUDY POPULATION
Fifty-two patients (25 male; mean age 81 years) with severe aortic stenosis underwent cardiac catheterisation with RCT prior to planned TAVI/SAVR procedure. Patients were allocated to either the supravalvular or the subvalvular contrast injection protocol by random order (Figure 1C). As part of the diagnostic screening, cardiac CT was performed with an interval of at least two days to the cardiac catheterisation to prevent high-volume contrast exposure. The study was approved by the local ethics committee (Study No. 4080, international registration NCT01805739), and all patients gave written informed consent.
C-ARM CT ACQUISITION PROTOCOL
RCT was performed following coronary angiography (Allura FD20, 30 cm flat panel detector; XperCT option; Philips Healthcare, Andover, MA, USA). The parameters for the RCT were as follows: C-arm propeller rotation of 210° within 5.2 s and 60 frames/s. Number of projections 312 with 120 kV and automatic tube current modulation of 50-325 mA. The standard product image reconstruction settings were used (matrix size 256×256×198) with an isotropic resolution of 0.98 mm³. Contrast medium (Accupaque 350; Bracco Imaging, Konstanz, Germany) diluted 1:1 with saline to a total volume of 0.8 ml per kg patient’s weight (50-80 ml) was administered with a flow rate of 14 ml/s (pressure 800 psi, rise time 0.5 s). RVP was performed by a balloon-tipped pacing catheter located in the right ventricle. The acquisition sequence was: 1) RVP at 200 bpm with simultaneous injection of the contrast medium, and 2) C-arm rotation with a delay of 1 s after contrast injection (Moving Image 2). The injection site was either supravalvular into the aortic root (Ao-RCT) or subvalvular into the left ventricular cavity (LV-RCT) via a pigtail catheter. RCT was conducted during inspiratory breath hold with patients’ arms positioned upwards.
MDCT PROTOCOL
All examinations were performed on a 128-row multidetector CT scanner (SOMATOM Definition AS+; Siemens Healthcare, Forchheim, Germany) in supine position (arms up) during inspiratory breath hold. After initial scout images, a timing bolus scan at the level of the aortic root was performed with 20 ml of iodinated contrast agent (Imeron 400™; Bracco Imaging) at a rate of 4 ml/s followed by a 20 ml saline flush. Cardiac CTA was obtained using a bolus of contrast with a volume of 60-75 ml power-injected at 4 ml/s followed by a 40 ml saline flush. A retrospective ECG-gated volume data set was acquired using gated tube current modulation (MinDose “Auto”; Siemens Medical Solutions, Forchheim, Germany). Volume data set was acquired with 128 mm×0.6 mm collimation, a gantry rotation time of 300 ms, a pitch of 0.2, tube voltage of 80-120 kV (attenuation-based tube potential modulation - CARE KV; Siemens), and a reference tube current time product of 150 mAs/rotation (scout-based automatic reference tube current selection - CARE Dose4D™; Siemens). Axial images were reconstructed with a slice thickness of 0.6 mm at a reconstruction increment of 0.5 mm in the best diastolic phase.
IMAGE ANALYSIS
All data sets were post-processed for offline analysis with vendor-independent 3D PACS imaging analysis software (OsiriX MD version 4.0; Pixmeo, Geneva, Switzerland). Two independent, blinded observers, experienced in analysis of cardiac cross-sectional imaging, performed aortic root measurements in MDCT and LV-RCT or Ao-RCT data, using orthogonal multiplanar reformatting (MPR). Each image was graded for overall clarity: 1=non-diagnostic, 2=reduced quality, 3=fair quality, 4=excellent quality. All MDCT studies were analysed at least one week after RCT. The annulus was measured in diastole. All RCT studies were acquired during RVP and aortic root measurements were performed during an uncertain cardiac phase but typically with minimally opened valve.
DEFINITION OF ANNULUS PLANE AND AORTIC ROOT MEASUREMENTS
For annulus plane definition we used the basal virtual ring model proposed by Piazza8. The correct axis for the annulus measurement was obtained by a double oblique projection view in the volume data set in MPR as displayed in Figure 2A and Figure 2B. The sagittal plane (green) of the aortic root was set in each data set by convention through the centre of the right aortic cusp. The coronal plane (blue) was set exactly perpendicular to the sagittal plane. The vertical angle of the sagittal and coronal plane was set in approximation most parallel to the course of the aortic root and the left ventricular outflow tract. The correct height of the annulus plane, critical for the exact measurement of the diameter, was defined by the three lowest points (nadir) of each valve cusp (“hinge points”) as described in the SCCT guidelines5. At this height, the annulus diameter was measured in the sagittal (short axis) and coronal (long axis) views (Figure 3). As the coronary cusps can differ considerably in size, the annulus plane defined by the three hinge points is sometimes substantially tilted in relation to the aortic axis. To avoid distortion of the short- and long-axis measurements, the annulus plane was corrected in respect to the parallel orientation axis of the aorta and the LVOT. The non-circularity of the annulus was graded by an eccentricity index, defined as: maximum diameter divided by minimum diameter. The annulus area was additionally determined by planimetry. The aortic sinus was measured at the maximum diameter of the aortic root. The sinotubular junction (STJ) was defined by the minimal diameter above the aortic sinus. The width of the ascending aorta was measured 2 cm above the STJ. All measurements were performed in sagittal and coronal planes and averaged values were calculated. The LVOT area was measured by planimetry 5 mm beneath the annulus height in MDCT and LV-RCT studies. The minimal distance of the left and right coronary artery to the annulus plane was determined in the vertical axis view in all MDCT and RCT data sets.
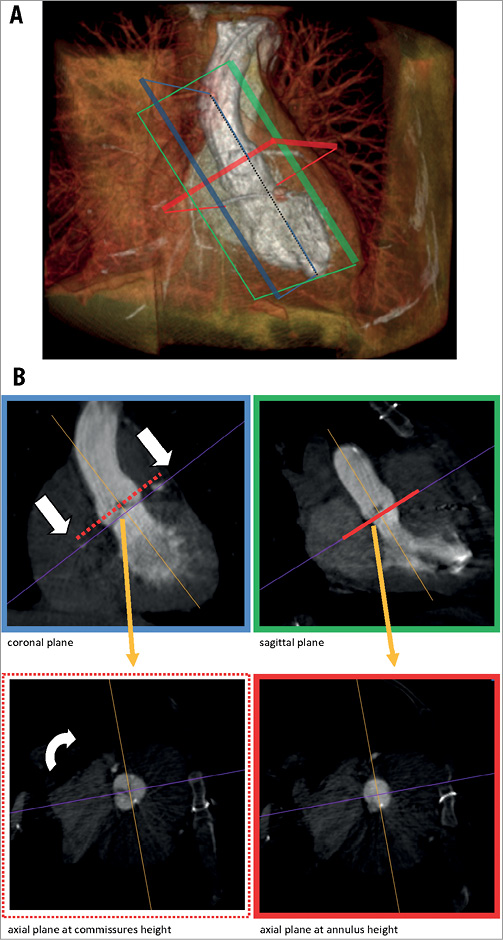
Figure 2. Concept of RCT for aortic root assessment. Volume rendering of a rotational CT. Imaging cross-sections are displayed in green (coronal), blue (sagittal) and red (axial). B) shows the imaging planes in reference to A) resolved in a multiplanar reconstruction view (MPR), for the coronal/LAO 60° (green) and sagittal/RAO 30° axis (blue). The axial plane perpendicular to the aortic root is set from the height of the commissures (red dotted line) to the nadirs of the aortic valve cusps (red line) to enable the exact measurement of the annulus.
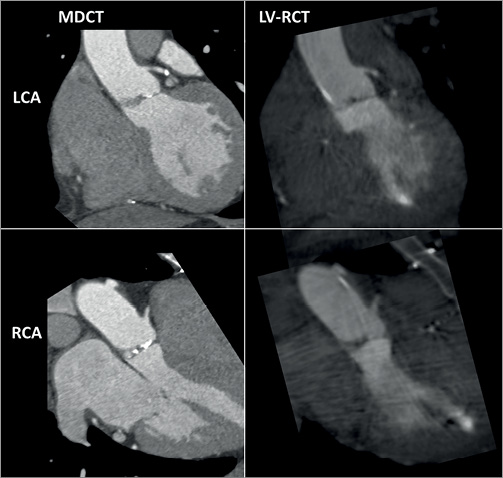
Figure 3. Comparison of LV-RCT with MDCT. A) Cardiac views shown (LAO 60°/coronal plane) in the top row MDCT (left) and LV-RCT (right) with depiction of the LCA. B) Cardiac views shown (RAO 30°/sagittal plane) in the lower row with depiction of the RCA.
STATISTICS
Continuous variables are reported as mean±SD unless otherwise stated. A paired Student’s t-test without correction for multiple comparison and Pearson correlations were used for the comparisons of the different modalities of all measurements; a p-value <0.01 was considered significant. The Bland-Altman method was used for the assessment of error and bias between the aortic root measurements of MDCT and rotational C-arm CT9. The inter-observer agreement for the measurements was evaluated by the intra-class correlation coefficient (ICC) in a two-way, mixed, single measure manner, with good agreement being defined as ≥0.80. All statistical tests were two-sided; a p-value <0.05 was considered significant. Statistical analyses were performed using MedCalc statistical software version 10.3 (MedCalc Software, Mariakerke, Belgium).
Results
STUDY POPULATION
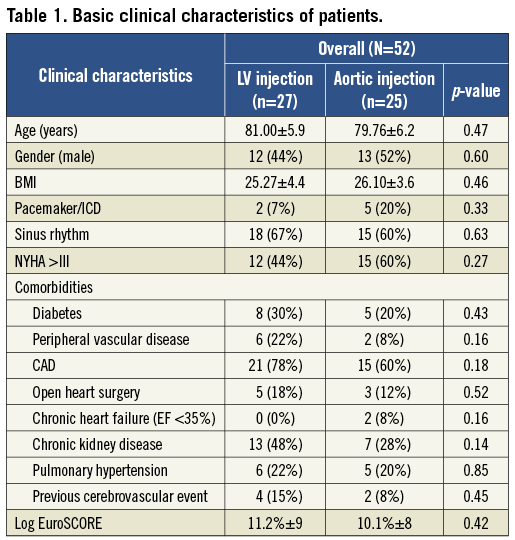
Pre-interventional imaging was performed in a total of 52 patients with RCT in the catheterisation laboratory. Patients’ baseline characteristics are listed in Table 1. RVP at a rate of 200 bpm was well tolerated by all patients. In the 52 patients, 25 Ao-RCTs and 27 LV-RCTs were performed. The median assessed image clarity of 3 (1=non diagnostic - 4=excellent quality) did not show any difference in either group. Six patients out of the Ao-RCT cohort were excluded for further analysis due to insufficient image quality (incomplete RVP [n=2], delayed contrast timing [n=2], massive artefacts by ICD [n=2]). No complications related to Ao-RCT or LV-RCT were observed during the hospital stay, including acute kidney injury or cardiac decompensation. After discussion of each patient within the Heart Team, patient allocation was as follows: 31 TAVI therapy, 18 SAVR, two valvuloplasty, and one conservative therapy. Complete data sets for analysis with corresponding MDCT were available for a total of 46 patients.
AORTIC ANNULUS MEASUREMENTS BY RCT AND MDCT
Mean aortic annulus diameter was 24.2±2.75 mm (eccentricity index: 1.18±0.14) using Ao-RCT and 23.5±2.26 mm (eccentricity index: 1.19±0.13) with LV-RCT. MDCT measured 23.6±2.32 mm (eccentricity index 1.11±0.10) for the mean aortic annulus (Table 2) with a significant correlation between Ao-RCT and MDCT (r=0.76; Figure 4A). The Bland-Altman analysis showed no trend for under- or overestimation using RCT (mean difference 0.1 mm, limits of agreement –3.4 to 3.6; Figure 4B). LV-RCT and MDCT correlated with a higher significance (r=0.91), and the Bland-Altman plot illustrated no relevant bias between the two methods (mean difference 0.4 mm) with a smaller scatter and smaller range of the limits of agreement from –1.5 to 2.3 compared to Ao-RCT. The mean annulus area derived from planimetry of Ao-RCT resulted in 5.1±0.9 cm², LV-RCT resulted in 4.3±0.7 cm², and MDCT resulted in 4.6±0.9 cm² (Table 2). Annulus area determination by Ao-RCT is inherently difficult, showing only the nadir of the three valves, and correlated poorly with MDCT (r=0.55). In contrast, annulus area derived from LV-RCT correlated well with MDCT (Online Figure 1). Assessment of LVOT area was only possible with LV-RCT and MDCT as there was no subvalvular contrast opacification with Ao-RCT. Correlation of LVOT area between LV-RCT and MDCT was significant (r=0.95) (Figure 5).
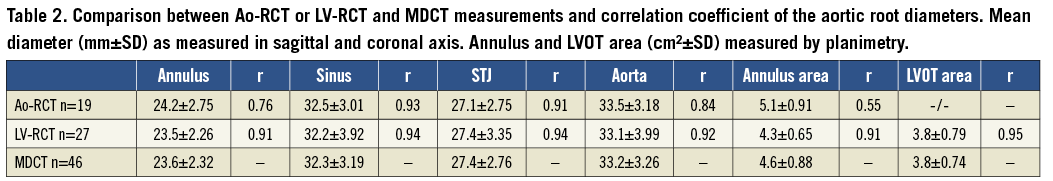
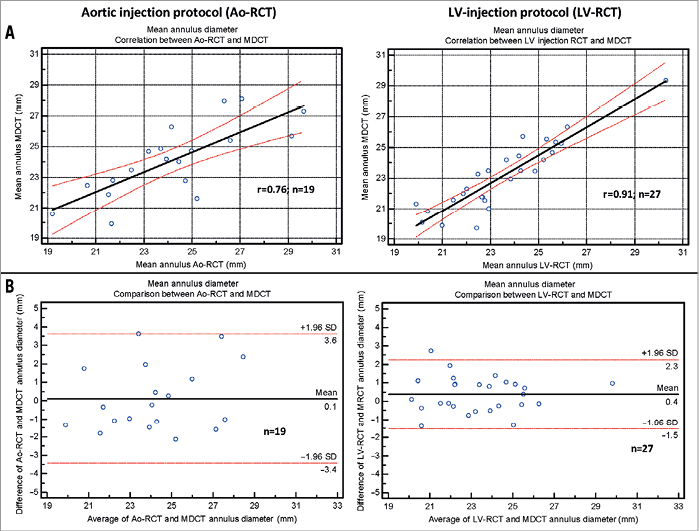
Figure 4. Diameter measurements. A) Scatter plot shows correlation between the mean annulus assessed by rotational CT during contrast injection into the aorta (left) or into the left ventricle (right) and measured in conventional MDCT data (black line=regression line; red lines=95% CI). B) Bland-Altman analysis plots the differences for the Ao-RCT and MDCT (left) and LV-RCT and MDCT (middle line=mean, upper/lower line=±2 SD).
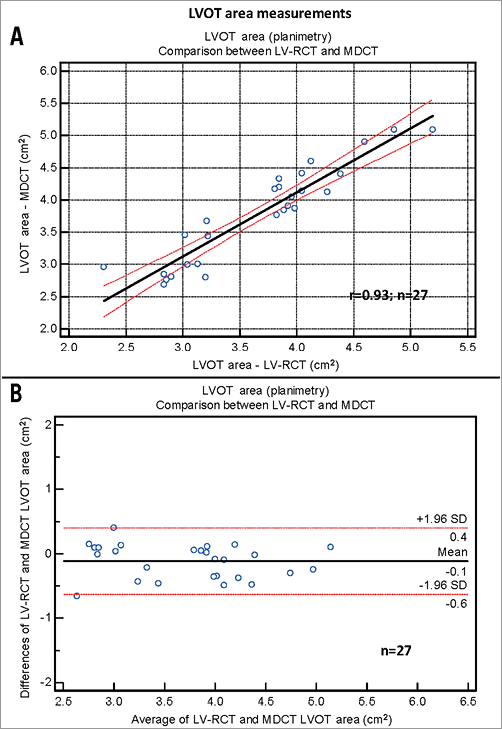
Figure 5. LVOT area measurements. A) Scatter plot shows correlation between the LVOT area assessed by LV-RCT modality and by conventional MDCT (black line=regression line; red lines=95% CI). B) Bland-Altman analysis plots the differences for the two modalities LV-RCT and MDCT (middle line=mean, upper/lower line=±2 SD).
AORTIC ROOT MEASUREMENTS BY RCT AND MDCT
Mean aortic sinus diameter was 32.5±3.0 mm using Ao-RCT, 32.2±3.9 mm using LV-RCT, and 32.3±3.2 mm using MDCT. Correlations between RCT and MDCT were good with no differences between the contrast injection protocols (Ao-RCT: r=0.93; LV-RCT: r=0.94). The mean STJ diameter measurements were comparable with no relevant differences between RCT and MDCT modality (27.1±2.8 mm with Ao-RCT, 27.4±3.4 mm with LV-RCT, and 27.4±2.8 mm with MDCT). Ao-RCT and LV-RCT showed good correlation with MDCT measurements of STJ (r=0.91; r=0.94, respectively). Mean diameter of the ascending aorta was measured in the same way in all modalities (Ao-RCT: 33.5±3.2 mm, LV-RCT: 33.1±4.0 and MDCT: 33.2±3.3 mm) with only slight differences in correlation between MDCT and RCT depending on the injection protocol, Ao-RCT (r=0.84) or LV-RCT (r=0.92).
CORONARY OSTIA MEASUREMENTS BY RCT AND MDCT
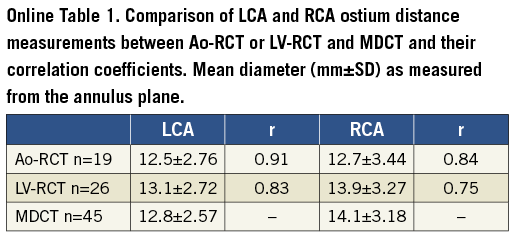
Coronary artery detection was possible in all but one case (severe coronary artery disease and bypass grafts) of the LV-RCT cohort. Mean distance to the annulus plane was measured as 12.3±2.2 mm for LCA and 14.2±3.2 mm for RCA in the Ao-RCT cohort, 13.2±2.8 mm for LCA and 14.1±3.20 mm for RCA in the LV-RCT cohort, and 12.8±2.6 mm for LCA and 14.1±3.2 mm for RCA in the MDCT cohort (Online Table 1 and Online Figure 2-Online Figure 3). Correlation with MDCT was high for LCA measurements in Ao-RCT and LV-RCT (r=0.91; r=0.83). RCA distance measurements showed lower correlation in Ao-RCT (r=0.84) and LV-RCT (r=0.75).
INTER-OBSERVER RELIABILITY
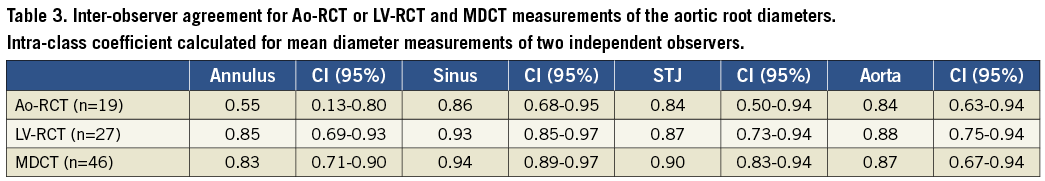
The inter-observer reliability of the aortic root measurements was assessed by calculation of the intra-class coefficient (ICC) for two independent observers for the modalities MDCT vs. C-arm CT and the different contrast injection protocols (Ao-RCT vs. LV-RCT) (Table 3). ICC showed that Ao-RCT reliability for the annulus assessment was unacceptably low by means of statistical standards ≥0.80 (ICC: 0.55, 95% CI: 0.13 to 0.80). In contrast, LV-RCT compared closely to MDCT reliability for the annulus measurements (ICC: 0.85, 95% CI: 0.69 to 0.93; ICC: 0.83, 95% CI: 0.71-0.90, respectively). When compared to MDCT, LV-RCT demonstrated consistently high ICC values for all aortic root measurements, reflecting a comparably good inter-observer reliability for both of these modalities. ICC values of Ao-RCT measurements of the aortic root (except for the annulus region) were slightly lower in comparison with LV-RCT but also demonstrated a good inter-observer reliability beside the aforementioned very low ICC for the annulus measurements.
CONTRAST AGENT AND RADIATION DOSE
The amount of contrast agent used for RCT was 25-40 ml per scan (diluted 1:1 with saline) independent of the applied injection protocol. The MDCT protocol used 80-95 ml contrast agent including the timing bolus. Effective radiation dose calculated by the dose area product for RCT was mean=1.3±0.8 mSv independent of the applied protocol. Effective radiation dose for the CTA protocol according to the dose length product (DLP) was 4.6±1.3 mSv.
Discussion
The major findings of the current study are: 1) left ventricular contrast injection (LV-RCT) during diagnostic cardiac catheterisation is safe and feasible and yields a diagnostic accuracy comparable to MDCT; and 2) LV-RCT significantly improves the visualisation of the aortic annulus, due to subvalvular opacification, as compared to Ao-RCT with additional delineation of the geometry of the LVOT. These findings highlight the potential of LV-RCT to assess the aortic valve, its surrounding structures, and cardiocirculatory haemodynamics, all of which are necessary to evaluate patients for TAVI procedures. This might be especially helpful for the rapid evaluation of critically ill and unstable patients with severe aortic stenosis in the catheterisation laboratory.
SAFETY AND FEASIBILITY OF LV-RCT
Subvalvular injection of contrast agent implies positioning of the pigtail catheter with a guidewire through the calcified aortic valve into the left ventricle, which can be challenging and time-consuming and therefore should be performed by experienced operators. In our study, no procedure-associated complications occurred and the median time elapsed for valve passage was not more than 90 seconds. Furthermore, haemodynamic stability during RVP was comparable with supravalvular injections performed during Ao-RCT, and rapid recovery of haemodynamics after cessation of pacing was observed in all cases. Also, the transvalvular position of the pigtail catheter had no relevance on valve opening or stenotic valve area (0.03 cm² reduction of valve area by a 6 Fr catheter). Our study demonstrates that the present protocol for LV-RCT injection is as safe and feasible as Ao-RCT protocols.
ACCURACY OF LV-RCT AS COMPARED WITH MDCT
TAVI relies on careful pre-interventional imaging of the aortic root for correct prosthetic valve size selection4. Due to its complex, frequently oval configuration, the definition of the annulus plane can be challenging8. MDCT and its multiplanar 3D reconstruction capabilities are considered to be the gold standard for exact delineation of the aortic valve annulus10. Our study demonstrates that the measurements of the supravalvular structures (annulus, sinus, sinotubular junction, ascending aorta) and also the subvalvular LVOT correlate well with respective MDCT data. Additionally, biplane peripheral angiography can be performed during cardiac catheterisation for visualisation of the arterial access sites. However, it has to be taken into account that LV-RCT with contrast injection cannot depict the degree of calcification.
COMPARISON OF LV-RCT WITH AO-RCT
Recent studies report the use of RCT for annulus assessment with suboptimal correlations to MDCT and 3D TEE6,7. Our results demonstrate several advantages of LV-RCT as compared with Ao-RCT: A) annulus measurements showed better correlation with MDCT, B) a higher inter-observer agreement was achieved, and C) LV-RCT enables the detection of subvalvular structures such as the LVOT area. In addition, simultaneous imaging of left ventricular shape and its angulation with respect to the LVOT, hypertrophy and contraction generates helpful complementary information for planning and positioning of the prosthesis. Concerning the detection of LCA and RCA, the distance measurement of Ao-RCT correlates slightly better than LV-RCT with corresponding MDCT data. However, both of them show decreased accuracy for RCA evaluation, which often tends to be smaller than LCA and shows more variability in its anatomy. The localisation of the pigtail catheter in the aorta rather than in the LV cavity could facilitate homogenous opacification of the coronary arteries.
CLINICAL IMPLICATIONS AND FUTURE DIRECTIONS
The degree of paravalvular regurgitation after TAVI is inversely proportional to long-term mortality and symptom improvement11,12. In this study we present for the first time LV-RCT as a novel imaging protocol for aortic root assessment and characterisation of the LVOT and the left ventricle. Our LV-RCT protocol as part of cardiac catheterisation provides comprehensive information for TAVI, combining delineation of the aortic annulus, left ventricular function, coronary artery morphology, haemodynamics of the aortic valve and peripheral access anatomy. This might also favourably affect the incidence of contrast-induced kidney injury, length of hospital stay and radiation exposure. For hybrid imaging protocols, the integration of LV-RCT data in planning tools such as the Heart Navigator® (Philips Healthcare, Best, The Netherlands) might be helpful. Applying this new imaging protocol could improve the diagnostic procedure for so-called “borderline cases” of patients in an acute critical state who might benefit from diagnostic catheterisation and immediate TAVI procedure in one session.
Study limitations
Although the multimodality approach for pre-procedural planning of TAVI/high-risk SAVR is recommended due to its complementary information, no study so far has proven the long-term effect of multimodality imaging on post-procedural outcome. Our study population had only a few patients with impaired left ventricular function (EF <35%; n=2), so we cannot exclude that RVP increases the risk of cardiac decompensation after examination in this patient subset. Cyclic changes of annulus morphology are well known13, with the largest annulus diameters presumed to be during systole, which is the phase recommended for measurement. All annulus measurements with MDCT were performed during diastole due to the fact that rotational CT was acquired during RVP, which causes only minimal valve opening and compares preferably with the diastolic cardiac phase. Due to lack of data, we cannot exclude that systolic annular measurements may differ significantly between MDCT and LV-RCT.
| Impact on daily practice Established and upcoming complex cardiac interventions such as TAVI require detailed information regarding heart and vessel anatomy for procedure planning (strategy, approach, sizing…) and intraprocedural navigation. In daily practice, rotational CT applying our new injection protocol can be integrated smoothly into the workflow in the catherisation lab, providing three-dimensional anatomy of the aortic root and the left ventricle with its LVOT. |
Funding
The study was supported with a restricted grant from the federal state government of North Rhine-Westphalia and the European Union (EFRE-Program “Med in.NRW”, support code 005-GW01-235A).
Conflict of interest statement
M. Merx receives honoraria as a proctor (TAVI) for Medtronic. J. Balzer receives honoraria from Philips Healthcare for giving lectures on congress meetings. S. Mollus is a full-time employee of Philips Research. All other authors have no conflicts of interest to declare.
Moving image 1. 360° rotation of volume-rendered LV-RCT reformatted data.
Moving image 2. 210° rotation of x-ray angiography during RCT acquisition.
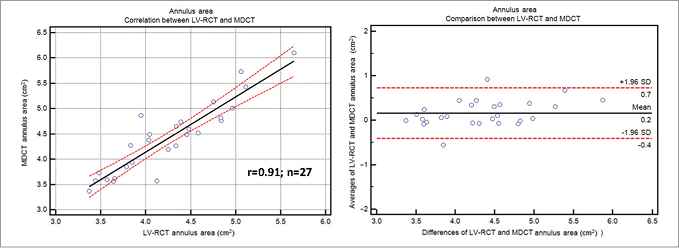
Online Figure 1. Annulus area in LV-RCT and MDCT. Scatter plot shows correlation between the annulus area assessed by LV-RCT and conventional MDCT (solid line=regression line; dashed lines=95% CI). Bland-Altman analysis plots the differences for annulus area assessment by LV-RCT and MDCT (middle line=mean, upper/lower line=±2 SD).
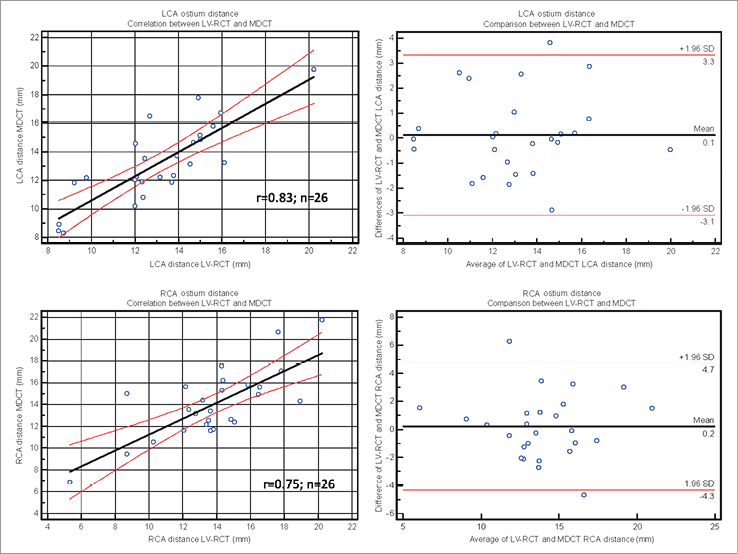
Online Figure 2. Coronary ostium distance by LV-RCT and MDCT. Scatter plot shows correlation between LCA (upper) and RCA (lower) ostium measurement by LV-RCT and conventional MDCT (solid line=regression line; dashed lines=95% CI). Bland-Altman analysis plots the differences for ostium measurement by LV-RCT and MDCT (middle line=mean, upper/lower line=±2 SD).
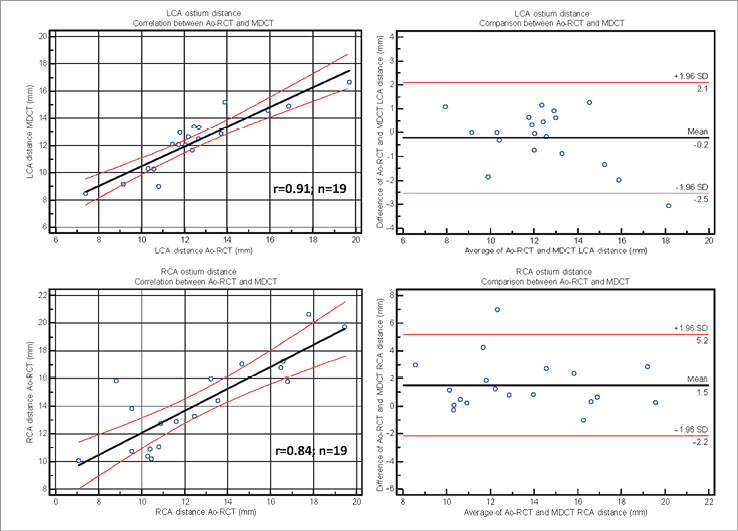
Online Figure 3. Coronary ostium distance by Ao-RCT and MDCT. Scatter plot shows correlation between LCA (upper) and RCA (lower) ostium measurement by Ao-RCT and conventional MDCT (solid line=regression line; dashed lines=95% CI). Bland-Altman analysis plots the differences for ostium measurement by LV-RCT and (middle line=mean, upper/lower line=±2 SD).