Abstract
Aims: There is an increasing awareness of leaflet thrombosis following transcatheter aortic valve implantation (TAVI) and valve-in-valve (ViV) procedures. Nevertheless, the predisposing factors affecting transcatheter aortic valve (TAV) thrombosis have remained unclear. This study aimed to quantify the effects of reduced cardiac output (CO) on blood stasis on the TAV leaflets as a permissive factor for valve thrombosis.
Methods and results: An idealised computational model representing a TAV was developed in a patient-specific geometry. Three-dimensional flow fields were obtained via a fluid-solid interaction modelling approach at different COs: 5.0, 3.5, 2.0 L/min. Blood residence time (BRT) was subsequently calculated on the leaflets. An association between reduced CO and increased blood stasis on the TAV leaflets was observed. At the end of diastole, larger areas of high BRT (>1.2 s) were observed at the leaflet’s fixed edge at low COs. Such areas were calculated to be 2, 8, and 11% of the total surface area of leaflets at CO=5.0, 3.5, and 2.0 L/min, respectively, indicating a ~sixfold increase of BRT on the leaflets from the highest to the lowest CO.
Conclusions: This study indicates an association between reduced CO and increased blood stasis on the TAV leaflets which can be regarded as a precursor of valve thrombosis.
Abbreviations
BRT: blood residence time
CFD: computational fluid dynamics
CO: cardiac output
CTA: computed tomographic angiography
FE: finite element
FSI: fluid-solid interaction
LVEF: left ventricular ejection fraction
SAVR: surgical aortic valve replacement
TAV: transcatheter aortic valve
TAVI: transcatheter aortic valve implantation
ViV: valve-in-valve
Introduction
Aortic stenosis due to calcific aortic valve disease is the main indication for aortic valve replacement in adult patients in developed countries1. Traditionally, in surgical aortic valve replacement (SAVR), the risks of lifelong systemic anticoagulation therapy following the implantation of mechanical valves were assessed versus the risks of bioprosthetic valve deterioration and possible reoperation. Owing to the promising improvements in the longevity of surgical bioprostheses and reduced complications associated with redo surgery, the choice of a bioprosthetic valve has been made in the majority of patients who are at age >60 years to avoid lifelong anticoagulation therapy2. Over the last decade, transcatheter aortic valve implantation (TAVI) has emerged as a safe and effective alternative for patients deemed at high/intermediate risk for SAVR. The possibility of redo transcatheter valve-in-valve (ViV) implantation also contributes to the shift towards the use of bioprosthetic valves3-5. As a result, the majority of patients with severe symptomatic aortic stenosis undergoing either SAVR or TAVI receive bioprosthetic heart valves2.
Bioprosthetic valves are generally believed to be less thrombogenic than mechanical valves. However, there is an increasing awareness of decreased leaflet mobility of bioprostheses after SAVR, TAVI, and ViV procedures6-9. Although often subclinical, leaflet thrombosis may potentially lead to an increased risk of stroke and transient ischaemic attacks6. Furthermore, leaflet thrombosis may lead to valve obstruction with heart failure symptoms and possibly reduced long-term valve durability10. As a result, it is important to investigate the predisposing factors affecting bioprosthetic valve thrombosis from a fundamental perspective. We recently demonstrated that geometric confinement of transcatheter aortic valve (TAV) devices with intra-annular leaflet function disturbs the natural flow field between the leaflets and aortic sinuses11,12. The confinement is introduced by the calcified native valve in TAVI (Figure 1A) or by the degenerated bioprosthesis in the ViV setting (Figure 1B) that circumferentially surrounds the aortic portion of the TAV stent. The confinement increases the blood residence time (BRT) on the TAV leaflets and consequently increases the likelihood of thrombogenesis. Regions of blood stasis promote transport of blood components to the biomaterial surface and provide an opportunity for platelets and blood proteins to accumulate to critical concentrations, leading to thrombosis13,14. In the present study, we aimed to quantify the effects of reduced cardiac output (CO) on blood stasis on the TAV leaflets regarded as a precursor of valve thrombosis.
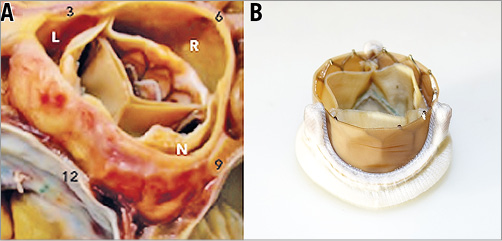
Figure 1. Geometric confinement of TAV devices. A) The aortic portion of the TAV stent frame is circumferentially surrounded by the calcified leaflets in TAVI. Reprinted with permission from Krishnaswamy et al34. B) The aortic portion of the TAV stent frame is circumferentially surrounded by leaflets and frame of the surgical bioprosthesis in the ViV setting.
Methods
Accurate flow measurement in close proximity to the TAV leaflets is difficult with the available imaging modalities in clinical cases. Hence, to study the effects of reduced CO on blood stasis on TAV leaflets, a fluid-solid interaction (FSI) modelling approach was employed. Using this approach, the highly transient three-dimensional (3D) flow field of an idealised TAV model with intra-annular leaflet function was simulated in a patient-specific geometry at three different COs.
CONSTRUCTION OF THE PATIENT-SPECIFIC GEOMETRY
The anatomic data were obtained from de-identified computed tomographic angiography (CTA) images of a 76-year-old female with normal aortic root geometry (Figure 2A). The geometry of the aortic root, ascending aorta, and the coronary arteries was then reconstructed using image processing. In the intra-annular positioning of a TAV in TAVI procedure, the TAV leaflets are confined by leaflets of the native valve (Figure 2B, bottom). Similarly, in the ViV setting, the TAV leaflets are covered by leaflets and frame of the failed bioprosthesis (Figure 2B, top). To reduce the computational cost, a simplified model in which the TAV leaflets are confined by a nearly cylindrical geometry was developed in the patient-specific geometry (Figure 2C).
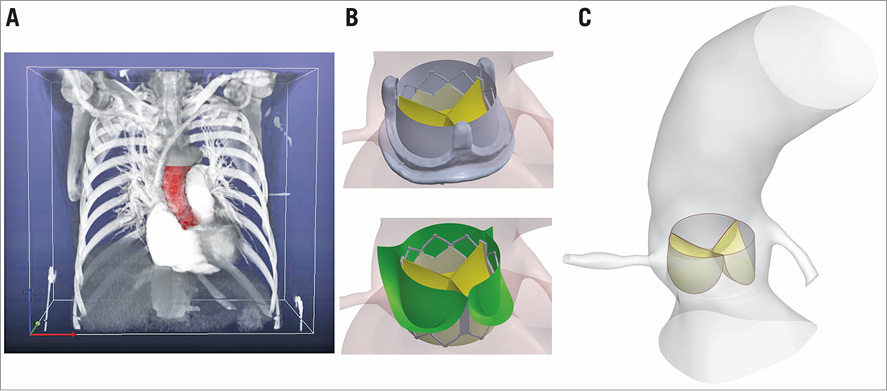
Figure 2. Patient-specific geometry. A) Construction of the 3D patient-specific geometry via processing of CTA images. B) TAV leaflets are confined by leaflets of the native valve in TAVI (bottom) and by leaflets and frame of the failed bioprosthesis in ViV (top). C) Simplified computational TAV model (Reprinted with permission from Vahidkhah et al12). CTA: computed tomographic angiography; TAV: transcatheter aortic valve.
FSI COMPUTATIONAL MODELLING AND SIMULATION
Obtaining the details of the in vivo flow field in close proximity to the TAV leaflets with the available imaging modalities is a difficult task due to the limited temporal and spatial resolution of the measurements. Therefore, an inverse finite element (FE) method was incorporated to simulate the 3D motion of the valve leaflets under physiological conditions in a pulse duplicator system. A detailed description of this methodology and its validation can be found in our previous publication15. A heart rate of 70 bpm, mean aortic pressure of 100 mmHg, and COs of 5.0, 3.5, and 2.0 L/min (corresponding to 71, 50, 29 mL per stroke, respectively) were used as the pulse duplicator input parameters. Considering an average body surface area of 1.8 m2 for normal-weight population16, the last two flow conditions would correspond to a stroke volume index of <35 ml/m2 17,18. The obtained 3D motions of the leaflets during a complete cardiac cycle at each CO were then implemented in three computational fluid dynamics (CFD) models using the ANSYS Fluent CFD package (ANSYS, Inc., Canonsburg, PA, USA). At the coronary artery outlets, the flow velocity was prescribed based on normal phasic coronary blood flow in all three cases19. A standard k-ε turbulent model was employed for the flow simulations. The density and the viscosity of blood were assumed to be 1,060.0 kg/m3 and 0.0035 kg.s/m2, respectively. To implement the motion of the valve leaflets, a cloud mesh was generated for each leaflet at each time step based on each FE simulation. Then, a user-defined function was developed to update the leaflets’ surface mesh at each time step using the cloud meshes. The validation of the FSI computational model by particle image velocimetry measurements can be found in our previous publications11,12.
POST-PROCESSING AND DATA ANALYSIS
To address the effect of reduced CO on the blood stasis on TAV leaflets, blood washout from the leaflets at different COs was quantified as follows. A region of interest denoted as ROI was defined as a section of the computational domain within 1.2 mm below and 4.5 mm above the TAV model. A scalar quantity denoted as residence time, TR, was then defined to represent the lifetime of a particle inside the ROI starting from zero at the time of injection at the inlet. TR is governed by the following equation20:
![]() (1)
(1)
where ![]() is the flow velocity vector. This equation is solved simultaneously with the mass and momentum conservation equations in the CFD method. Note that the value of TR at (x,t) (x being a spatial position inside the computational domain and t being a time instant during the cardiac cycle) signifies the time that a fluid particle at (x,t) has spent in the defined ROI, which in the present study contains the foreign surfaces of the TAV. More details on the above formulation and boundary conditions can be found in Esmaily-Moghadam et al20. This method has been employed successfully in previous studies to quantify blood stasis in the human cardiovascular system20,21.
is the flow velocity vector. This equation is solved simultaneously with the mass and momentum conservation equations in the CFD method. Note that the value of TR at (x,t) (x being a spatial position inside the computational domain and t being a time instant during the cardiac cycle) signifies the time that a fluid particle at (x,t) has spent in the defined ROI, which in the present study contains the foreign surfaces of the TAV. More details on the above formulation and boundary conditions can be found in Esmaily-Moghadam et al20. This method has been employed successfully in previous studies to quantify blood stasis in the human cardiovascular system20,21.
Results
To visualise the washout of blood from the leaflets, at the beginning of the two stages of a cardiac cycle namely systole and diastole, 3,000 imaginary massless particles were randomly distributed in the volume between the inner surface of the confining geometry and the outer surface of the leaflets. Using the simulated fluid flow velocities, the particles were then individually tracked over time during each stage separately. Figure 3 demonstrates sample snapshots of the aforementioned flow field visualisation during systole at CO=5.0 L/min. The simulated fluid flow structure is shown by the contours of the velocity magnitude in the mid-plane cutting through the valve. In Figure 3, the configuration of particles is shown by black dots, each dot representing one particle. The formation of a central jet and its surrounding low-flow regions during systole is observed in Figure 3. It is also observed that, by the end of systole, a significant number of particles still resided on the TAV model leaflets, specifically in close proximity to the leaflet fixed boundary (Moving image 1). This shows the prominent effect of the confining geometry around the valve on blood stasis on the leaflets. Figure 4 shows the flow visualisation for the TAV model during diastole at CO=5.0 L/min. Similar to systole, a considerable number of particles were observed as still residing on the TAV model leaflets (Moving image 2). Detailed visualisation of the flow for the other two COs under consideration can be found in the moving images (Moving image 3, Moving image 4 for CO=3.5 L/min, and Moving image 5, Moving image 6 for CO=2.0 L/min).
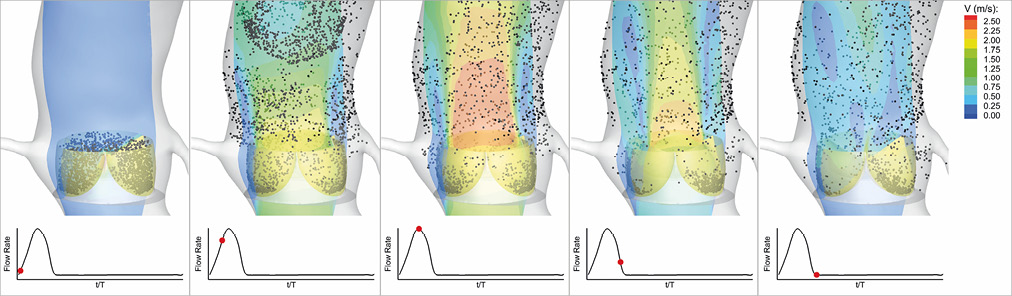
Figure 3. Snapshots showing the configuration of the flow field and the particles released on the leaflets at different time instances during systole in a cardiac cycle for the TAV model at CO=5.0 L/min. CO: cardiac output; TAV: transcatheter aortic valve
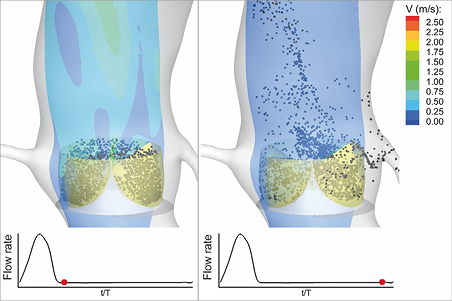
Figure 4. Snapshots showing the configuration of the flow field and the particles released on the leaflets at different time instances during diastole in a cardiac cycle for the TAV model at CO=5.0 L/min. CO: cardiac output; TAV: transcatheter aortic valve
Figure 3 and Figure 4 clearly demonstrate the considerable stasis of blood on the TAV leaflets during both systole and diastole. To quantify BRT and address the association between reduced CO and blood stasis on TAV leaflets, the contours of TR on the three leaflets during a cardiac cycle are demonstrated in Figure 5. It is observed that, while the blood stasis on the aortic surface of the leaflets was similar in the three different cases during valve opening and closing (first three columns), BRT was higher at lower COs during diastole (last three columns). Specifically, the areas of high BRT that are formed in close proximity to the fixed boundary of the three leaflets were observed to be considerably larger at lower COs. Note that the regions of blood stasis are not limited to the fixed boundaries of the leaflets and are also observed to a lesser extent at the free edges. This could be due to the slight distortion in leaflet coaptation during diastole in our TAV model that creates corners at the free edges.
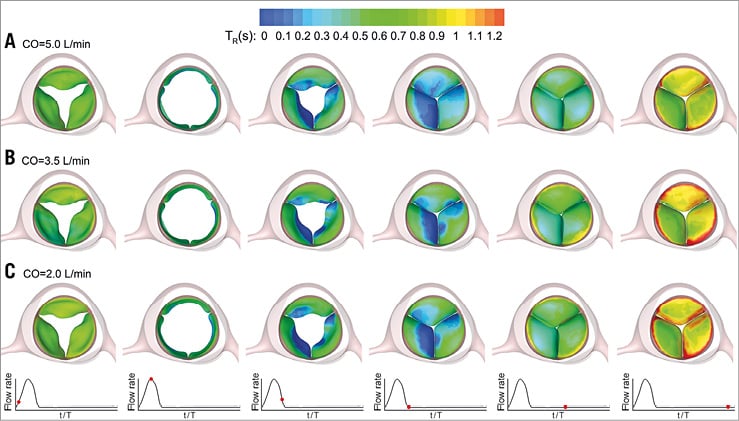
Figure 5. Snapshots showing the time evolution of the contours of BRT on the TAV model leaflets during a complete cardiac cycle at CO=5.0 L/min (A), CO=3.5 L/min (B), and CO=2.0 L/min (C). BRT: blood residence time; CO: cardiac output; TAV: transcatheter aortic valve
To quantify the observed difference in valvular blood stasis at the end of diastole among the three different cases, a parameter denoted by S was defined. S represents the percentage of the total area of the TAV model leaflets on which BRT was observed to be greater than a chosen value. BRT values from 0.8 to 1.2 s with 0.1 s increments were chosen as the threshold values. This choice approximately spanned a range from the surface-averaged BRT to the local surface maximum BRT on the TAV model leaflets at the end of diastole in the simulations. The results are presented in Figure 6. As can be seen, regardless of the choice of BRT threshold, a significant increasing trend in the high BRT areas was observed with a decrease in the CO. More specifically, the value of S was calculated to be 2, 8, and 11% at CO=5.0, 3.5, and 2.0 L/min, respectively, which indicates a nearly sixfold increase of high BRT regions corresponding to the criterion of TR >1.2 s as the CO was reduced from 5.0 to 2.0 L/min. Such an increase was as great as threefold and twofold as the criterion was changed to TR >1.0–1.1 s, and TR >0.8–0.9 s, respectively. The results also showed an ~twofold increase in the value of S corresponding to TR >1.2 s when CO was reduced from 5.0 to 3.5 L/min. This observation demonstrates a strong correlation between reduced CO and increased blood stasis on the TAV leaflets. Our results further showed that a decrease in CO leads to a consistent increase in the blood stasis on each TAV leaflet separately.
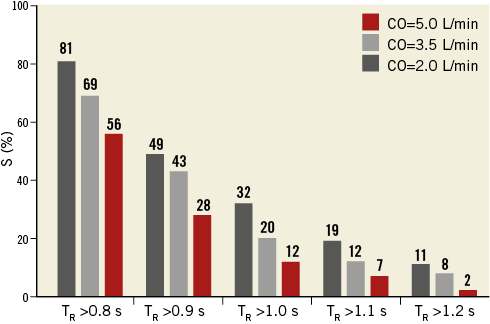
Figure 6. Quantification of the high BRT areas on the TAV model leaflets at different COs. S represents the percentage of the area of the three leaflets on which the BRT exhibits values greater than the criterion shown on the horizontal axis. BRT: blood residence time; CO: cardiac output; TAV: transcatheter aortic valve
Blood residence time (TR in Eq. 1) was averaged over the surface of each leaflet (denoted by –TR) at each time step in the simulations to quantify the potential difference in blood stasis between the TAV leaflets. Figure 7 demonstrates the variations of the surface-averaged BRT on the TAV leaflets over a complete cardiac cycle for the non-coronary, right, and left coronary leaflets at different COs. Note that our previous simulations have demonstrated that, following the first cycle, the variations in flow features, including –TR, become periodic. The results presented in this section are obtained from the second cycle when the semi-steady state of the flow has been reached12. It was observed that –TR had a decreasing trend during systole while it exhibited an increasing trend during diastole. This is to be expected considering the significant motion of the TAV leaflets during systole which leads to considerable dispersion of fluid particles. During diastole however, the dispersal of blood components is significantly reduced due to the lack of TAV leaflet motion. Figure 7 also shows that the surface-averaged BRT was generally larger for the non-coronary leaflet and lower for the right coronary one, specifically during diastole. While such an observation is quite clear for CO=5.0 and 3.5 L/min (Figure 7A, Figure 7B), the difference in –TR between non-coronary and left coronary leaflets during diastole was observed to be negligible at CO=2.0 L/min (Figure 7C). Note that the surface-averaged value of –TR on a leaflet (–TR) signifies the tendency of blood stasis on that leaflet on an average basis at each time instance during a cardiac cycle. Such averaging can lead to misleading conclusions if not accompanied by quantitative information of the distribution of –TR on the surface of the leaflets, as presented in Figure 5. The contour plots presented in Figure 5 show that the high BRT regions at the leaflet boundaries were comparable among the three leaflets. Overall, the results of the present study show that a strong association between reduced CO and increased blood stasis on TAV leaflets exists.
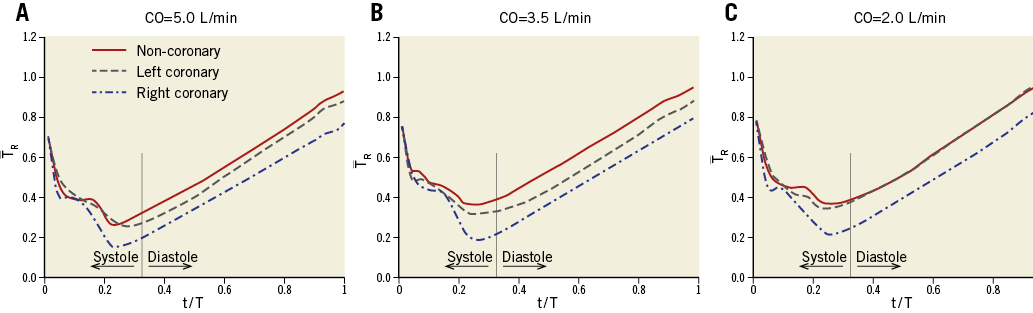
Figure 7. Variations of the surface-averaged BRT on the TAV leaflets during a complete cardiac cycle at CO=5.0 L/min (A), CO=3.5 L/min (B), and CO=2.0 L/min (C). BRT: blood residence time; CO: cardiac output; TAV: transcatheter aortic valve
Discussion and limitations
There are contradictory findings in the available clinical data regarding the relationship between reduced left ventricular ejection fraction (LVEF) and the likelihood of valve thrombosis following TAVI and ViV procedures. Leetma et al8 have pointed out the potential association between depressed LVEF (<35%) and post-TAVI thrombosis. Similarly, in a recent observational study by Chakravarty et al9, low ejection fraction has been suggested as a significant predictor of subclinical leaflet thrombosis. However, Hansson et al10 demonstrated that an LVEF of <35% did not independently predict TAV thrombosis. The results of the present study indicate an association between reduced CO and blood stasis on TAV leaflets. Despite the limited clinical data, this remark could help to address the apparent aforementioned contradiction. It is CO rather than LVEF that should be regarded as the appropriate measure to assess the likelihood of valve thrombosis. One can state that reduced left ventricular stroke volume, which can occur with both reduced (i.e., classic low flow) or preserved (i.e., paradoxical low flow) LVEF17,18, may increase the risk of post-TAVI thrombosis. However, frequency of the heart beat also needs to be taken into account in the assessment.
Valvular thrombosis is perceived to occur rarely following SAVR using bioprosthetic valves (incidence rate of 0.03-1.46%22-24). That, however, could be due to the lack of routinely performed follow-up assessments such as 4D computed tomography or transoesophageal echocardiography that can detect leaflet immobility. A recent observational study has reported an occurrence rate as high as 4% for valvular thrombosis following SAVR9. Although there is no direct evidence of the effects of low CO/LVEF on post-procedural thrombosis on surgical valves, our results on the effects of CO on blood stasis on TAV leaflets motivated us to conduct a similar study on surgical valves. The results are presented in Figure 8. Note that the only difference between the model for the surgical valve and the TAV is the absence of the confining geometry around the leaflets. As shown by Figure 8, the areas of high BRT on the leaflets of the surgical valve were significantly smaller compared to those of the TAV model, which confirms our previously postulated hypothesis11,12 on the possible enhancing effect of the geometric confinement of TAV leaflets on valvular thrombosis. Figure 8 further demonstrates that a reduction in the CO has a similar increasing effect on the high BRT regions on the leaflets of the surgical valve model. This observation motivates further clinical studies on possible effects of reduced CO on post-procedural valvular thrombosis following SAVR.
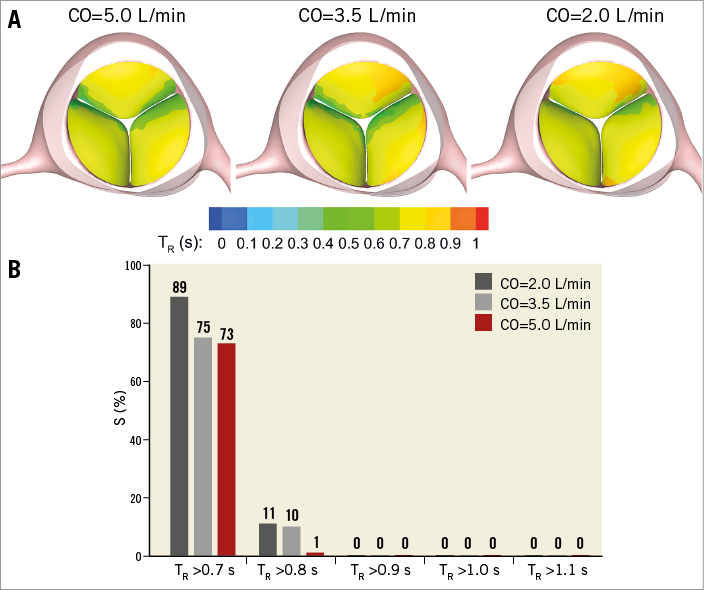
Figure 8. Effect of reduced cardiac output on blood stasis on surgical bioprosthetic valve leaflets. A) Snapshots showing the contours of BRT on the leaflets of the surgical valve model at the end of diastole at different COs. B) Quantification of the high BRT areas on the leaflets of the surgical valve model at different COs. S represents the percentage of the area of the three leaflets on which the BRT exhibits values greater than the criterion shown on the horizontal axis. BRT: blood residence time; CO: cardiac output
Recent clinical studies have hypothesised that the valve type and design, specifically the intra- versus supra-annular positioning, may potentially affect the occurrence of post-TAVI valvular thrombosis10,25. According to the available clinical observations, valvular thrombosis following TAVI has mostly occurred in the intra-annular positioning of TAVs6,8,26, as opposed to supra-annular positioning. In such a setting, similar to the simulations of the present study, the aortic portion of the TAV leaflets is significantly covered by the leaflets of the native aortic valve. Hence, it can be inferred that an intra-annular positioning may be more likely to induce longer blood stasis on the leaflets compared to the supra-annular positioning considering the full versus partial covering of the TAV stent frame. A recent study has also shown early cases of thrombosis on the LOTUS™ valve (Boston Scientific, Marlborough, MA, USA)27. Considering the LOTUS device design, specifically the metallic stent frame that considerably surrounds the aortic side of the leaflets, such an observation could also be regarded as aligned with the results of the present study.
Previous studies have demonstrated the formation of low-flow regions and flow stagnation following TAVI in the sinuses of Valsalva. Ducci et al28 performed flow measurements on a model aortic root and showed that TAVI significantly affects the flow pattern in the sinuses by creating blood stasis regions. The effect of TAV positioning on flow characteristics in the aortic root has been studied by Groves et al29 and Midha et al30. The results of these studies are in accordance with recent clinical observations on Valsalva thrombosis31. Although the present study focused on the blood stasis on TAV leaflets where post-TAVI thrombosis has been mainly observed6,7, the simulations confirm the formation of a low-flow region at the aortic sinuses, as demonstrated in Figure 9.
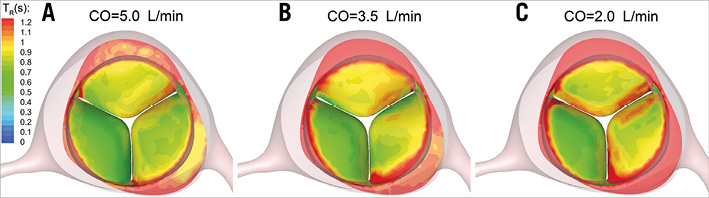
Figure 9. Contours of BRT(s) on the TAV model leaflets and aortic sinuses at the end of diastole at CO=5.0 L/min (A), CO=3.5 L/min (B), and CO=2.0 L/min (C). BRT: blood residence time; CO: cardiac output; TAV: transcatheter aortic valve
The present study focused on the effects of reduced CO on blood stasis on TAV leaflets, and consequently the likelihood of valvular thrombosis, due to the geometric confinement of TAV devices. Other haemodynamic factors such as post-procedural aortic regurgitation and elevated transvalvular pressure gradient have also been suggested to be influential in valvular thrombosis32. Besides such hydrodynamic effects, other geometric factors may also affect TAV thrombosis. For instance, a recent study has shown an association between the TAV size and the increased risk of thrombosis10. This motivates a computational study, similar to the present work, to investigate the effects of TAV geometric characteristics such as size and eccentricity on blood stasis on TAV leaflets. Note that other factors such as inadequate antithrombotic treatment, concurrent prothrombotic conditions, and delayed endothelialisation of the metallic TAV stent frame may also impact on TAV thrombosis8,33.
In the present study, a patient-specific geometry was employed to investigate the blood stasis on TAV leaflets. The motion of the TAV leaflets, however, was obtained using an FE method that inputs the parameters measured in a well-controlled pulse duplicator system15. Nevertheless, the conclusions are believed to remain valid considering the realistic physiological/pathological conditions applied to the bioprosthesis in the set-up, as well as the utilisation of a validated FSI approach11. This study motivates further investigation to determine the relationship between reduced CO and the likelihood of valve thrombosis following TAVI and ViV procedures in real-world in vivo clinical cases. Moreover, a simplified confining geometry was employed to represent the leaflets of the calcified native valve or the failed bioprosthetic valve that cover the TAV leaflets. Such simplifications, although considered as a limitation of this study, are not expected to invalidate the conclusions as they were made mainly based on the comparison of BRT values between different cases rather than the actual numerical values of BRT which may be affected by such simplifications.
Conclusions
In summary, the results of the present study demonstrated an association between reduced CO and increased blood stasis on TAV leaflets which can be regarded as a precursor mechanism to post-procedural valvular thrombosis. Regions of blood stasis provide an opportunity for platelets and blood proteins to accumulate to critical concentrations, leading to thrombosis. The above remarks are in line with clinical observations on valvular thrombosis following TAVI and ViV procedures. This study motivates further investigations on post-procedural valvular thrombosis regarding geometric variability associated with TAVI and ViV procedures such as valve type, size, and position, as well as haemostatic and haemodynamic factors.
| Impact on daily practice This study suggests that reduced cardiac output is associated with increased blood stasis on transcatheter aortic valve leaflets. The increased blood stasis can act as a permissive factor in valve thrombosis. Attention should be paid to the antithrombotic treatment of patients with low cardiac output following transcatheter aortic valve replacement and valve-in-valve procedures. |
Funding
This work was supported by the Knoebel Institute for Healthy Aging (Grant number 89546-142235), Professional Research Opportunity Funds administered by the University of Denver (Grant number 89610-142235), and by the University of Denver Postdoctoral Fellowship Award.
Conflict of interest statement
A. Azadani discloses a financial relationship as a Co-Principal Investigator with ReValve Medical, Inc. D. Dvir reports consulting fees from Edwards Lifesciences, Medtronic, and St. Jude. The other authors have no conflicts of interest to declare.
Supplementary data
Moving image 1. CO=5.0, systole.
Moving image 2. CO=5.0, diastole.
Moving image 3. CO=3.5, systole.
Moving image 4. CO=3.5, diastole.
Moving image 5. CO=2.0, systole.
Moving image 6. CO=2.0, diastole.
Supplementary data
To read the full content of this article, please download the PDF.
CO=5.0, systole.
CO=5.0, diastole.
CO=3.5, systole.
CO=3.5, diastole.
CO=2.0, systole.
CO=2.0, diastole.