Abstract
Aims: Previous studies indicated that fluctuations in photoplethysmograph (PPG) amplitude may predict coronary artery disease (CAD). The respiratory modulation response (RMR) is derived from spectral analysis of the PPG signal during instructed breathing. We sought to evaluate the RMR obtained from the fingertip as a predictor of significant CAD.
Methods and results: RMR was calculated as the relative change in the respiratory modulation of the PPG, in response to breathing at 0.1Hz. RMR results of 97 consecutive patients (age 62±12 years, 77% male) were compared with their angiograms. Coronary lesions with diameter stenosis >50% that required revascularisation were classified significant. RMR was analysed after 20 sec. of spontaneous breathing, followed by 70 sec. of breathing at 0.1Hz. The test was repeated post procedure in 76 patients. RMR was lower in patients with significant CAD compared to those with non-significant (16.3±20.1; n=66 vs. 40.6±16.9; n=31, P<0.001). It improved after successful angioplasty (from 15.0±19.0 to 40.0±18.9; P<0.001) and did not change after diagnostic catheterisation. Using receiver operating characteristic analysis, we identified RMR<30% (sensitivity 79%, specificity 87%; positive predictive value 93%; negative predictive value 66%) to be the optimal cutoff for predicting significant CAD.
Conclusions: The RMR is a novel, non-invasive parameter for the assessment of significant CAD.
Introduction
The photoplethysmogram (PPG) signal, obtained from the finger tip, represents changes in blood volume in the tissue bed and may reflect beat-to-beat variations in perfusion1. Prior studies demonstrated association between central arterial properties and haemodynamic parameters derived from peripheral pulse wave analysis and the severity of coronary artery disease (CAD)2-8. Also, abnormalities in peripheral pulse wave amplitude (PWA) were associated with atherosclerosis and may be predictors of cardiac events9-11.
The PPG signal reflects the pulsatile waveform induced by the combined effect of the pressure wave generated from the cardiac cycle1, and the respiratory sinus arrhythmia induced by breathing12,13, which is affected by arterial wall distensibility and sympathetic tone as well. Previous studies demonstrated that the respiratory rate affects the respiratory component in the systolic blood pressure variation, with the greatest impact at respiratory rate of 0.1 Hz14. Therefore, we assumed that at this respiratory rate the effect of the respiratory modulation of the PPG signal is maximised.
The hypothesis of this study is that factors affecting pressure/flow relations and wave propagation, such as myocardial ischaemia, will modify fluctuations in the peripheral pulse as measured by the PPG signal. Therefore, we assessed a novel, non-invasive parameter, the respiratory modulation response (RMR) as a predictor for significant CAD. This parameter reflects the relative change in respiratory modulation of the PPG signal at the frequency domain in response to instructed breathing at 0.1 Hz.
Methods
Patient population
A total of 97 consecutive patients referred for cardiac catheterisation to exclude significant CAD were studied. Exclusion criteria were (1) acute myocardial infarction (MI); (2) severe congestive heart failure (New York Heart Association class IV); (3) severe left ventricular dysfunction; (4) previous coronary artery bypass graft surgery; (5) any significant arrhythmia that precluded steady-state recording and analysis of the PPG signal; (6) significant valvular heart disease; (7) haemodynamic instability; (8) inability to perform the instructed breathing test because of any known significant respiratory abnormality; or (9) language comprehension difficulties.
Patients were allocated into two groups according to their angiogram findings. Group 1 included 31 patients with non-significant CAD, and group 2 included 66 patients with significant CAD. Patients with coronary lesions with% diameter stenosis (%DS) >50% that required either percutaneous revascularisation or coronary artery bypass graft (CABG) surgery were classified as having significant CAD; coronary lesions with %DS ≤50% that were treated conservatively were considered non-significant. The study was approved by the Rabin Medical Center Institutional Review Board, and informed consent was obtained from all patients.
Study protocol and calculation of RMR
Coronary angiograms were reviewed at the Rabin Medical Center angiographic core laboratory using the MDView™ Quantitative Angiographic System (Medcon™ Telemedicine Technology, Tel-Aviv, Israel) by experienced interventional cardiologists that were blinded to the RMR results.
Standard morphologic criteria were used for the identification of lesion location, lumen diameters, and lesion length. Using the contrast-filled guiding catheter (i.e., 6 or 7 Fr) as the calibration standard, the reference and minimal lumen diameters were determined before and after percutaneous coronary intervention (PCI) using an automated edge-detection algorithm. Based on these measurements, the %DS was determined before and after the interventions.
To reduce factors affecting pulse oximeter waveform amplitude, patients had to stop vasoactive medications such as beta-blocker agents, at least 48 hours before the procedure, and none of the patients received sedation during the procedure15. Also, patients were tested before and after the coronary catheterisation procedure at the holding area of the catheterisation laboratory. The PPG signal was recorded during spontaneous and instructed breathing at 0.1 Hz. Before the test, patients were taught to breathe at a rate of six respiration cycles per minute: five seconds for each inhalation and five seconds for each exhalation. Each test started with spontaneous baseline breathing of 20 sec. followed by instructed breathing of 70 sec. The acquisition of the PPG signal during the test was obtained from the finger tip by the sensor of a Cardiometer device (Cardiometer Ltd, Tel Aviv, Israel). The PPG signal was then analysed by an algorithm that performed spectral analysis of the signal and calculated the RMR value in percent.
RMR calculation
The RMR provides a measure of the impact of modulating excitation (e.g., instructed breathing at respiratory rate of 0.1 Hz) on the measured PWA of the PPG signal. It is a measure of the respiratory modulations in the PPG signal, accumulated during the 70 sec. of the breathing test. It is equal to the ratio (in %) between the net respiratory peak area (around the 0.1-Hz breathing frequency) and the total peak respiratory area on the spectrum of the PWA of the PPG signal, and it is calculated as follows (Figure 1B): The area under the power spectrum curve between two adjacent minimal values on the curve adjacently to the two sides of the excitation frequency (e.g., 0.1-Hz breathing frequency) is divided into two areas:
(I) The total peak area (ATotal=ADBE) and (II) the area below the “AC” line (ADACE), where the “AC” line connects two adjacently located minima of the spectrum. The RMR is then obtained by the following calculation:

The normalisation of the net respiratory peak area by the total respiratory peak area reduces the influence of interfering factors, such as ambient temperature or a decrease in peripheral perfusion due to vasospasm or peripheral vascular disease.
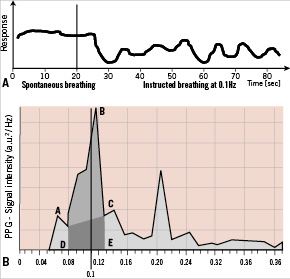
Figure 1. Representative PPG signal at spontaneous breathing (A; left side) and instructed breathing at 0.1 Hz (A; right side) in normal subject. There is a prominent respiratory modulation of the PPG signal during instructed breathing at 0.1 Hz. The RMR is derived from the change in the respiratory peak in the power spectrum of the PPG signal intensity (B) in response to breathing excitation at the rate of 0.1 Hz, compared to spontaneous breathing. The RMR value is calculated as the relative change (in%) in the respiratory peak area in response to breathing excitation (light gray shadow: AABC) as compared to the spectral content of the same frequency band at baseline (dark gray shadow: ADACE). a.u.: arbitrary units
Diagnostic coronary angiography and the PCI procedure
Coronary angiography was performed using a 6 Fr Judkins catheter with a standard femoral percutaneous approach after routine procedures. To avoid spasm, sublingual (0.4 mg) or intracoronary nitroglycerine (0.1 mg to 0.3 mg) was routinely administered before the initial and final angiograms.
Coronary angioplasty and stent implantation were performed using standard percutaneous techniques. In all patients, stent implantation was performed at an inflation pressure of 12 to 16 atmospheres. When suboptimal stent deployment was observed, angiographic optimisation was performed by using high-pressure, noncompliant balloon dilatation to achieve <20% residual stenosis.
Statistical analysis
Data for continuous variables are presented as the mean value ±SD, and categorical variables are presented as frequencies. Comparisons between groups were performed using independent samples t-tests and analysis of variance (ANOVA) for continuous variables, and chi-square tests for categorical data. Paired-sample t-tests were used to compare changes in RMR pre- and post-catheterisation procedure. We used a multivariable logistic regression analysis to estimate predictors of significant CAD, adjusting for potential risk-factors and confounders. RMR values and patients’ age were entered as continuous variables and all risk factors were entered as categorical variables. Data are presented as odds ratios and 95% confidence intervals. The best-fitted cutoff RMR value for predicting the existence of significant CAD was determined by a receiver operating characteristic (ROC) curve analysis. All analyses were performed using SPSS software version 15.0 (SPSS, Inc., Chicago, Illinois, USA). A two-tailed P<0.05 was considered statistically significant for all tests.
Results
Clinical characteristics
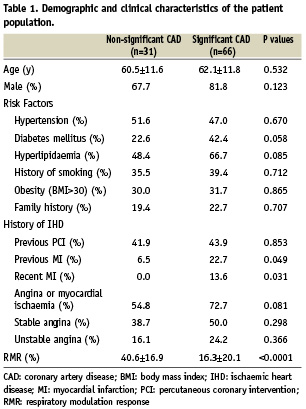
The patient population (n=97) was mostly men (77%) with a mean age of 62±12 years, 43% with previous PCI, and 36% with diabetes. The demographic and clinical characteristics of the patients, grouped by CAD severity, are outlined in Table 1. There were no significant differences between patients with significant CAD and those with non-significant CAD with respect to risk factors. Patients with significant CAD more often had prior MI, including recent MI, whereas none of the patients with non-significant CAD had recent MI.
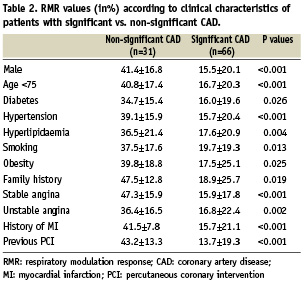
Overall, patients with significant CAD had a lower RMR compared to patients with non-significant CAD (Table 1), regardless of their risk factors or clinical history of angina, previous MI, or angioplasty (Table 2). The RMR value was lowest in patients with significant CAD who had recent MI (n=9; 0.33±0.71% vs. 18.8±20.5%; P=0.009), and was normalised following successful PCI (36.7±15.5%).
Angiographic characteristics and RMR
The PPG signal of patients with non-significant CAD demonstrated a prominent respiratory modulation compared to patients with significant CAD (Figures 2B & 2A). This resulted in the above mentioned significant lower RMR in the latter group (Table 1). Also, patients with significant culprit lesion in the left coronary system, had a significantly lower initial RMR compared to the right coronary artery (RCA) (n=43; 11.0±16.1% vs. n=23; 26.3±23.2%, respectively; P=0.002). Nevertheless, there were no significant differences in RMR between patients with the culprit lesion in the left anterior descending (LAD) compared to the circumflex (CX) (n=30; 15.08±22.26% vs. n=23; 16.04±19.09%, respectively; non-significant).
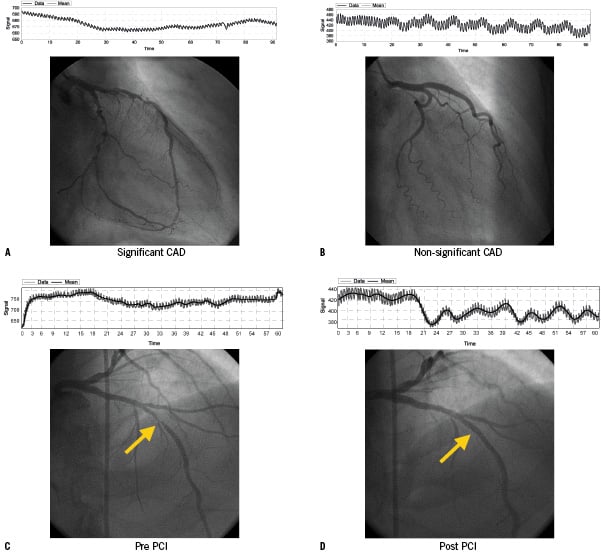
Figure 2. Representative examples of patient angiograms and PPG signal recordings demonstrating that respiratory modulation response of the PPG signal is less prominent in patients with significant CAD (A&C), compared to those with non-significant CAD (B). Following successful PCI there was a significant increase in the respiratory modulation of the PPG signal (D).
Furthermore, the RMR values did not vary by the number of diseased vessels: one vessel disease: 15.0±18.9, two vessel disease: 13.9±18.0, and three vessel disease: 31.0±29.1 (P=0.121). Also, there were no significant differences between the RMR values of patients with moderate-grade lesions within a single vessel (%DS: 50–70%) compared to high-grade lesions (%DS >70%) (20.9±22.5% vs. 15.8±20.5%, respectively; P=0.469).
The test was repeated post procedure in 76 patients. Following PCI of significant coronary lesions (n=55), there was a significant increase in the respiratory modulation of the PPG signal (Figures 2C & 2D & Figure 3B) in majority of the patients (75%), whereas, in patients with non-significant CAD (n=21), there was no significant change in the RMR following diagnostic angiogram (Figure 3A).
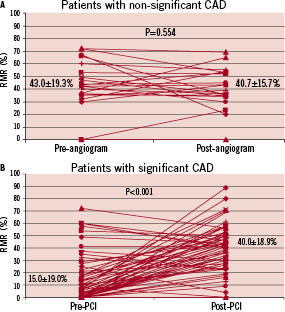
Figure 3. Per-patient changes in RMR values for both patients with (B) as for patients without CAD (A). Following successful PCI there was a significant increase in the respiratory modulation of the PPG signal in the majority (75%) of the patients (B).
RMR as an independent predictor of significant CAD
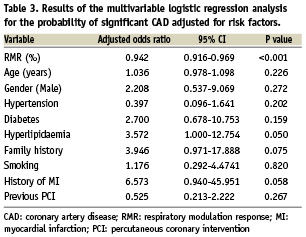
Using ROC curve analysis, we identified an RMR value <30% (sensitivity 79%, specificity 87%) as the best cutoff value for predicting a significant CAD, with a positive predictive power of 93% and negative predictive power of 66%. Lower or higher cutoff value may not be optimal, as they substantially reduce the test sensitivity and specificity, respectively (Figure 4). Results from the multivariable logistic regression analysis are presented in Table 3. When controlling for potential risk factors, RMR was a significant predictor for significant CAD, suggesting that one point decrease in RMR value increases the risk of CAD by 5.8% (Table 3). Results from a stepwise logistic regression analysis confirms that RMR was the only significant predictor of CAD (OR=0.944; 95% CI: 0.921-0.968; p<0.0001).
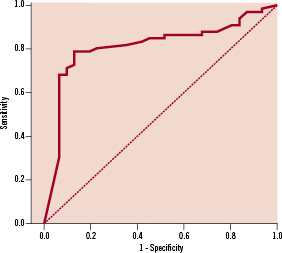
Figure 4. ROC curve - by ROC curve analysis, we identified an RMR <30%, to be the optimal cutoff value for predicting significant CAD. Area under the curve – 0.812 (95% CI: 0.718-0.906, p<0.001). Sensitivity 79%; Specificity 87%; PPV 93%; NPV 66%.
Discussion
The present study demonstrates that the measurement of RMR is a simple non-invasive bedside test that is an independent predictor for significant CAD in patients referred for coronary artery evaluation and that a categorised cutoff RMR value below 30% seems a good index for predicting significant CAD. Moreover, in the majority (75%) of patients with significant CAD undergoing successful PCI, there was a significant increase in the RMR value. Thus, our results suggest that RMR may serve as a non-invasive index for assessment of high-risk patients for the presence of significant CAD.
Successful angioplasty of significant stenosis of a coronary vessel supplying significant myocardial territory, may acutely improve myocardial ischaemia, and consequently improve PPG respiratory variations and RMR. In the present study, patients with recent MI had the most depressed respiratory modulation of the PPG signal with the lowest RMR value that was significantly increased following successful angioplasty. This outcome was probably the result of hibernating or stunned myocardium that was improved to some extent following revascularisation. In line with this hypothesis is our finding that RMR was significantly lower in patients in whom the culprit lesion was in the left coronary system. This location generally affects more significant myocardium compared to the right coronary system; thus, ischaemia in this territory may affect cardiac output more significantly.
Nevertheless, no graded response was seen with severity of disease within a single vessel, or the number of diseased vessels. Therefore, it might be that suppression of respiratory fluctuations of the stroke volume (as reflected by respiratory fluctuations in the PPG), which is presumably induced by significant myocardial ischaemia, is not sensitive enough to detect different levels of ischaemia. Also, considering the degree of cardiac output impairment due to ischaemia from functional point of view, three vessel CAD is not necessarily more severe than one vessel CAD. For instance, a patient may have three vessels CAD with moderate grade stenosis in several locations and still display better functional response to changing demand than a patient with one vessel CAD with tight stenosis. Since the RMR provides a functional indicator, it is not surprising that such a phenomenon was found. This, however, warrants further investigations to elucidate the exact mechanism of this phenomenon.
Frequency analysis of the oscillating component of the PPG signal can extract all the information in the signal about the autonomic nervous system control of the cardiovascular system. Thus, it is possible that the decreased respiratory modulation of the PPG signal, observed in patients with significant CAD, actually reflects autonomic nervous system dysfunction with a depressed vagal tone that was resolved following successful PCI. This explanation is also supported by results of a previous study16 demonstrating that reversal of left ventricular dysfunction by successful angioplasty resulted in increased heart rate power spectrum.
Our study has several limitations. First, blood flow in the finger vascular bed is markedly influenced by sympathetic activity and temperature variations17. It is possible that changes in finger PWA may occur because of changes in room temperature or mental stress. We attempted to control for these potential confounders by testing patients in a quiet, climate-controlled environment.
Second, to avoid participation of patients with respiratory abnormalities who would not be able to follow the breathing protocol, we excluded patients with overt congestive heart failure and significant left ventricular dysfunction. Thus, this study did not assess the effect of heart failure on RMR, and future studies with such patients who can still follow the breathing protocol may be warranted.
Third, the per-patient changes for both patients with as for patients without CAD illustrates that although the mean RMR value significantly increased following PCI, it occurred only in the majority (75%) of the patients with significant CAD (Figure 3B). We assume that not all the patients have a change in the same direction due to incomplete revascularisation. This however, warrants further studies in larger cohorts of patients.
Finally, regarding the frequency analysis of the oscillating component of the PPG signal and the calculation of the RMR, it should be realised that the second peak in Figure 1 at 0.20 Hz is a harmonic from the 0.10 Hz, and not a smaller form found at 0.20 Hz. This can be explained by the fact that when a periodic signal is not purely sinusoidal its power spectrum contains higher harmonics, e.g. frequency components at multiplications of the basic frequency. The number of harmonics depends on the signal waveform. The signal we analysed is quite smooth, therefore its spectrum is not expected to contain significant component above the first harmonic.
This study evaluated a simple, non-invasive bedside test for analysing the respiratory modulation of the PPG signal in response to instructed breathing at 0.1 Hz for the prediction of significant CAD. It was found to be sensitive, and predictive for the assessment of high-risk patients for the presence of significant CAD.