Abstract
Aims: We investigated the mechanism and predictors of jailed branch vessel (BV) compromise during the stenting of left main trunk (LMT) bifurcation lesions from a multidetector row computed tomography (MDCT) analysis.
Methods and results: Eighty patients who underwent MDCT and stenting for LMT bifurcation lesions were examined. The patients were retrospectively classified into a BV stenosis (BVS; n=38) group and a non-BV stenosis (NBVS; n=42) group according to a coronary angiography obtained just after crossover stent deployment for the target vessel (TV). The angle between the LMT and TV was significantly wider in the BVS group than in the NBVS group (140.2±10.3 degree vs. 132.6±14.2 degree, p=0.0076), and the frequency of carina side plaque at the TV in the long and short axis was significantly higher in the BVS group than in the NBVS group (50.0% vs. 16.7%; p=0.0012, 63.2% vs. 38.1%; p=0.0251, respectively). In a multivariate analysis, the presence of carina side plaque at the TV in the long and short axis were independent predictors of BVS (odds ratio: 5.15, p=0.0086, odds ratio: 3.83, p=0.0231, respectively).
Conclusions: The plaque distribution and morphology assessed by MDCT may provide useful information that can predict the potential compromise of the BV during treatment for an LMT bifurcation lesion.
Abbreviations
PCI: percutaneous coronary intervention
DES: drug-eluting stent
LMT: left main trunk
CABG: coronary artery bypass graft
BV: branch vessel
IVUS: intravascular ultrasound
CT: computed tomography
TV: target vessel
LAD: left anterior descending coronary artery
LCX: left circumflex coronary artery
BVS: branch vessel stenosis
NBVS: non-branch vessel stenosis
QCA: quantitative coronary angiography
3D-VR: three-dimensional volume rendering
RI: remodelling index
CCP: colour code plaque
OR: odds ratio
CI: confidence interval
Introduction
Percutaneous coronary interventions (PCI) for bifurcation lesions comprise 15~20% of all PCI procedures in daily practice, and are associated with a relatively high restenosis rate as well as a high incidence of procedural complications including side branch occlusion and myocardial infarction1,2. PCI for bifurcations are thus still a challenging treatment, even in the drug-eluting stent (DES) era. This is particularly true in the case of left main trunk (LMT) bifurcation lesions where current guidelines consider coronary artery bypass grafting (CABG) as the “gold standard”3,4, and where major branch vessel (BV) compromise can occur, perhaps leading to a critical situation. Therefore, being able to predict whether a major BV compromise will occur is an important issue for the successful treatment of LMT bifurcation lesions.
Assessments regarding possible predictors of BV compromise by coronary angiography1,5 and intravascular ultrasound (IVUS)6 have been reported. In particular, IVUS provides precise information about the plaque with high quality images. However, IVUS is invasive and may provide warped geometric information due to its inherent limitations. On the other hand, although it does result in radiation exposure, cardiac multidetector row computed tomography (MDCT) is a less invasive tool for assessing the coronary anatomy, including plaque distribution, and is known to have excellent detectability of the plaque, similar to IVUS7,8.
The recent consensus regarding jailed BV compromise is that it is now thought to be a carina shift rather than plaque shift9,10. However, no previous investigation about the correlation between the carina shift and the bifurcation anatomy, including the plaque distribution, has been reported.
In the present study, we investigated the mechanism involved –and the predictors of– jailed BV compromise during the stenting of LMT bifurcation lesions from a cardiac CT analysis.
Methods
PATIENT POPULATION AND THE PCI PROCEDURE
One hundred and twelve consecutive patients who underwent cardiac CT and then underwent PCI for a LMT bifurcation lesion within 30 days between January 1, 2006 and April 30, 2010 in our cardiovascular centre were included in this study. All lesions were de novo and had significant stenosis of more than 50% of the diameter. All patients underwent stent implantation from the LMT to the target vessel (TV) across the BV without predilation of the BV. If the left anterior descending coronary artery (LAD) was the TV, then the left circumflex coronary artery (LCX) was defined as the BV, and vice versa. The patients who had undergone CABG or had heavy calcified LMT bifurcation lesions, which confounded the CT evaluations, were excluded from the analysis. Heavy calcification was defined as circumferential (over 180 degrees) calcification measuring over 5 mm in length. Finally, 80 patients with 80 LMT bifurcation lesions were investigated in this study (Figure 1).
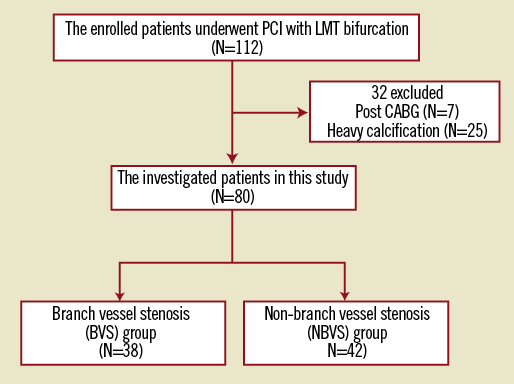
Figure 1. The study flow chart. Of 112 consecutive patients, 80 patients with 80 LMT bifurcation lesions were investigated. PCI: percutaneous coronary intervention; LMT: left main trunk; CABG: coronary artery bypass graft
The patients were retrospectively classified into two groups according to their coronary angiography results obtained just after the first stent implantation: a BV stenosis (BVS) group and a non-BV stenosis (NBVS) group. BVS was defined as the progression of more than 75% diameter stenosis or two stage progression of the American Heart Association classification11 (e.g., from 0% to 50%, and from 25% to 75%) of the BV ostium as determined by the quantitative coronary angiography (QCA) analysis. QCA was performed using the semi-automatic edge contour-detection computer analysis system, Centricity Cardiology AI 1000 version 4.1.15 (GE Healthcare, Milwaukee, WI, USA). The QCA analysis was performed by more than two cardiovascular physicians who were blinded to the study results. In cases of disagreement, the opinion was made by consensus.
The PCI strategy and the device selection (guidewire, balloon, stent type, etc.) were left to the operator’s discretion. All patients were fully informed about the possible procedure-related risks and the alternative treatment options, and written informed consent was obtained in all cases.
CT ANGIOGRAPHY: IMAGE ACQUISITION
Almost all of the enrolled patients received oral and/or intravenous beta-blockers to achieve a heart rate of <65 beats/min and were given one puff of nitroglycerine spray just before the examination if it was not contraindicated. CT angiography (CTA) was obtained by a 64 row-CT scanner (Lightspeed VCT, GE Healthcare, Milwaukee, WI, USA) using a double phase contrast protocol: 40 to 60 ml iodine (Iopamiron; Bayer Health Care, Osaka, Japan), followed by a 20 ml flush with a 50:50 mixture of iodine and saline. Before the main scan, a test injection was performed to determine the delay time, and a monitoring scan was acquired at the centre of the ascending aorta. A measurement curve was created during the test injection. The scan parameters included 64×0.625 mm collimation, tube voltage 120 kV, 350 to 800 mA, the gantry rotation speed was 350ms/rotation and dose-modulated retrospective electrocardiogram-gating was used. If the heart rate was <60 beats/min, a prospective electrocardiogram-gating scan was used.
CT ANGIOGRAPHY: DATA ANALYSIS
Each coronary bifurcation angle, between the LMT and the TV (∠LMT-TV), between the LMT and the BV (∠LMT-BV) and between the TV and the BV (∠TV-BV), was measured by using the three-dimensional volume rendering (3D-VR) coronary tree image. The standard axial images, and oblique long- and short-axis multiplanar reconstruction were used to classify lesions having significant stenosis, which was defined as a diameter reduction by >50%. The type of bifurcation lesion was assessed by the Medina classification12, and Medina (1, 1, 1) and (0, 1, 1) were defined as true bifurcation lesions.
The reference vessel areas of the LMT, TV and BV were measured as the average of the vessel area at both the proximal and distal sites. The lesion vessel area and lesion lumen area were measured at the lesion site with maximal lumen narrowing on cross-sectional images.
The vessel area was defined as the enclosed area with the outer vessel line. The percent plaque area was calculated as (1– lumen area/vessel area) ×100. The arterial remodelling index (RI) was also assessed and was calculated by the vessel area at the lesion site with maximal lumen narrowing divided by the reference vessel area for each vessel. The vessel area ratio was defined as the ratio of the reference vessel area between the LMT and the MV or the BV, and was calculated by the reference vessel area of the MV or the BV divided by that of the LMT.
The plaque volume and plaque consistency were assessed automatically by Colour Code Plaque™ (CCP) analysis (GE Healthcare)13,14. The CCP analysis was based on the stratified CT density within 5 mm proximal in the LMT and distal in the MV from the carina. The plaque consistency was classified into two categories, <50 HU as a low attenuation plaque and 50 HU to 150 HU as an intermediate attenuation plaque.
The plaque distribution around the LMT bifurcation area was assessed for the long and short axes (Figure 2). In the long axis view, bifurcation lines were defined as the extended line from the carina (black dotted lines) and the plaque position was classified into six parts: “A” and “B” were the outer side of the LMT-TV; “C” was the carina side of the TV; “D” was the carina side of the BV; and “E” and “F” were the outer side of the LMT-BV (Figure 2A). In the short axis view, the plaque position was assessed 1 mm distal from the bifurcation line (red dotted lines) and was classified into eight parts: “a” and “h” were the outer wall side; “b” and “g” were the myocardial side; “c” and “f” were the pericardial side; and “d” and “e” were the carina side in the MV and in the BV, respectively (Figure 2B). Regarding the short axis division, we referred to the previous study published by van der Giessen et al15. We next checked the plaque distribution and counted the number of plaques located in both the long and short axes in all lesions.
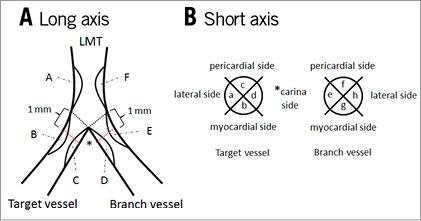
Figure 2. The description of plaque distribution at the LMT bifurcation area. The bifurcation lines were defined as the extended line from the carina (black dotted lines). A) The long axis view. The plaque position was classified into categories from ‘A’ to ‘F’. B) The short axis view. The plaque position was classified into categories from ‘a’ to ‘h’ at 1 mm distal from the bifurcation lines (red dotted lines). LMT: left main trunk
All data were analysed using the Advantage Workstation software programme, version 4.4 (GE Healthcare, Milwaukee, WI, USA) by two cardiovascular physicians who were blinded to the study results. In case of disagreement, the opinion was made by consensus.
STATISTICAL ANALYSIS
Continuous data were summarised as the means ±SD. Categorical data were summarised as counts and percentages. Unpaired t-tests were used for comparing the continuous variables, and the chi squared test and Fisher’s exact test were used for categorical variables. A multivariate analysis was used to examine independent risk factors related to the progression of the BV stenosis. A value of p<0.05 was considered to be statistically significant. All statistical analyses were performed with the JMP statistical software programme version 9.0.2 (SAS Institute Japan, Tokyo, Japan).
Results
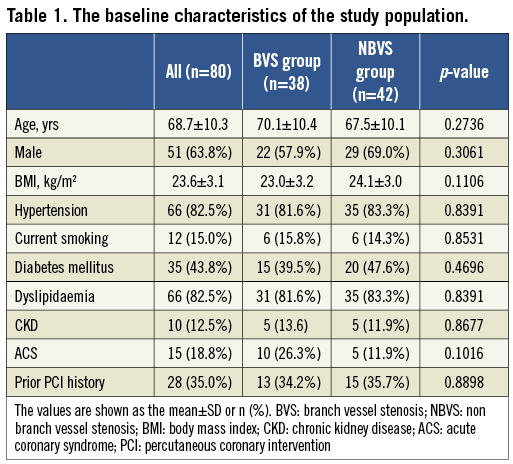
The study flow chart is shown in Figure 1. Finally, a total of 80 patients (51 males, mean age 68.7±10.3 years) with 80 LMT bifurcation lesions were investigated, and 38 patients (47.5%) were assigned to the BVS group and 42 (52.5%) were assigned to the NBVS group. Their baseline characteristics are listed in Table 1. There were no significant differences in these characteristics between the two groups.
The lesion characteristics, procedural information and data from CT are summarised in Table 2. Regarding the bifurcation information, there was no significant difference in the true bifurcation rate between the BVS group and NBVS group (23.7% vs. 14.3%; p=0.2880), whereas the ∠LMT-TV was significantly wider in the BVS group than in the NBVS group (140.2±10.3 degree vs. 132.6±14.2 degree, p=0.0076). The bifurcation plaque components evaluated by CCP analysis were similar in their proportion between the two groups, and about 70% of the plaque components were fibro-calcified over 50 HU in both groups. The correlation between the plaque distribution and the frequency around the LMT bifurcation is shown in Figure 3. The frequency of the “C” in the long axis and the “d” in the short axis were significantly higher in the BVS group compared with the NBVS group (50.0% vs. 16.7%; p=0.0012, 63.2% vs. 38.1%; p= 0.0251, respectively).
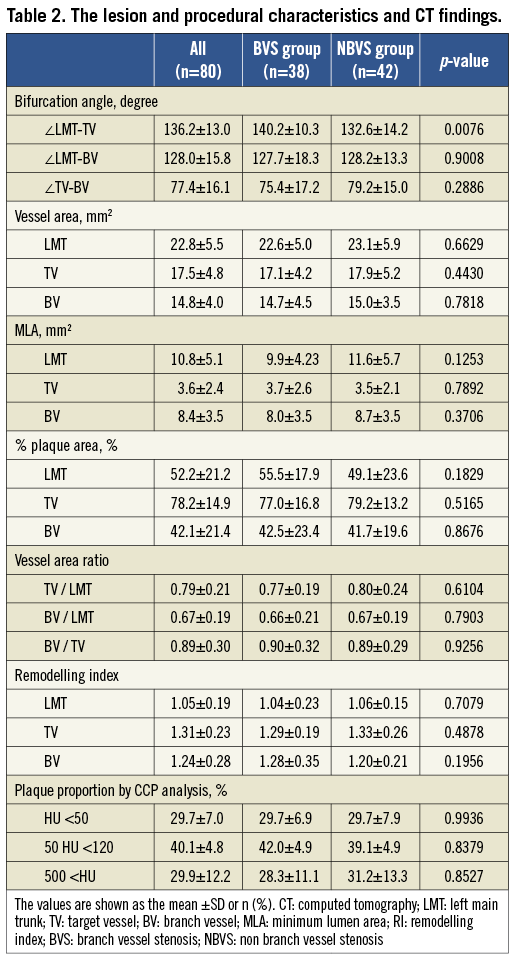
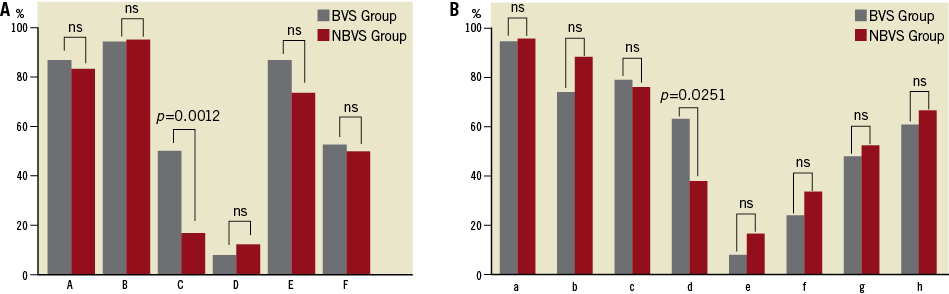
Figure 3. The plaque distribution pattern at the LMT bifurcation area in the long axis and short axis views. A) The long axis view pattern. B) The short axis view pattern. The frequency of the “C” in the long axis view and the “d” in the short axis view were significantly higher in the BVS group compared with the NBVS group (50.0% vs. 16.7%; p=0.0012, 63.2% vs. 38.1%; p=0.0251, respectively). BVS: branch vessel stenosis; NBVS: non-branch vessel stenosis; LMT: left main trunk
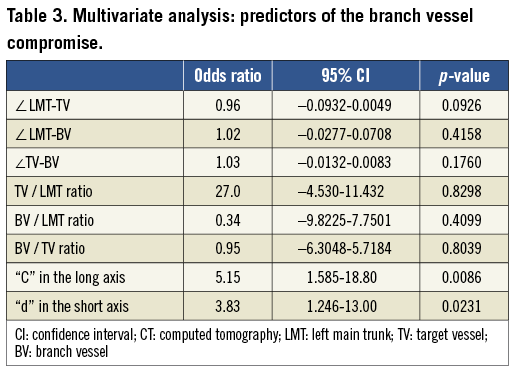
In the multivariate analysis, the plaque deposit at “C” in the long axis and that at “d” in the short axis were identified as the independent predictive factors which might influence the BVS (odds ratio [OR]: 5.147, 95% confidence interval [CI]: 1.585 - 18.80, p=0.0086, OR: 3.832, 95% CI: 1.246-13.00, p=0.0231, respectively) (Table 3).
Representative cases are shown in Figure 4 and Figure 5.
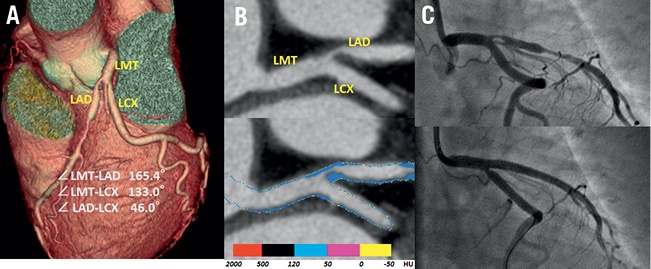
Figure 4. A representative case with carina shift. The cardiac CT images showed a severe stenosis in the ostial LAD (A) three-dimensional volume rendering image. B) Curved multiplanar reconstruction image clearly showed the plaque at the carina in the target vessel (upper), and the plaque components were depicted as fibrous plaque of more than 50 HU by the colour code plaque analysis image (lower). C) Coronary angiography before stenting (upper) and just after stenting (lower); the ostial LCX was compromised just after LMT stenting. LMT: left main trunk; CT: computed tomography; LAD: left anterior descending artery; LCX: left circumflex coronary artery; HU: Hounsfield unit
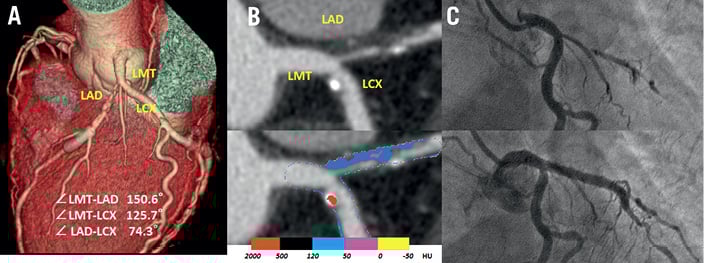
Figure 5. A representative case without carina shift. The cardiac CT images showed a severe stenosis in the ostial LAD. A) Volume rendering 3-D image. B) Curved multiplanar reconstruction image showed the plaque at the opposite site of carina in the target vessel (upper), the colour code plaque analysis image (lower). C) Coronary angiography before stenting (upper) and just after stenting (lower); the ostial LCX was not compromised after LMT stenting. LMT: left main trunk; CT: computed tomography; LAD: left anterior descending artery; LCX: left circumflex coronary artery; HU: Hounsfield unit
Discussion
Current guidelines recommend surgical intervention as the “gold standard” for the treatment of unprotected LMT lesions3,4. However, since DES has become common in the clinical field, DES has been used aggressively, even in the LMT bifurcation lesions, and the single-stent strategy across the BV is now fundamentally recommended by general consensus16-20. In addition, several recent studies have shown both mid- and long-term safety and efficacy of DES for LMT lesions21-24. However, about 60% of all bifurcation cases demonstrate disease involvement in the BV ostium25, and BV compromise can occur under such conditions. In particular, the BV compromise may become a serious situation for LMT bifurcation lesions, and therefore, the prediction of whether BV compromise will occur is important.
Previous studies using either IVUS6 or invasive angiography1,5,26 have shown the plaque distribution to have an important effect on BV compromise during bifurcation treatment. Recent remarkable developments in CT technology have now made it possible to noninvasively obtain detailed information on the coronary bifurcation anatomy, including the plaque distribution and the plaque properties, with excellent diagnostic accuracy.
To the best of our knowledge, this is the first clinical study to examine the mechanism and incidence of BV compromise after stenting during the treatment of LMT bifurcation lesions by the use of cardiac CT. The major findings of the present study are that the plaque distribution at the carina side in the TV wall is a predictor of BV compromise during stenting in the LMT bifurcation lesions, and that these plaque components are disclosed as fibrous plaques over 50 HU in the CCP analysis (Figure 4).
PLAQUE DISTRIBUTION ASSESSED BY CARDIAC CT
IVUS examination is well known as one of the best modalities to assess intracoronary plaques27-31. However, the IVUS catheter and guidewire bias affect the bifurcation geometry and cardiac pulsation also affects the IVUS image. In contrast, CTA noninvasively provides precise 3-D information about the coronary bifurcation angle and the plaque distribution pattern. In addition, regarding the morphological analysis of the plaque, it has been reported that CTA has a high concordance to IVUS measurements7,8.
Although previous IVUS studies reported that no plaque was documented in the area of the carina32,33, a recent bifurcation study assessed by CT revealed the plaque distribution in the coronary bifurcation and demonstrated that plaque was observed in the area of the carina accompanied by plaques in the adjacent outer lateral wall15. A more recent IVUS study also demonstrated plaque distribution at the carina in approximately 30% of the bifurcations34. These observations correspond to the theory that atherosclerotic plaque “grows” from the circumferential wall where there is thought to be a lower shear stress in a bifurcation15,35,36. In the present study, the plaque distribution in the LMT bifurcation was clearly demonstrated by CT examination, and the plaque distribution was more frequently observed in the outer lateral wall side than at the carina wall side, according to the grade of shear stress, similar to the previous CT study15. It is worth noting that the distribution of the plaque in a lateral wall side was frequently observed both in the BVS group and in the NBVS group, but it did not affect whether the BV would be compromised. In contrast, in the carina side, plaque distribution was infrequently observed in both groups, but a significant difference in the occurrence of BV compromise was observed between the two groups.
MECHANISMS BEHIND A CARINA SHIFT
The recent concept regarding the BV compromise after TV stenting refers to a “carina shift” rather than a “plaque shift”9,10,37. This theory is based on a recent study where patients were assessed by IVUS, which reported that no plaque was found in most patients at the level of the carina33. However, a more recent study using CTA and IVUS disclosed the presence of plaque in 30% of bifurcations requiring intervention15,34, which was similar to our present results.
Interestingly, the components of all plaques observed on the carina side in both groups were depicted, not as soft attenuation plaques (<50 HU), but as intermediate attenuation plaques (>50 HU) by the CCP analysis in our present study (Figure 4). This would coincide with the theory that plaques grown into the carina are observed in more advanced atherosclerotic stages15. According to recent consensus, the main mechanism involved in BV compromise after stenting is carina shift9,10,37. The facts disclosed by our study also support the theory of carina shift. Namely, that intermediate plaques may exert a “mass-effect” toward the BV during TV stenting in bifurcation lesions, which thereby contribute to BV compromise after TV stenting.
On the other hand, neither the bifurcation angle nor the selected stent diameter had any effect on the BV compromise in our study. These two factors are thought to be powerful predictors of side branch compromise after main branch stenting. Vassilev et al showed that the bifurcation angle between the LMT and the BV was an important factor involved in BV compromise from an angiographic analysis38. However, it is well known that the 3D-VR on CT can provide more accurate information about the coronary bifurcation angle39,40 than conventional coronary angiography. In short, the differences in the imaging modality might have affected our results.
Regarding the stent diameter used to treat bifurcation lesions, it is recommended that a stent diameter should be selected according to Murray’s law to decrease the risk of BV compromise41,42. In this study, we measured each vessel diameter by cross-sectional imaging on CT and found that there were no significant differences between the two groups.
Study limitations
The present study has several limitations. First, this study was a single-centre retrospective study which thus had a relatively small study population.
Second, we examined the mechanisms of BV compromise during TV stenting based on the findings of CT examinations in the present study. Therefore, we measured the vessel size from the cross-sectional image and evaluated the plaque volume and morphology based on the CCP analysis. However, the limitations in the spatial resolution or partial volume effect caused by the contrast media may obscure the border of the vessel wall and, therefore, measuring the exact vessel size and evaluating the plaque characteristics from the CT image remains a difficult challenge. In addition, since IVUS was not routinely performed for all vessels, we could not compare the IVUS images with the CT images.
Third, in the present study, the second CT scan immediately after PCI was not taken to confirm whether carina shift had taken place. It is difficult to assess carina shift using MDCT because it is necessary to dilate the stent struts with simultaneous balloon dilation if the BV were to compromise after stenting. Additionally, the spatial resolution of MDCT is not adequate to complete a detailed evaluation of plaques distribution after stenting. Excessive radiation exposure due to repeated CT scanning also cannot be ignored.
Finally, this study was only focused on LMT bifurcation lesions. Therefore, whether the results of our study can be applied to other bifurcation lesions remains unclear.
Conclusion
The present study demonstrated that plaque distribution and plaque morphology assessed by CT may provide useful information for the operators, and can predict the potential compromise of the BV during treatment for an LMT bifurcation lesion. A larger study population and better resolution CT should be included in a future study to obtain a more exact prediction of BV compromise due to carina shift, and for a more exact evaluation of the plaque morphology during the treatment of LMT bifurcation lesions.
Acknowledgements
The authors thank Miss Mayumi Tsujisho and the other staff members of the cardiac CT unit at our hospital for their technical support for CT scanning and image reconstruction, and Yoshinobu Murasato, MD, for his valuable advice.
Conflict of interest statement
The authors have no conflicts of interest to declare.