Abstract
Aims: Early atherosclerosis is located in low wall shear-stress (WSS) regions, however plaques are also found in the high WSS sensing flow divider walls of coronary bifurcations. We assessed the plaque distribution and morphology near bifurcations non-invasively with 64-slice computed tomography in relation to the WSS distribution.
Methods and results: We inspected 65 cross-sections near coronary bifurcations for the presence of plaque. Cross-sections were divided into four equal parts, which we numbered according to expected levels of WSS, with part I the lowest WSS (outer wall) and increasing WSS’s in part II (inner bend), III (outer bend) and IV (flow divider).
Of the cross-sections 88% had plaque. Of all parts I, 72% contained plaque. This was 62%, 38% and 31% in parts II, III and IV. In cross-sections with only 1 or 2 parts inflicted, plaque was found in part I and/or II in 94%. In 93% of the cross-sections with the flow divider inflicted, parts I and/or II were also inflicted. Plaque was never found exclusively in the flow divider part IV.
Conclusions: We demonstrated that plaque is mostly present in low WSS regions, whereas plaque in high WSS regions is accompanied by plaque in adjacent low WSS regions. It is therefore plausible that plaque grows from the outer wall (low WSS) of the bifurcation towards the flow divider (high WSS).
Abbreviations list
D1: first diagonal coronary artery bifurcating from the LAD
LAD: left anterior descending coronary artery
LAD: dist part of the left anterior descending coronary artery distal to the D1
LCX: left circumflex coronary artery
LM: left main coronary artery
MSCT: multislice computed tomography
MSSI: mean shear stress index
RMSSI: reference mean shear stress index
WSS: wall shear stress
Introduction
The formation of atherosclerosis in coronary arteries is localised1,2. A key player in localising atherosclerosis is low wall shear stress (WSS)3,4. In the presence of systemic risk factors, a vessel wall that is exposed to low WSS is more prone to develop atherosclerotic plaques5,6.
The WSS to which a vessel wall is exposed, is mainly determined by arterial geometry. In bifurcating arteries, the outer wall is exposed to low WSS compared to the flow divider wall7,8. In curved arteries, low and high WSS regions are present at the inner and outer bend, respectively9. Intravascular ultrasound studies show that plaques are predominantly found in low WSS regions10-13.
In clinical practice, however, it is common to observe plaques that cause lumen narrowing not only at low WSS regions but also at the high WSS sensing flow divider of coronary bifurcations. Even in the classifications schemes used for typing bifurcation lesions on coronary angiography, most of the bifurcation types have luminal narrowing in the flow divider region of the side-branches14,15. Plaques incorporating the flow divider are found more frequently in symptomatic patients, and thus may represent a more advanced stage of atherosclerosis. Apparently in this stage of the disease plaques are not limited to low WSS regions.
Angiography is only one of several imaging modalities to visualise the presence of atherosclerosis in the coronary arteries16. Recently several studies have shown the ability of multislice computed tomography (MSCT) angiography to detect coronary plaques non-invasively17. In contrast to conventional angiography, MSCT angiography gives 3D information about the coronary geometry and not only the lumen is visible, but also the vessel wall harbouring the atherosclerotic plaque18,19. This enables MSCT coronary angiography to detect atherosclerosis also in remodelled arteries without severe lumen narrowing20,21.
In this study we imaged non-invasively with MSCT angiography the 3D geometry of the lumen and vessel wall of coronary artery bifurcations in patients. On the basis of geometry, we labelled regions in bifurcations according to the expected WSS in each region and related the WSS to the plaque frequency, distribution and morphology.
Materials and methods
Study population
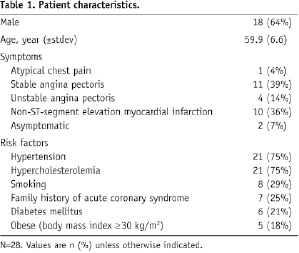
We retrospectively studied 28 (18 male, mean age 59.9 ± 6.6 years) consecutive symptomatic patients, suspected of coronary artery disease who underwent MSCT coronary angiography. Patient demographics are given in Table 1.
The patients had sinus heart rhythm, were able to hold breath for 15 s and had no contra-indications to iodinated contrast material. We only included patients who had not previously undergone percutaneous intervention or coronary bypass surgery, and had a heart rate lower than 65 beats per minute during scanning. Our institutional review board approved the study protocol, and all patients gave informed consent.
Scan protocol and image reconstruction
The patient preparation, scan protocol, and image reconstruction procedure have been previously described22. Briefly, patients with heart rates above 70 beats per minute received heart rate lowering drugs before scanning. Scanning was performed on a 64-slice MSCT scanner (Sensation64®, Siemens, Germany) according to a standardised optimised contrast (Iomeron 400®, Bracco, Italy) enhanced scanning protocol. A bolus tracking technique was used to synchronise the arrival of contrast in the coronary arteries with the initiation of the scan. Images were reconstructed with ECG-gating, initially during the mid- to end-diastolic phase (350 ms before the next R wave) with a temporal window of 165 ms. If image quality was poor, more reconstructions at different phases of the cardiac cycle were generated to improve it. The dataset with the best image quality was chosen for further processing. The in-plane voxel size was approximately 0.3 mm and the slice thickness was 0.4 mm.
MSCT image processing
We investigated the plaque distribution in two bifurcations; 1) the LM-bifurcation, which is the branching of the left main (LM) coronary artery into the left anterior descending artery (LAD) and the left circumflex artery (LCX), and 2) the LAD-bifurcation, which is the bifurcation of the first diagonal artery (D1) from the distal LAD (LADdist). To study these bifurcations the reconstructed MSCT datasets were exported from the scanner to MeVisLab (MeVis, Bremen, Germany), a development environment for image processing and visualisation.
The two bifurcations were analysed separately. We defined a plane through each bifurcation, such that both the main branch and the side-branches were visible in this plane and that the angle between the side-branches was maximal (Figure 1A and 1B). Perpendicular to this plane and the vessel axis, one cross-section of each of the side-branches was obtained 1 mm distal to the flow divider (see Figure 1C).
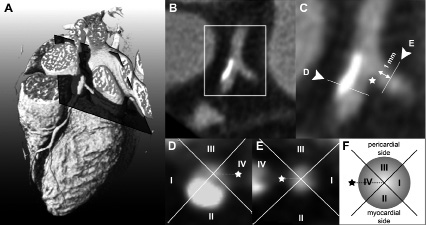
Figure 1. Extraction of the cross-section to be analysed from the 3D dataset. Panel A shows a volume rendered MSCTA dataset with a plane through the mother and side branches of the bifurcation of interest. This plane is shown in B and a magnification in C. In C, the indicates the flow divider and the arrows indicate the position of the cross-sections shown in D and E. The sketch in F illustrates the division into parts and also the numbering according to the expected shear stress levels, which is also applied in D and E.
We excluded trifurcations from the analysis (n=21). Cross-sections were excluded when the diameter of the artery was < 1 mm (n=2), or when the plaque was too heavily calcified to clearly distinguish the lumen from the plaque (n=3), see also Figure 2. In total we analysed 65 cross-sections for this study.
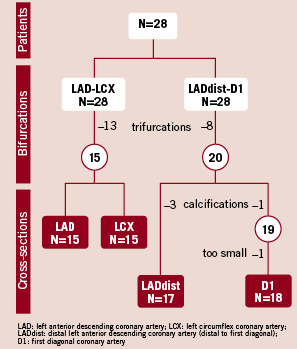
Figure 2. Inclusion flowchart. Bifurcations are excluded as they appeared to be trifurcations. Cross-sections are excluded in case of extensive calcifications or limited size. N indicates the number of patients, bifurcations or cross-sections.
Shear stress
To relate the plaque location to WSS, we divided each cross-sections into four parts from the center of the lumen. The cross-section was divided is such way that the flow divider was in the middle of one of the parts. We labelled the part covering the outer wall of the bifurcation, I; the part facing the myocardial side of the heart, II; the part facing the pericardium, III; and the part containing the flow divider, IV (Figure 1D and 1E).
The bifurcation affects the WSS pattern primarily. High WSS is assumed in part IV due to the flow-division at the flow divider, while in part I, the outer, non-flow divider wall, low WSS is expected. Besides the effect of the bifurcation, the curvature of the artery over the myocardium also influences WSS23. In comparison to part III, the WSS is assumed to be lower in part II, because the inner wall of a curved vessel is subjected to lower WSS than the outer wall. Thus, the numbering of the parts is according to the expected WSS: in part I the lowest and in part IV the highest WSS (Figure 1F).
Plaque identification
In each cross-section, all parts were inspected for the presence of plaque. Plaque was defined as any discernible structure with 1) a lower attenuation than the contrast enhanced lumen and higher attenuation than the surrounding epicardial fat or 2) an attenuation ≥140 HU that could be separately visualised from the lumen (calcified part). The plaque had to be present at the cross-section of interest and at at least one cross-section adjacent (0.5 mm distance) to the cross-section of interest. When a cross-section had calcified parts, we also denoted the part that contained the densest structure, thus with the highest Hounsfield Unit.
The cross-sections with plaque present in only 1 part, we called minimally inflicted. When in 2, 3 or 4 parts plaques were observed we called these cross-sections respectively mildly, moderately and severely inflicted.
Statistical analysis
To test whether plaque occurs in a preferential part of a cross-section, we used the numerical values assigned to each part. For each cross-section we computed the mean of the numbers of the parts that contain plaque. This mean value we call the mean shear stress index (MSSI). For instance, when plaque is present in the low WSS regions, thus in part I and II, than the MSSI of that cross-section is (1+2)/2=1.5. When plaques are randomly distributed over the numbered parts, and thus have no preferential location, the averaged MSSI is by definition 2.5. We denote this reference value as RMSSI. If the MMSI is lower than 2.5, plaque is located mainly in the low WSS part of cross-section, and if it is higher, plaque is mainly present in the high WSS part of the cross-section.
We calculated the average MSSI over all cross-sections, and separately over the minimally, mildly, moderately and severely inflicted cross-sections and reported the values as mean±std.
With a student-t-test we tested whether the averaged MSSI was significantly different (p<0.05) from the RMSSI of 2.5.
Results
General
Most patients (96%) had plaque in one or more of the studied cross-sections. Of the 65 cross-sections 88% contained plaque. In the D1 branch, which is generally smaller than the other inspected branches, atherosclerosis was observed less often than in the other branches. Only 75% of the D1 cross-sections contained plaque versus 93%, 86% and 94% of the LAD, LCX and LADdist branches.
Calcified plaques were found in 62% of the patients, and in 29% of the cross-sections. Of the LADprox and LADdist 37% and 42% of the cross-sections were affected by calcium, whereas only 5% and 16% of the LCX and D1.
Plaque distribution
Plaques were found in low WSS parts I and II in 72% and 62% of the cross-sections. The high WSS parts III, and IV were less often affected than parts I and II, only in 38% and 31% of the cross-sections (Figure 3).
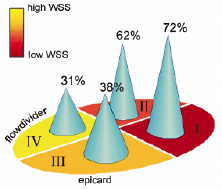
Figure 3. Plaque distribution. The figure gives the percentage of occurrence of plaque in each part, i.e. 72% of all low WSS parts I were inflicted with plaque.
The distribution of the plaque configurations is in more detail given in Figure 4.
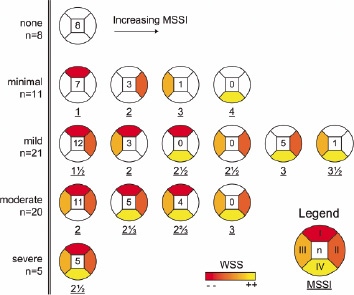
Figure 4. Plaque configurations. All possible plaque configurations are shown, sorted from top to bottom on the basis of the number of affected parts and from left to right according to increasing mean shear stress index (MSSI). Each configuration depicts both the number of times (n) that it is observed and its MSSI (underlined). The parts are coloured according to the expected wall shear stress level (see legend).
From the top to the bottom the rows show the possible plaque configurations for minimally, mildly, moderately and severely inflicted cross-sections. For each configuration the number of observations is given as well as the corresponding MSSI value.
We found 8 cross-sections without plaque. In 10 of the 11 minimally inflicted cross-sections plaque was present in the low WSS parts I or II. The high WSS part IV was not affected once. In the 21 mildly inflicted cross-sections (2 parts inflicted per cross-section) we did not find configurations in which plaques are opposite to each other. Again, as in minimally inflicted cross-sections, the low WSS parts contained plaque most often. In the 20 moderately inflicted cross-sections (3 parts inflicted) plaque was always at least present in the lowest WSS part I. We found 5 severely inflicted cross-sections.
Plaque at the flow divider was found in 20 out of the 65 analysed cross-sections. The flow divider was never affected in minimally inflicted cross-sections, while 6 out of 21 of the mildly inflicted cross-sections, 9 out of 20 of the moderately inflicted cross-sections, and 5 out of 5 of the severely inflicted cross-sections were affected in the flow divider. In 19 out of the 20 cross-sections plaque in the flow divider was accompanied by plaque in low WSS regions I or II.
Figure 3 also shows that the plaque configurations with the lowest MSSIs are the configurations that we observed most frequently. Figure 5 shows the averaged MSSI for all, the minimally, mild, moderately and severely inflicted cross-sections.
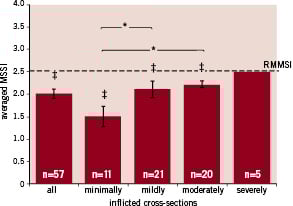
Figure 5. Mean shear stress values (MSSV) of plaques. The averaged MSSI±variance is shown of the plaque parts over all, the minimally, mildly, moderately and severely inflicted cross-sections. The reference MSSI (RMSSI) is indicated at 2.5. The number of cross-sections is indicated with n. *, significant difference (p<0.05) between the MSSIs. ‡: MSSI lower (p<0.05) than the RMSSI.
If the plaques are located preferentially at specific regions, the MSSI will be significantly different from the reference value, the RMSSI, which is 2.5. The averaged MSSI over all cross-sections was with 2.02±0.62 lower than the RMSSI (p<0.05). When we divided the cross-sections according to the severity of infliction, the averaged MSSIs were also lower than the RMSSI with the exception of the severely inflicted cross-sections, which by definition equal the RMSSI. The MSSI increases with the severity of infliction because more high WSS parts get involved.
Calcium distribution
Similar to the plaque distribution, the densest calcium spot was mostly found in the low WSS parts I and II. Both part I and part II were inflicted with calcium in 17% of the cross-sections while parts III and IV were only inflicted in 6% and 3% of the cross-sections.
Figure 6 shows all 19 cross-sections with calcium according to the severity of plaque inflictions from top to bottom.
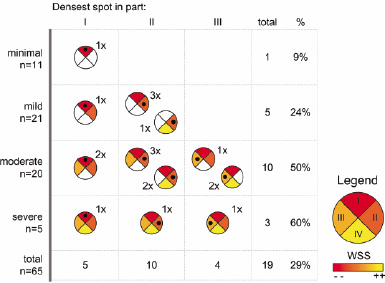
Figure 6. Plaque configurations with calcium. Plaque configurations with calcium are shown and sorted from left to right according to part with the calcium spot. From top to bottom, the cross-sections are sorted by the severity of plaque infliction. The • indicates the position of the densest calcium spot.
From left to right the configurations are ordered according to the part with the densest spot, which is indicated with a black dot in the cross-sections.
Of the 11 minimally inflicted cross-sections, only 1 (9%) was calcified. The percentage of cross-sections with calcium increased with the severity of infliction up to 60% for the severely inflicted cross-sections. The densest spot of the calcification was never found in high WSS part IV. Most of the calcified cross-sections (n=10) have the densest calcium spot in part II. Part I has the spot in 5 cross-sections and part III in 4 cross-sections. The plaques with the densest spot in part III always were in moderately or severely inflicted cross-sections.
Discussion
We reported on the plaque distribution in human coronary arteries assessed by MSCT in relation to expected shear stress patterns. We demonstrated that plaques in coronary artery bifurcations are most often located in the low WSS regions and that plaques at the flow divider, which is exposed to high WSS, are always accompanied by plaques in a low WSS region, where plaques are supposed to originate from.
To compare our findings with histological reports in literature on the different phases of atherosclerosis we distinguish three phases in our study. A minimally inflicted cross-section can be considered as early atherosclerosis, mildly and moderately inflicted cross-sections as more advanced atherosclerosis, and severely inflicted cross-sections as severe atherosclerosis. In early atherosclerosis we observed that plaque distal to a bifurcation was mainly found at the wall opposite the flow divider. This is in agreement with histological findings of early atherosclerosis in the LM bifurcation of young adults24. In an older population, Grøttum et al studied the deposition of atherosclerosis also in the LM bifurcation25. Most plaques distal to the bifurcation were observed opposite to the flow divider and slightly directed to the myocardium. In our study, we observe plaque in similar regions. These are the regions where we expect low WSS.
Our results are supported not only by histological findings, but also by intravascular ultrasound studies on plaque distribution near coronary bifurcations. These studies often include patient groups who have lumen narrowing on angiography and who may thus have advanced to severe atherosclerosis. Shimada et al demonstrated that the plaque area was larger at the opposite wall of the flow divider than at the flow divider itself26. The influence of the curvature of the arteries near bifurcations was investigated by Iwami et al13 using a combination of intravascular ultrasound and angiographic data. The percentage of plaque in the total cross-sectional plaque area was highest at the inner curve of the bifurcation and this was most pronounced in the most curved arteries. Badak et al incorporated the position of the myocardium in their analysis. They found that when a side-branch was perpendicular to the artery the maximum plaque thickness was found at 190°±70°, thus opposite the side branch, slightly in direction of the myocardium27. To compare his results to our findings we calculated the average angle in a similar way in the mild and moderately diseased cross-sections and found that it was very close to that found by Badak, that is 205°±68°. Thus, on the basis of the plaque distribution observed in our study and in other studies, we show that not only the bifurcation contributes to the low WSS region and initiates plaque formation, but also the curvature of the arteries over the myocardium.
Other studies lack detailed information on the distribution of calcifications with respect to the position of the bifurcation and myocardium. It is known that most calcium is found near bifurcations and that it initially occurs in the necrotic core of the plaque due partly to apoptosis of vascular smooth muscle cells or macrophages28. In our data the calcium spot was found more often at the myocardial side (part II) of the coronary artery than at the outer wall of the flow divider (part I), which is what one would expect on the basis of the plaque distribution. We observed calcium once in a cross-section that was mildly inflicted and thus was by our definition, an early form of atherosclerosis. Due to expansive remodelling, it is possible that an advanced plaque only occupies one part of the cross-section instead of growing into the high WSS parts. This might explain the presence of calcium in a cross-section with only one inflicted part.
Although we did not follow patients over time, several observations indicate that plaques grow circumferentially from a low WSS region into the high WSS flow divider. The first is that the flow divider was never diseased in early atherosclerosis. Secondly, low WSS regions were in all stages of the disease most often affected. Thirdly, if there is plaque at the flow divider, the low WSS regions are also diseased. The fourth observation, that plaques are always found adjacently in low and high WSS regions indicate that growth is indeed circumferential. We already mentioned that low WSS regions are predilection sites of early atherosclerosis. As the plaque matures, fissuring at the shoulders of the plaque can cause the plaque to grow from the low WSS region along the circumference of the lumen29.
Many studies on plaque distribution in human coronary arteries use IVUS as imaging modality. With its high resolution, it is the gold standard for determining lumen and plaque size. However, IVUS is invasive and as 3D information is lost, it is hard to identify the pericardial and myocardial side of a bifurcation. The influence of the curvature of the artery over the myocardium on plaque localisation can therefore not be taken into account. Currently, MSCT angiography is the only non-invasive imaging modality that can provide both 3D lumen and plaque distribution. High sensitivities and specificities are achieved in scoring significant lesions on 64-slice MSCT angiography images30 and the first comparisons with IVUS on plaque measurements are promising20.
However, due to limitations of the MSCT angiography technique, measuring the exact size and position of the atherosclerotic plaque remains a challenge. In the first place, partial voluming effects caused by the high intensity calcium and contrast agent can obscure the vessel wall. Secondly, the resolution of MSCT angiography images cannot compete with those of IVUS: MSCT angiography cannot visualise small branches and intimal thickening. Because of these limitations we decided to exclude the heavily calcified bifurcations and very small arteries from our analysis. In the analysis we chose to introduce a scoring system to assign the presence of plaque in predefined parts instead of measuring wall thickness. For calcified plaques, we determined only the densest part of the calcium.
A second limitation is that we included only two types of bifurcations in our study and only of the left coronary tree. We inspected two relatively large bifurcations, which could be easily identified in the MSCT datasets and which are often treated by catheterisation. Although we excluded inspection of the complete right coronary artery tree, we do not expect WSS to influence plaque distribution here in a different way1. Despite the limited resolution of MSCT, we observed a large number (more than one third) of bifurcations that appeared to be trifurcations in our dataset. We excluded these trifurcations because WSS is hard to predict in these geometries. This reduced the number of bifurcations inspected.
A third limitation is that we defined the WSS patterns on the basis of general geometrical features of coronary arteries, being the bifurcation and curvature. Local and patient specific varieties in geometry and/or flow may cause the actual WSS to deviate from the expected WSS distribution. This might explain the single observation of a plaque localised in an expected high WSS region.
We assessed plaque frequency, distribution and morphology near coronary bifurcations with MSCT. Our results are in good agreement with previous findings in IVUS and confirm that in early atherosclerosis, plaques are limited to the low WSS regions and that the plaque distribution is not only influenced by the bifurcation but also by the curvature of the arteries. A new observation is that we showed that the calcified spots in more advanced plaques are mostly located in the low WSS regions. Besides this we presented that circumferential growth of the plaque from the low WSS region into the high WSS regions is a plausible explanation for the presence of plaque in the high WSS sensing flow divider.