Abstract
Background: Initial data about the performance of the new-generation SAPIEN 3 Ultra (S3U) valve are highly promising. However, evidence about the longer-term performance and safety of the S3U is scarce.
Aims: We aimed to investigate the 1-year clinical and echocardiographic outcomes of transcatheter aortic valve implantation (TAVI) using the S3U compared with its predecessor, the SAPIEN 3 valve (S3).
Methods: The SAPIEN 3 Ultra registry included consecutive patients who underwent transfemoral TAVI at 12 European centres with the S3U or S3 between October 2016 and December 2020. One-to-one propensity score (PS) matching was performed to account for differences in baseline characteristics. The primary outcomes of interest were all-cause death and the composite of all-cause death, disabling stroke and hospitalisation for heart failure at 1 year.
Results: The overall study cohort encompassed 1,692 patients treated with either the S3U (n=519) or S3 (n=1,173). The PS-matched population had a total of 992 patients (496 per group). At 1 year, the rate of death from any cause was 4.9% in the S3U group and 6.3% in the S3 group (p=0.743). Similarly, there were no significant differences in the rates of the primary composite outcome (9.5% in the S3 group and 6.6% in the S3U group; p=0.162). The S3U was associated with lower rates of mild paravalvular leak (PVL) compared with the S3 (odds ratio 0.63, 95% confidence interval: 0.44 to 0.88; p<0.01). No significant differences in transprosthetic gradients were observed between the two groups.
Conclusions: Compared with the S3, the S3U transcatheter heart valve was associated with similar 1-year clinical outcomes but reduced rates of mild PVL.
Introduction
Transcatheter aortic valve implantation (TAVI) is an established treatment for patients with severe symptomatic aortic stenosis (AS) who are at increased surgical risk123. Recently, TAVI has been expanded to treat low-risk patients345. However, there are still concerns regarding the rate of permanent pacemaker implantation (PPI), valve durability and the incidence of paravalvular leak (PVL). The latter remains a main concern because it is well known that moderate to severe PVL is associated with an increased risk of mortality6. It remains unknown whether mild PVL affects outcomes7, although recent evidence suggests an association with increased mortality89. As we are moving to treat low-risk and younger patients, it is essential to further improve TAVI performances in terms of residual PVL (any grade), with the aim of approaching those rates seen with surgical bioprostheses45.
Over the past several years, the technological advancement of new-generation TAVI devices has been focused on the minimisation of PVL1011. In fact, the latest-generation balloon-expandable transcatheter heart valve (THV), the SAPIEN 3 Ultra (S3U; Edwards Lifesciences) incorporates an outer skirt made from a textured polyethylene terephthalate (PET) which is 40% higher than that of the SAPIEN 3 (S3) to achieve better sealing. Initial data about the early post-implantation performance of S3U are promising, especially in terms of a reduced PVL rate121314. However, there are limited data about the longer-term clinical outcomes and haemodynamic performance of the S3U15. Therefore, the principal aim of this study was to assess the clinical and echocardiographic outcomes at 1 year with the S3U compared to its predecessor, the S3 THV.
Methods
Study population
The SAPIEN 3 Ultra registry12 is an international, multicentre, observational, physician-led study that included consecutive patients with symptomatic severe AS who underwent transfemoral TAVI using a SAPIEN 3 Ultra balloon-expandable valve at 12 centres across 4 countries between October 2018 and December 2020 (Supplementary Appendix 1). For comparison, we used an historical cohort of patients who underwent TAVI with the SAPIEN 3 THV from October 2016 to December 2020. We excluded patients who had undergone TAVI with the 29 mm S3, any patients who had undergone TAVI using alternative approaches other than the transfemoral access (non-TF TAVI), and those who had undergone TAVI for failed surgical aortic valve replacement (valve-in-valve). For the purposes of the present analysis, patients with bicuspid aortic stenosis were also excluded. The study was approved by the local ethics committee of the coordinating institution; it was performed in accordance with the Declaration of Helsinki and under the auspices of the Italian Society of Interventional Cardiology (GISE).
The manufacturer of the SAPIEN 3 Ultra and SAPIEN 3 THV, Edwards Lifesciences, had no role in data collection, analysis, or manuscript drafting and did not provide any financial support for the study.
Device description
The SAPIEN 3 Ultra THV has the same cobalt-chromium alloy frame and bovine tissue leaflet design as the S3. The key difference between the two THV is the textured polyethylene terephthalate outer skirt of the SAPIEN 3 Ultra, which is approximately 40% higher compared to that of the S3 and was designed to improve annular sealing and to reduce PVL (Figure 1). The S3U THV is available in 20 mm, 23 mm, and 26 mm sizes, whereas the S3 THV is also available in a 29 mm size. When initially released, the S3U THV was implanted using a novel delivery catheter system (SAPIEN 3 Ultra Delivery System; Edwards Lifesciences) with on-balloon valve crimping and the Axela sheath (Edwards Lifesciences). However, the SAPIEN 3 Ultra Delivery System was issued with a class I recall by the U.S. Food and Drug Administration (FDA)16. Following the recall, the S3U THV was implanted with the same delivery system used for the S3 THV (Commander Delivery System and eSheath; Edwards Lifesciences).
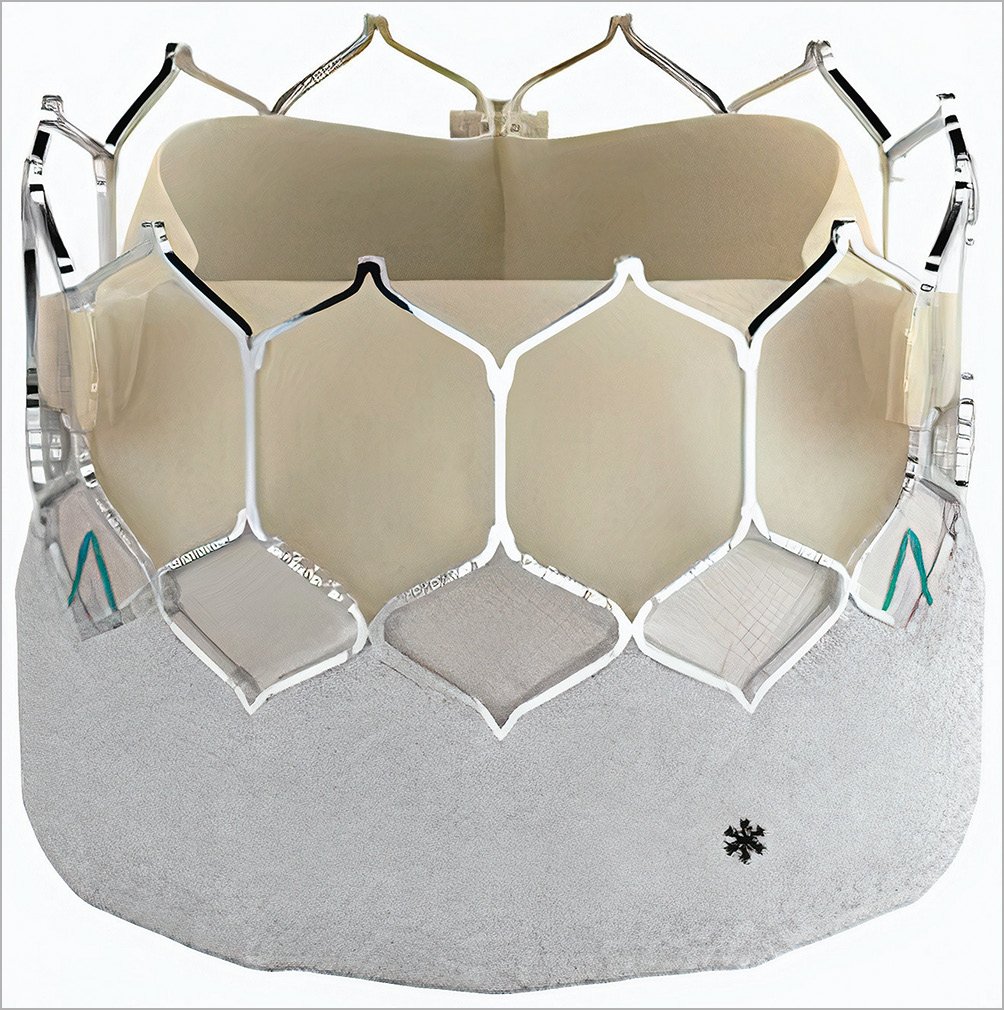
Figure 1. SAPIEN 3 Ultra THV. *Textured polyethylene terephthalate outer skirt, which is approximately 40% higher than the SAPIEN 3 skirt and is designed to improve annular sealing.
Study outcomes
The primary outcomes of this analysis were death from any cause and the composite of death from any cause, disabling stroke and repeat hospitalisation for heart failure at 1 year.
Secondary outcomes of interest were cardiac death, new pacemaker implantation, repeat procedure and all components of the primary composite endpoint at 1 year. The incidence of selected procedural complications and clinical outcomes at 30 days were also considered. All clinical outcomes and procedural complications were assessed according to Valve Academic Research Consortium (VARC)-2 criteria17. Echocardiographic outcomes were evaluated before discharge and at 1 year. Paravalvular aortic leak severity was assessed according to VARC-2 criteria and classified as follows: none, trace, mild, moderate, or severe17.
Statistical analysis
All continuous variables are expressed as the mean±standard deviation (SD) and are compared using the unpaired Student’s t-test. All categorical variables are compared using the chi-square test or Fisher’s exact test. Missing baselines covariates were estimated using the multiple imputation chain method (n=5)18. The propensity score was used to adjust for differences in baseline characteristics and potential confounders that may lead to biased estimates of treatment outcomes. A 1-to-1 nearest-neighbour matching algorithm without replacement (calliper=0.2) was performed to identify PS-matched pairs. This was done by means of a non-parsimonious multivariable logistic regression including the following covariates: age, sex, body mass index (BMI), body surface area (BSA), hypertension, Society of Thoracic Surgeons Predicted Risk of Mortality (STS-PROM) score, NYHA Functional Class III or IV, diabetes, chronic obstructive pulmonary disease (COPD), severe liver disease, atrial fibrillation (AF), peripheral vascular disease, prior stroke, coronary artery disease, prior myocardial infarction, prior percutaneous coronary intervention (PCI), previous coronary artery bypass graft (CABG), other previous cardiac surgery, estimated glomerular filtration rate (eGFR), dialysis, porcelain aorta, cerebrovascular disease, prior permanent pacemaker implantation (PPI), baseline left bundle branch block (LBBB), baseline right bundle branch block (RBBB), baseline first degree atrioventricular (AV) block, left ventricular ejection function (LVEF), transaortic mean gradient, aortic valve area (AVA), moderate to severe mitral regurgitation, moderate to severe aortic regurgitation, severe pulmonary hypertension, THV size, anaesthesia type, left ventricular outflow tract (LVOT) and aortic valve calcium distribution at the pre-TAVI computed tomography (CT). Matching was performed within each imputed dataset using the observed and imputed covariate values. The balance on the matched datasets was assessed by computing the standardised mean difference (SMD) for each covariate. Finally, the treatment effects estimated in each of the matched datasets were pooled together using Rubin’s rules19.
Prespecified primary and secondary outcomes were compared between the S3 and S3U valve groups in both the overall and PS-matched cohorts. The risk of adverse events 1 year after TAVI was compared for both cohorts using Cox proportional hazards regression and Kaplan-Meier analysis.
Statistical analysis was performed using R software, version 4.2.0 (R Foundation for Statistical Computing) and SPSS Statistics, version 25 for Macintosh (IBM). Propensity score and matching procedures were conducted using the MatchThem package in R19.
Results
Baseline characteristics
A total of 1,692 patients who underwent transfemoral TAVI with the S3U (n=519) or S3 (n=1,173) THV were included. Baseline characteristics of the entire study population stratified according to the THV type are presented in Table 1.
Before matching, most characteristics were already well balanced, with the exception of patients treated with an S3U who had a lower mean STS-PROM score (4.0±2.7 vs 4.93±3.82; p<0.01) and more frequently had coronary artery disease (50.4% vs 44.4%; p=0.02), while the degree of calcification of the aortic valve and LVOT was higher in the S3 group.
From the entire cohort, a 1-to-1 propensity score matching analysis (including clinical and anatomical characteristics, THV size and anaesthesia type) resulted in 496 matched pairs. There was no significant difference in any baseline characteristic among the propensity-matched S3U and S3 groups (Figure 2), including the degree of AV and LVOT calcification.
Table 1. Baseline characteristics of registry patients before PS matching.
| Missing(%) | Overall (n=1,692) |
SAPIEN 3 (n=1,173) |
SAPIEN 3 Ultra (n=519) |
p-value | ||
|---|---|---|---|---|---|---|
| Age, yrs | - | 81.7±6.4 | 81.5±6.4 | 82±6.5 | 0.222 | |
| Female | - | 958 (56.6) | 646 (55.1) | 31 (60.1) | 0.054 | |
| Height, cm | - | 161.9±8.9 | 161.8±8.9 | 161.9±8.7 | 0.845 | |
| Weight, kg | - | 71.6±14.5 | 71.7±14.7 | 71.2±13.9 | 0.469 | |
| Body mass index, kg/m² | - | 27.28±5.07 | 27.33±5.15 | 27.16±4.88 | 0.509 | |
| Body surface area, m² | - | 1.78±0.20 | 1.78±0.20 | 1.77±0.20 | 0.480 | |
| STS score | 1.6 | 4.65±3.55 | 4.93±3.82 | 4.0±2.70 | <0.001 | |
| NYHA Class III or IV | - | 914 (54.0) | 627 (53.5) | 277 (53.4) | 0.709 | |
| Hypertension | - | 1,423 (84.1) | 976 (83.2) | 447 (86.1) | 0.130 | |
| Diabetes | - | 494 (29.1) | 351 (29.9) | 143 (27.5) | 0.323 | |
| COPD | - | 292 (17.2) | 214 (18.2) | 78 (15) | 0.107 | |
| Severe liver disease | - | 27 (1.6) | 20 (1.7) | 7 (1.3) | 0.590 | |
| Porcelain aorta | - | 75 (4.4) | 57 (4.8) | 18 (3.4) | 0.200 | |
| Atrial fibrillation | - | 457 (27.0) | 323 (27.5) | 134 (25.8) | 0.463 | |
| Prior PCI | - | 390 (23.0) | 280 (23.8) | 110 (21.2) | 0.228 | |
| Peripheral vascular disease | - | 188 (11.1) | 138 (11.8) | 50 (9.6) | 0.198 | |
| Previous stroke | - | 158 (9.3) | 115 (9.8) | 43 (8.3) | 0.322 | |
| CAD | - | 783 (46.2) | 521 (44.4) | 262 (50.4) | 0.021 | |
| Prior MI | - | 247 (14.6) | 162 (13.8) | 85 (16.4) | 0.168 | |
| Prior CABG | - | 147 (8.6) | 110 (9.3) | 37 (7.1) | 0.130 | |
| Other prior cardiac surgery | - | 133 (7.8) | 100 (8.5) | 33 (6.3) | 0.127 | |
| Dialysis | - | 22 (1.3) | 17 (1.4) | 5 (0.9) | 0.416 | |
| eGFR <30 ml /min/1.73 m² | 0.2 | 203 (11.9) | 133 (11.3) | 70 (13.5) | 0.210 | |
| eGFR, ml/min/1.73 m² | 0.2 | 53.72±23.58 | 54.03±23.68 | 53.07±23.36 | 0.441 | |
| Severe pulmonary hypertension | 1.0 | 138 (9.9) | 101 (10.0) | 37 (9.4) | 0.663 | |
| Previous pacemaker | - | 159 (9.4) | 111 (9.4) | 48 (9.2) | 0.898 | |
| RBBB | 32.4 | 131 (11.4) | 90 (9.5) | 41 (8.0) | 0.344 | |
| First degree AV block | 32.4 | 161 (11.1) | 111 (11.8) | 50 (9.8) | 0.258 | |
| LBBB | 32.4 | 115 (10.0) | 72 (7.7) | 43 (8.5) | 0.585 | |
| Peak gradient, mmHg | 7.7 | 72.97±23.04 | 73.67±23.33 | 71.34±22.29 | 0.068 | |
| Mean gradient, mmHg | 2.3 | 48.66±17.74 | 49.10±17.77 | 47.64±17.64 | 0.127 | |
| AVA, cm² | 14.3 | 0.69±0.20 | 0.69±0.20 | 0.68±0.19 | 0.444 | |
| LVEF, % | 0.6 | 57.20±10.87 | 57.35±11.05 | 56.85±10.45 | 0.376 | |
| Moderate or severe AR | 8.2 | 321 (20.6) | 224 (20.0) | 97 (22.3) | 0.308 | |
| Moderate or severe MR | 2.9 | 439 (26.7) | 300 (25.8) | 139 (28.8) | 0.227 | |
| Aortic annulus area, mm² | 21.5 | 433±67 | 433±66 | 432±68 | 0.914 | |
| Aortic valve calcification | None | 26.6 | 48 (3.8) | 26 (2.9) | 22 (6.5) | 0.02 |
| Mild | 26.6 | 179 (14.4) | 128 (14.0) | 51 (15.0) | ||
| Moderate | 26.6 | 589 (47.5) | 428 (47.3) | 161 (48.5) | ||
| Heavy | 26.6 | 917 (34.2) | 321 (35.5) | 104 (30.8) | ||
| LVOT calcification | None | 28 | 875 (71.8) | 619 (68.8) | 256 (80.5) | 0.01 |
| Mild | 28 | 198 (11.7) | 164 (13.9) | 34 (6.5) | ||
| Moderate | 28 | 79 (4.6) | 67 (5.7) | 12 (2.3) | ||
| Severe | 28 | 65 (3.8) | 49 (4.1) | 16 (3.0) | ||
| Values are n (%) or mean±standard deviation. AR: aortic regurgitation; AV: atrioventricular; AVA: aortic valve area; CABG: coronary artery bypass graft; CAD: coronary artery disease; COPD: chronic obstructive pulmonary disease; eGFR: estimated GFR; GFR: glomerular filtration rate; LBBB: left bundle branch block; LVEF: left ventricular ejection fraction; LVOT: left ventricular outflow tract; MI: myocardial infarction; MR: mitral regurgitation; NYHA: New York Heart Association; PCI: percutaneous coronary intervention; PS: propensity score; RBBB: right bundle branch block; STS: Society of Thoracic Surgeons | ||||||
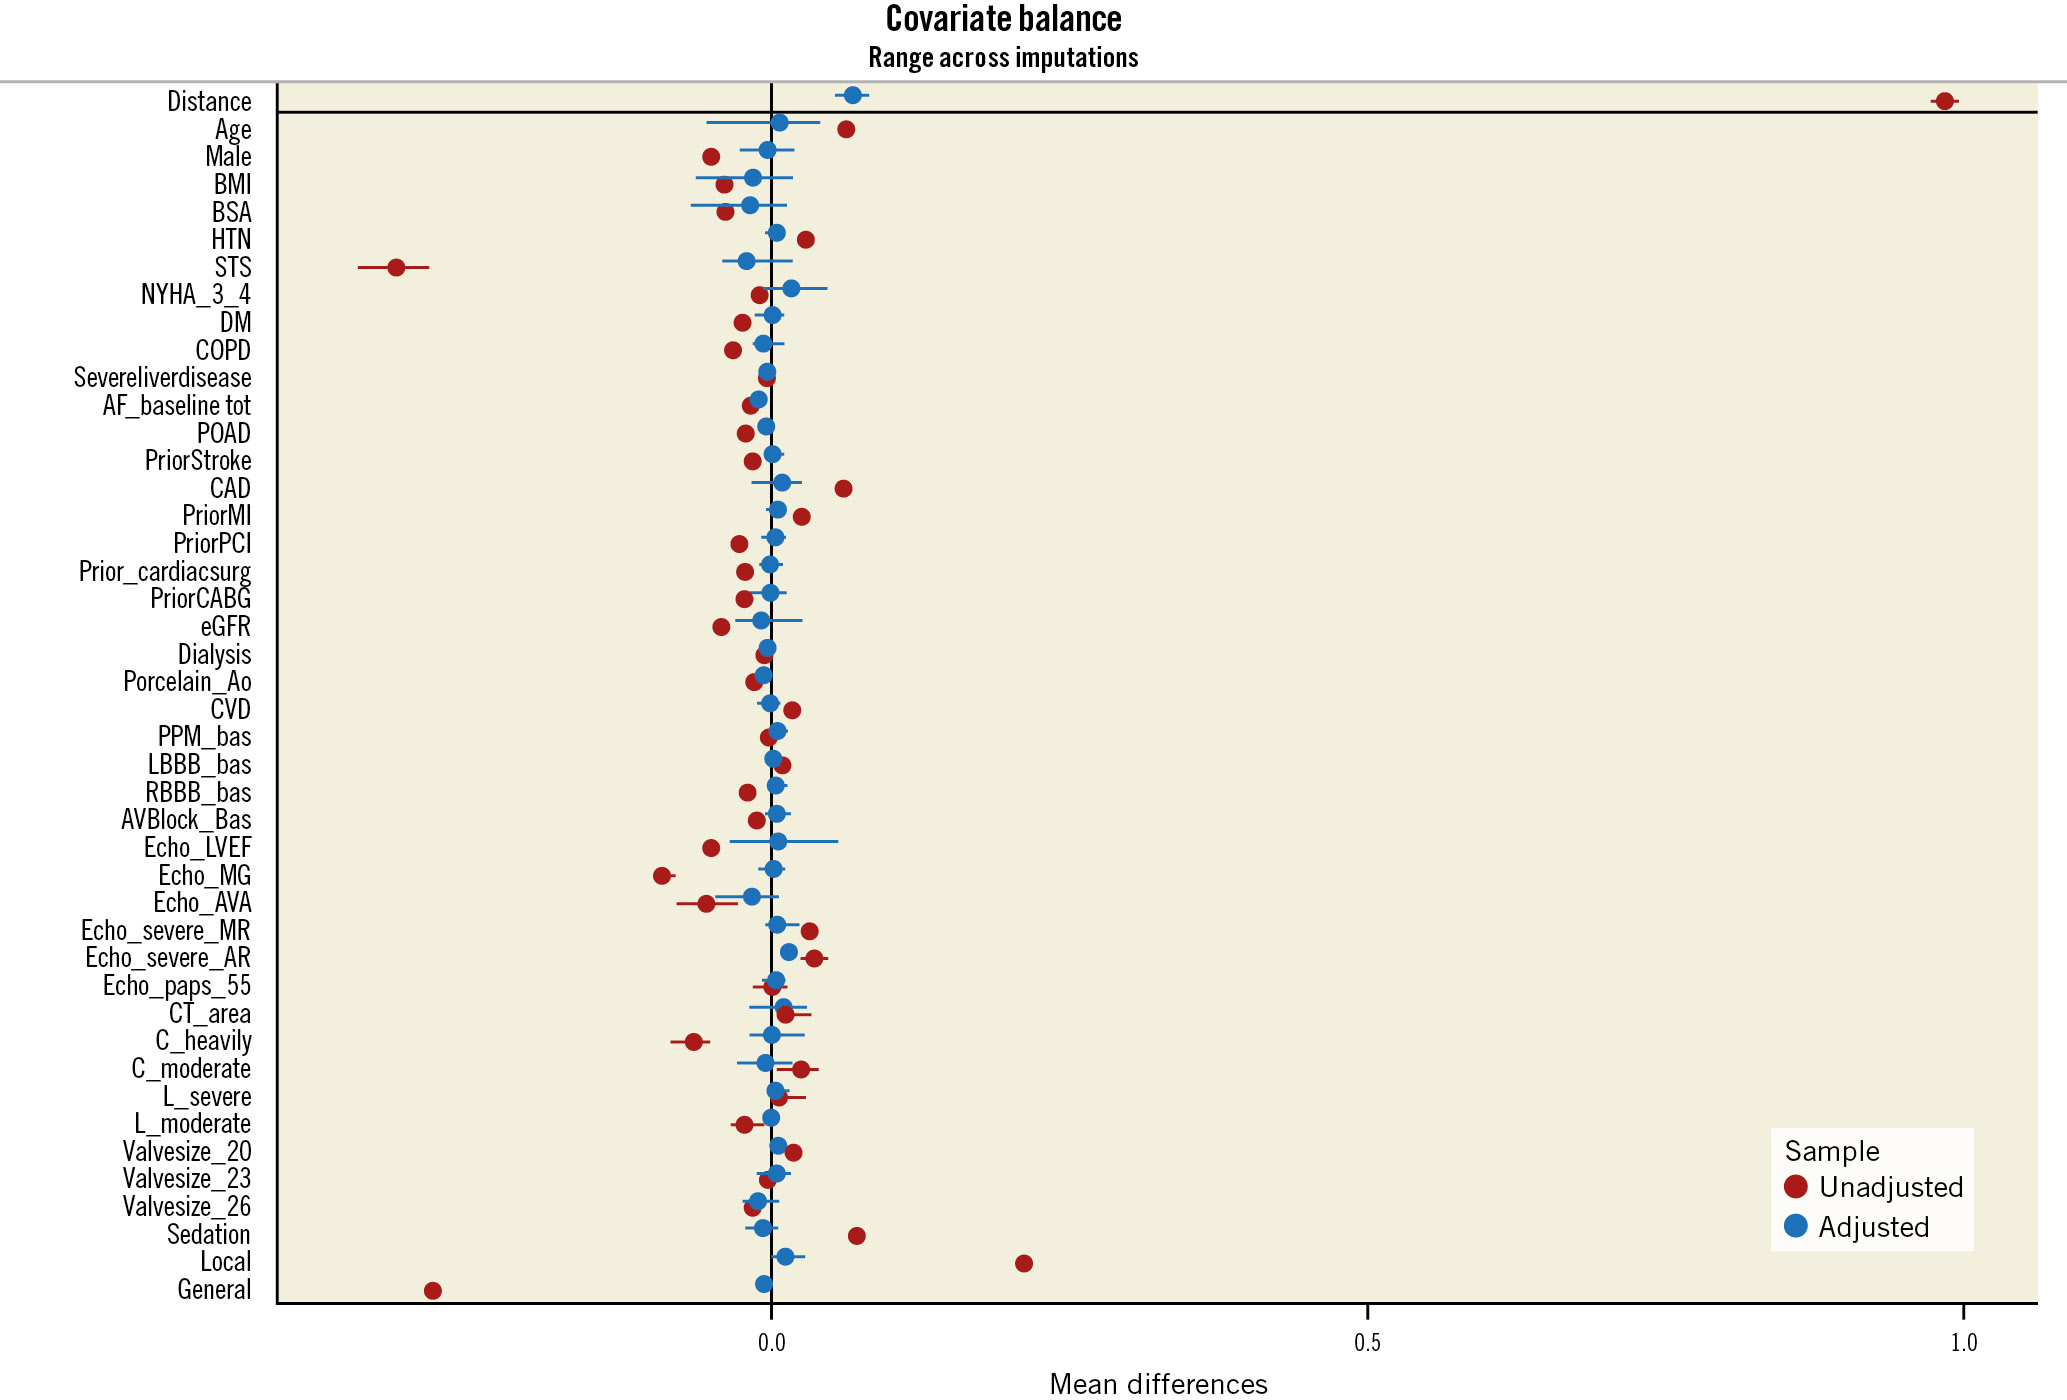
Figure 2. Covariate balance plot. Baseline differences before propensity score matching (red circles) were adequately balanced after matching (blue circles).
Procedural characteristics, in-hospital and 30-day outcomes
Procedural characteristics and in-hospital outcomes of the unadjusted and PS-matched populations are listed in Table 2. In the propensity-matched population, both predilatation and post-dilatation were less frequently performed with S3U compared to S3 (odds ratio [OR] 0.56, 95% confidence interval [CI]: 0.41 to 0.78; p<0.01; OR 0.23, 95% CI: 0.10 to 0.52; p<0.01). There were no significant differences between the two groups in the use of general anaesthesia (p=0.555). In-hospital mortality during the index admission was comparable in both groups (OR 0.74; 95% CI: 0.22 to 2.46; p=0.619).
There were no differences with respect to major vascular complications (OR 0.72, 95% CI: 0.28 to 1.86; p=0.497), life-threatening bleeding (OR 0.43, 95% CI: 0.14 to 1.32; p=0.140), cardiac tamponade (OR 0.77, 95% CI: 0.17 to 3.49; p=0.728) or conversion to open heart surgery (OR 1.68, 95% CI: 0.16 to 18.20; p=0.662) between the 2 groups. The rates of both annulus rupture and acute coronary obstruction were extremely low in the entire cohort (only 2 and 3 cases, respectively).
The rate of device success was similar between the two groups (90.6% S3U vs 92.2% S3; p=0.340).
The S3 group were hospitalised for significantly more days in the unadjusted analysis (S3U 4.51±4.50 vs S3 5.52±5.50; p<0.01), but this difference was not apparent in the adjusted analysis (mean difference −0.41, 95% CI: −1.38 to 0.50; p=0.368). There was also no significant difference in the rate of new PPI between patients in the S3U and S3 groups (OR 0.83, 95% CI: 0.49 to 1.41; p=0.360).
At 30 days, no significant differences were observed between patients treated with the S3U and S3 for all-cause mortality, disabling stroke, repeat hospitalisation for HF or rate of new PPI (Table 3).
Table 2. Procedural and in-hospital outcomes of unadjusted and propensity-matched cohorts.
| SAPIEN 3 (n=1173) |
SAPIEN 3 Ultra (n=519) |
Unadjusted | Propensity-matched | ||||
|---|---|---|---|---|---|---|---|
| OR (95% CI) | p-value | OR (95% CI) | p-value | ||||
| Conscious sedation | 377 (32.1) | 204 (39.3) | 1.36 (1.20-1.69) | 0.04 | 0.97 (0.75-1.26) | 0.840 | |
| General anaesthesia | 414 (35.3) | 36 (6.9) | 0.14 (0.09-0.19) | <0.01 | 0.92 (0.70-1.20) | 0.555 | |
| Local | 382 (32.6) | 279 (53.8) | 2.40 (1.94-2.97) | <0.01 | 1.05 (0.81-1.35) | 0.708 | |
| Predilatation | 267 (22.7) | 76 (14.6) | 0.58 (0.43-0.76) | <0.01 | 0.56 (0.41-0.78) | <0.01 | |
| Post-dilatation | 99 (8.4) | 8 (1.5) | 0.17 (0.07-0.33) | <0.01 | 0.23 (0.10-0.52) | <0.01 | |
| In-hospital death | 18 (1.5) | 5 (0.9) | 0.62 (0.20-1.57) | 0.354 | 0.74 (0.22-2.46) | 0.619 | |
| Cardiac tamponade | 8 (0.7) | 4 (0.8) | 1.13 (0.30-3.60) | 0.841 | 0.77 (0.17-3.49) | 0.728 | |
| Conversion to open heart surgery | 5 (0.4) | 3 (0.6) | 1.35 (0.27-5.55) | 0.676 | 1.68 (0.16-18.20) | 0.661 | |
| Sepsis | 14 (1.2) | 10 (1.9) | 1.62 (0.69-3.65) | 0.244 | 0.99 (0.33-2.93) | 0.988 | |
| Second THV implanted | 6 (0.5) | 1 (0.2) | 0.375 (0.02-2.20) | 0.365 | 0.55 (0.02-10.45) | 0.685 | |
| Vascular complications | Major | 29 (2.5) | 12 (2.3) | 0.93 (0.45-1.80) | 0.843 | 0.86 (0.38-1.98) | 0.734 |
| Bleeding | Life threatening | 21 (1.8) | 5 (1.0) | 0.53 (0.17-1.31) | 0.209 | 0.41 (0.16-1.38) | 0.169 |
| Major | 45 (3.8) | 9 (1.7) | 0.44 (0.20-0.87) | 0.03 | 0.48 (0.21-1.12) | 0.09 | |
| New pacemaker | 101 (8.6) | 36 (6.9) | 0.79 (0.53-1.17) | 0.268 | 0.83 (0.49-1.41) | 0.497 | |
| New onset of AF | 66 (5.6) | 18 (3.4) | 0.60 (0.34-1.00) | 0.06 | 0.67 (0.31-1.45) | 0.301 | |
| New LBBB | 67 (5.7) | 25 (4.8) | 0.83 (0.51-1.32) | 0.455 | 0.62 (0.36-1.08) | 0.09 | |
| Device success | 1,082 (92.2) | 471 (90.8) | 0.82 (0.58-1.19) | 0.340 | 0.99 (0.64-1.51) | 0.952 | |
| LOS (days) | 5.51±5.50 | 4.51±4.50 | −0.96 (−1.52 to −0.39) | <0.01 | −0.41 (−1.38 to 0.50) | 0.360 | |
| Peak gradient, mmHg | 21.43 ±8.09 | 23.17±8.7 | 1.71 (0.83-2.61) | <0.01 | 1.71 (0.82-2.61) | <0.01 | |
| Mean gradient, mmHg | 11.21±4.45 | 12.55±4.9 | 1.35 (0.86-1.84) | <0.01 | 1.31 (0.83-1.80) | <0.01 | |
| AVA, cm² | 1.68±0.45 | 1.55±0.34 | 0.04 (−0.06 to 0.13) | 0.472 | −0.07 (−0.13 to 0.02) | 0.111 | |
| Non-trace PVL | 802 (69.8) | 412 (81.7) | 1.94 (1.50-2.52) | <0.01 | 1.77 (1.27-2.45) | <0.01 | |
| Mild PVL | 312 (27.1) | 88 (17.4) | 0.56 (0.43-0.73) | <0.01 | 0.62 (0.44-0.86) | <0.01 | |
| Moderate PVL or greater | 36 (3.1) | 4 (0.8) | 0.25 (0.07-0.62) | 0.008 | 0.34 (0.09-1.25) | 0.110 | |
| LVEF, % | 57.89±10.75 | 57.66±9.43 | −0.21 (−1.33 to 0.90) | 0.703 | -0.31 (-1.72 to 1.09) | 0.609 | |
| Values are n (%) or mean±standard deviation. AF: atrial fibrillation; AVA: aortic valve area; CI: confidence interval; LBBB: left bundle branch block; LOS: length of stay; LVEF: left ventricular ejection fraction; OR: odds ratio; PVL: paravalvular leak; THV: transcatheter heart valve | |||||||
Table 3. Clinical outcomes of unadjusted and propensity-matched populations at 30 days.
| Unadjusted | Propensity-matched | |||||
|---|---|---|---|---|---|---|
| SAPIEN 3 | SAPIEN 3 Ultra | HR (95% CI) | p-value | HR (95% CI) | p-value | |
| All-cause death | 19 (1.6) | 7 (1.4) | 0.93 (0.61-1.41) | 0.743 | 1.0 (0.38-2.67) | 0.928 |
| Disabling stroke | 1 (0.1) | 3 (1.0) | 0.63 (0.17-2.30) | 0.481 | 0.89 (0.14-1.75) | 0.901 |
| Hospitalisation for HF | 9 (0.8) | 3 (0.6) | 0.77 (0.24-2.39) | 0.652 | 0.63 (0.18-2.25) | 0.473 |
| New pacemaker implantation | 125 (10.7) | 37 (7.8) | 0.70 (0.50-1.01) | 0.06 | 0.79 (0.54-1.26) | 0.377 |
| Repeat procedure | - | - | - | - | - | - |
| Values are n (%). Data are reported as Kaplan-Meier estimates at the specific timepoint. CI: confidence interval; HF: heart failure; HR: hazard ratio | ||||||
Clinical outcomes at 1 year
Clinical outcomes at 1 year are shown for the unadjusted and propensity-matched populations in Table 4.
At 1 year, the rate of death from any cause was 4.9% in the S3U compared with 6.3% in the S3 group (hazard ratio [HR] 0.99, 95% CI: 0.61 to 1.41; p=0.745) (Central illustration). Similarly, there was no significant difference in the rate of the composite endpoint of death from any cause, stroke, or rehospitalisation at 1 year after the procedure (Central illustration). The unadjusted rate of new PPI was higher with the S3 compared to the S3U (HR 0.70, 95% CI: 0.50 to 0.99; p=0.045). The propensity-matched analysis confirmed that there were no significant differences in the rates of any death (HR 0.89, 95% CI: 0.53 to 1.53; p=0.691), cardiac death (HR 0.58, 95% CI: 0.24 to 1.38; p=0.218), disabling stroke (HR 0.55, 95% CI: 0.16 to 1.82; p=0.323) or heart failure hospitalisation (HR 0.71, 95% CI: 0.32 to 1.55; p=0.391). Moreover, the rate of new PPI at 1 year was similar in both groups (HR 0.75, 95% CI: 0.50 to 1.13; p=0.168).
Table 4. Clinical outcomes of unadjusted and propensity-matched populations at 1 year.
| Unadjusted | Propensity-matched | |||||
|---|---|---|---|---|---|---|
| SAPIEN 3 | SAPIEN 3 Ultra | HR (95% CI) | p-value | HR (95% CI) | p-value | |
| All-cause death | 69 (6.3) | 22 (4.9) | 0.93 (0.61-1.41) | 0.743 | 0.89 (0.53-1.53) | 0.691 |
| Composite endpoint* | 104 (9.5) | 30 (6.6) | 0.77 (0.54-1.18) | 0.162 | 0.73 (0.46-1.17) | 0.197 |
| Cardiac death | 39 (3.5) | 7 (1.4) | 0.57 (0.29-1.17) | 0.102 | 0.58 (0.24-1.38) | 0.218 |
| Disabling stroke | 20 (2.0) | 3 (1.0) | 0.45 (0.17-1.18) | 0.107 | 0.55 (0.16-1.82) | 0.323 |
| Hospitalisation for HF | 32 (3.0) | 10 (2.2) | 0.80 (0.42-1.55) | 0.520 | 0.71 (0.32-1.55) | 0.391 |
| New pacemaker implantation | 139 (12.1) | 43 (8.5) | 0.70 (0.50-0.99) | 0.045 | 0.75 (0.50-1.13) | 0.168 |
| Repeat procedure | - | - | - | - | - | - |
| Values are n (%). Data are reported as Kaplan-Meier estimates at the specific timepoint. *Any death, disabling stroke, or repeat hospitalisation for heart failure. CI: confidence interval; HF: heart failure; HR: hazard ratio | ||||||
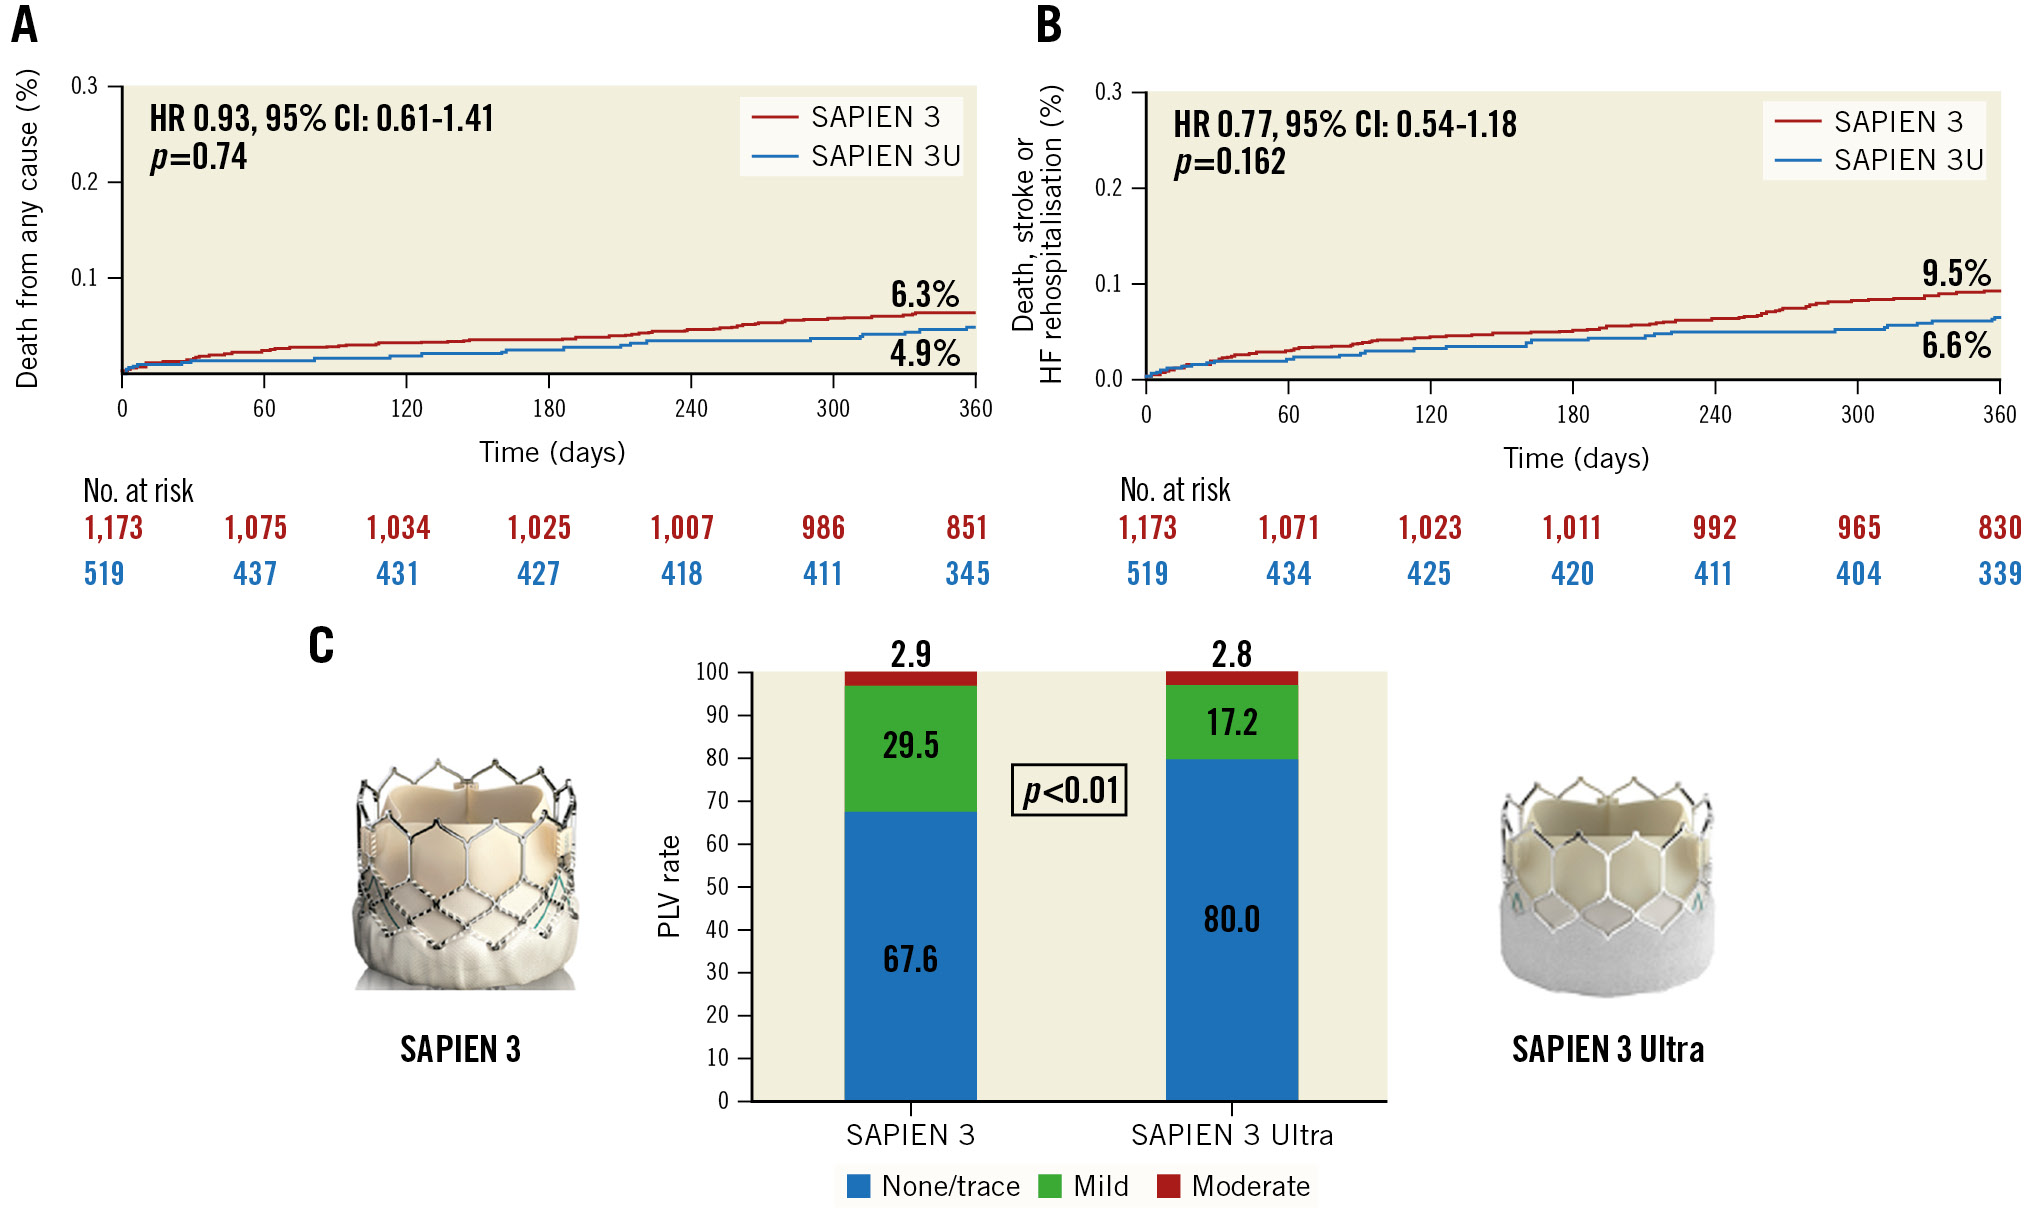
Central illustration. 1-year clinical and echocardiographic outcomes of TAVI with the SAPIEN 3 Ultra or the SAPIEN 3. Kaplan-Meier curves of (A) all-cause mortality and (B) death from any cause, disabling stroke and repeat hospitalisation for heart failure. (C) Rate of paravalvular leak (PVL) at 1 year according to THV design. CI: confidence interval; HF: heart failure; HR: hazard ratio
Echocardiographic outcomes
Early echocardiographic data after TAVI (before discharge) of the unadjusted and propensity-matched cohorts are shown in Table 2. In the unadjusted population, the S3U more frequently achieved none/trivial PVL compared to its predecessor (OR 1.94, 95% CI: 1.50 to 2.52; p<0.01), whereas the rate of mild PVL was higher in the S3 group (OR 0.53, 95% CI: 0.43 to 0.73; p<0.01). The S3U was associated with a lower incidence of moderate or greater PVL compared with the S3 (0.8% for S3U vs 3.1% for S3; p<0.01). Moreover, the S3U yielded a slightly higher mean post-procedural aortic valve gradient than the S3 (12.5 mmHg vs 11.2 mmHg, respectively; p<0.01). However, the rate of device success did not differ between the two groups (S3U 90.8% vs S3 92.5%; p=0.340).
In the propensity-matched analysis, the S3U confirmed a lower incidence of PVL compared to the S3, but there was no difference in the rate of moderate or greater PVL (OR 0.34, 95% CI: 0.09 to 1.25; p=0.110). Post-procedural transprosthetic gradients were slightly higher in the S3U group (mean difference 1.31, 95% CI: 0.83 to 1.80; p<0.01; S3 group: mean difference 1.71; 95% CI: 0.82 to 2.61; p<0.01), but there was no difference in the rate of device success (OR 0.99; 95% CI: 0.64 to 1.51; p=0.952).
At 1 year, in both the unadjusted and the propensity-matched population (Supplementary Table 1), absence of PVL was significantly more frequent with the S3U compared with the S3 (OR 1.71, 95% CI: 1.28 to 2.28; p<0.01), whereas there was no significant difference in the rate of moderate or greater PVL (OR 0.88, 95% CI: 0.42 to 1.85; p=0.738). Mild PVL was more frequent in the S3 group (OR 0.63, 95% CI: 0.44 to 0.88; p<0.01). No patients experienced severe PVL. Transprosthetic gradients were similar in the two groups (mean difference −0.64, 95% CI: −2.19 to 0.90; p=0.389) (Supplementary Figure 1, Supplementary Figure 2).
Discussion
The present study investigated the 1-year clinical and echocardiographic outcomes of TAVI with the SAPIEN 3 Ultra, compared with its predecessor the SAPIEN 3, in an unselected, real-world population from an international multicentre registry. We assessed the effect of THV design on clinical outcomes after taking into account the potential confounding factors by using a prespecified propensity score method, which was performed with a non-parsimonious approach including baseline characteristics, anatomical features (calcium burden and distribution), THV size and anaesthesia type.
The major findings of our study are as follows: 1) the S3U was associated with significantly lower rates of mild PVL compared with the S3, and this result was maintained at 1-year follow-up; 2) the rate of moderate or greater PVL was overall low and comparable in both groups at 1 year; 3) the S3U was comparable to the S3 with respect to 1-year rates of death from any cause, cardiac death, disabling stroke, PPI and repeat hospitalisation due to heart failure.
It is recognised that moderate to severe PVL is associated with increased mortality and poor prognosis6. However, it remains controversial whether mild PVL affects clinical outcomes89.
Recently, as the TAVI procedure expands to treat a younger and lower-risk population, technological advancements of new-generation THV have been focused on minimising PVL, even mild PVL, with the aim of approaching those rates achieved with surgical prostheses45. Our study results show a very low rate of PVL associated with the S3U suggesting that the main distinguishing features of the new-generation S3U have a significant preventive role. The absence of PVL was significantly higher in the S3U compared to the S3 group at discharge (69.8% S3 vs 81.7% S3U) and, more importantly, the results were confirmed at 1-year follow-up (67.1% S3 vs 80% S3U). The rate of mild PVL was significantly lower in the S3U group at both discharge (27.1% S3 vs 17.4% S3U) and 1-year follow-up (29.5% S3 vs 17.2% S3U). In both groups, the rate of moderate or greater PVL was overall low and similar (Supplementary Figure 1). Recently, in a single-centre comparison of the S3U and S3 in 155 propensity-matched pairs of patients, Rheude et al15 reported similar results in terms of a none/trivial PVL rate (77.3% S3U vs 50% S3) at 1 year. In comparison to previous registries using the SAPIEN, SAPIEN XT (also Edwards Lifesciences) and SAPIEN 3202122, our S3 Ultra registry results demonstrate that the rate of PVL at 1 year has progressively reduced in recent years (Figure 3). The innovative features of the latest-generation S3U balloon-expandable valve represent a further significant technological advance in minimising PVL. However, in our study, a reduction of the PVL rate did not affect survival at 1 year. Future studies with longer follow-up beyond 5 years are warranted to evaluate the impact of reduced PVL on clinical outcomes.
In contrast, the presence of the textured polyethylene terephthalate and the higher external skirt had no negative impact on device success, PPI or adverse events at 30-day and 1-year follow-up, all of which had similar rates to those obtained with the S3. The rate of any death at 1 year in our propensity-matched cohort was similar in the S3U and S3 groups. Our results are in line with those reported by Rheude et al15 (S3U 6% vs S3 8.6%). Similarly, no differences in the primary composite endpoint, cardiac death or repeat procedure were detected between the two groups at 1 year. Moreover, we did not observe a significant difference in the rate of new PPI between the two prostheses; this result is in agreement with that reported by Rheude et al15. However, the PPI rate at 1 year in the S3U group was lower than that observed in our study (6.5% vs 8.5%). The reasons for this discrepancy are uncertain but might be explained by the small cohort size of their single-centre study, or it might have occurred by chance.
In comparison to previous registries and trials422, the SAPIEN 3 Ultra registry results show a lower rate of 1-year all-cause mortality and a lower rate of composite endpoint of any death, disabling stroke and HF hospitalisation (Central illustration). This is certainly a result of multiple factors, including device improvement, lower-risk patients and the learning curve of physicians in terms of patient selection, valve sizing and implantation techniques.
Of note, in terms of in-hospital outcomes, both predilatation and post-dilatation were less frequently performed with the S3U compared with the S3. These results coupled with a very low rate of major complications are in line with the observations made in previous studies13 and confirm that TAVI with an S3U can be safely and effectively performed without predilatation and with a lower need for post-dilatation. Finally, the overall rates of all-cause mortality (2.8%) and disabling stroke (2.1%) at 30 days were very low in our study, consistent with previous studies evaluating S3U and S3 devices1314.
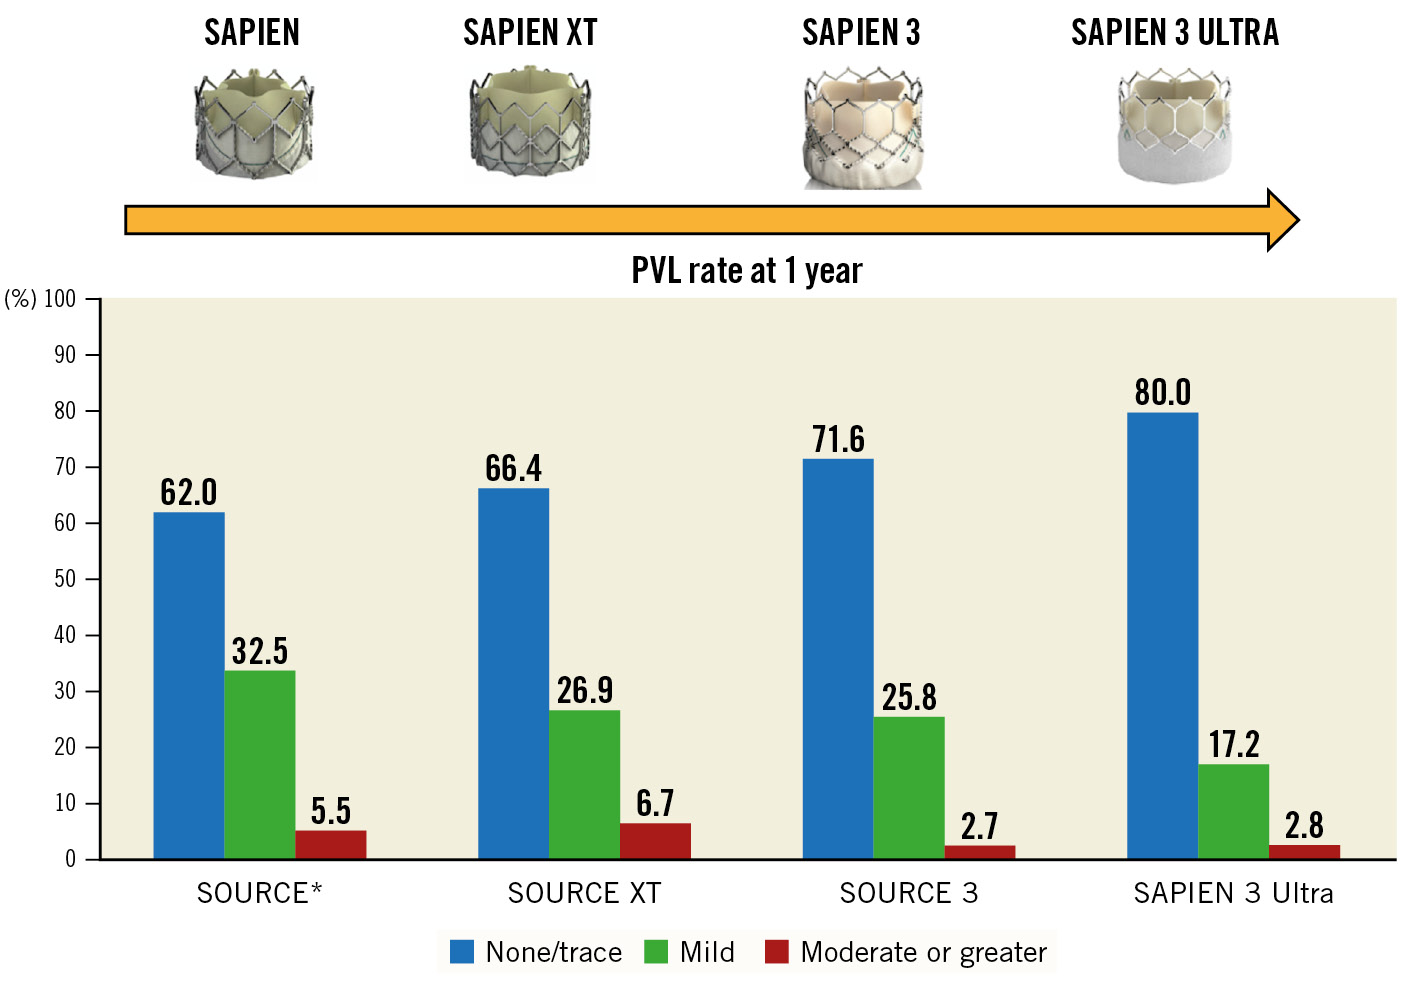
Figure 3. Paravalvular leak (PVL) incidence at 1 year. PVL rate in the SAPIEN 3 Ultra (S3U) registry in comparison with the main registries of the SAPIEN transcatheter heart valve family: SOURCE (SAPIEN), SOURCE XT (SAPIEN XT), SOURCE 3 (SAPIEN 3). *For the SOURCE registry, the PVL rate was evaluated at discharge.
Limitations
This study has the inherent limitations of non-randomised, observational, retrospective studies without independent adjudication of clinical events or an independent core laboratory to assess the PVL severity. We applied a propensity-matched approach to overcome differences in baseline characteristics and potential confounders; however, residual confounding remains a source of bias that cannot be excluded. Moreover, our data are derived from European centres only and may not be representative of other settings. Finally, the use of two different delivery systems with the S3U may affect the generalisability of our results.
Conclusions
This large multicentre experience of real-world patients treated by transfemoral TAVI with the new S3U THV shows excellent haemodynamic performance and clinical outcomes at 1 year. Further validation of our findings and longer-term follow-up are necessary to demonstrate the potential impact of reduced PVL rates on clinical outcomes.
Impact on daily practice
Limited data exist on 1-year outcomes after TAVI with the latest balloon-expandable SAPIEN 3 Ultra THV. In this real-world, multicentre European study we found that the SAPIEN 3 Ultra was associated with a lower rate of PVL compared to its predecessor (S3), a result that was maintained at 1 year. However, no difference in clinical outcomes was observed. Future randomised trials and larger observational studies are needed to further explore the benefit of reduced PVL on long-term outcomes after TAVI with the SAPIEN 3 Ultra.
Guest editor
This paper was guest edited by Franz-Josef Neumann, MD; Department of Cardiology and Angiology II, University Heart Center Freiburg - Bad Krozingen, Bad Krozingen, Germany.
Conflict of interest statement
N. Van Mieghem has received research grants from Abbott Vascular, Biotronik, Boston Scientific, Medtronic, Edwards Lifesciences, PulseCath BV, Abiomed, Daiichi Sankyo, FEops, and Pie Medical; and is a physician proctor for Edwards Lifesciences and Medtronic. M. Barbanti is a consultant for Boston Scientific, Edwards Lifesciences, and Medtronic. L. Nombela-Franco has been a proctor for Abbott Vascular and Edwards Lifesciences. T. Piva is a consultant for Boston Scientific, Edwards Lifesciences, Innova SRL, and Teleflex Medica. C. Tamburino is a consultant for Medtronic. The Guest Editor reports lecture fees paid to his institution from Amgen, Bayer Healthcare, Biotronik, Boehringer Ingelheim, Boston Scientific, Daiichi Sankyo, Edwards Lifesciences, Ferrer, Pfizer, and Novartis; consultancy fees paid to his institution from Boehringer Ingelheim; and grant support from Bayer Healthcare, Boston Scientific, Biotronik, Edwards Lifesciences, GlaxoSmithKline, Medtronic, and Pfizer. The other authors have no conflicts of interest to declare.
Supplementary data
To read the full content of this article, please download the PDF.