Introduction
Stent expansion, apposition and symmetry were the three criteria of intravascular ultrasound (IVUS) guided optimal stent deployment in the bare metal stent era1, with at least the criterion of stent expansion maintaining its clinical relevance in the drug-eluting stent (DES) era2. Two prospective studies showed that stent malapposition immediately following DES implantation was not associated with increased adverse clinical events3,4. Thus, initial concerns that immediate stent malapposition would affect drug delivery to the vessel wall and lead to DES failure appeared to be unfounded. Coronary IVUS, however, formerly the gold standard for assessing stent strut apposition, is imprecise in the detection of stent malapposition observed in around 7% of lesions3,4, a figure which is probably grossly underestimated. This is due to the limited axial and lateral resolution of the ultrasound waves (100-150 µm) and the constant presence of artefacts around stent struts (side-lobes, shadowing). Optical coherence tomography (OCT) uses infrared light with the advantage of greater resolution (10-15 µm) and less strut induced artefacts compared with IVUS5,6. Unlike the first OCT prototypes used by Jang et al5,6, new commercial systems (LightLab Imaging Inc., Westford, MA, USA) can acquire contiguous images with a motorised pullback system as used with IVUS7. Still, OCT has some disadvantages including a more complex process of image acquisition that requires transient proximal flow occlusion with a balloon. Since there is definite learning curve to achieve optimal image quality, this article will focus on methods and techniques to attain optimal assessment of stent strut apposition, using the current OCT system.
Proximal balloon occlusion and blood removal
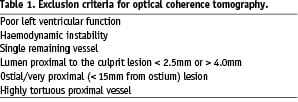
The new OCT system consists of the Helios™ proximal occlusion balloon catheter and ImageWire™. Because of the length and maximal diameter of the currently available occlusion balloon, the luminal diameter proximal to the culprit lesion must be between 2.5 mm and 4.0 mm, and ostial or very proximal lesions (< 15 mm from ostium) are not suitable for imaging. Other contraindications are listed in Table 1.
The Helios™ proximal occlusion balloon catheter is an over-the-wire 4.4 Fr catheter (inner diameter 0.025”), compatible with 6Fr guiding catheters (inner lumen diameter > 0.071”), which is advanced distal to the stented lesion using a conventional angioplasty guidewire (0.014’’). The guide wire is then replaced by the OCT ImageWire™ (0.019’’ maximum diameter), and the occlusion balloon catheter is withdrawn proximal to the segment to be assessed leaving the imaging wire in position (Figure 1).
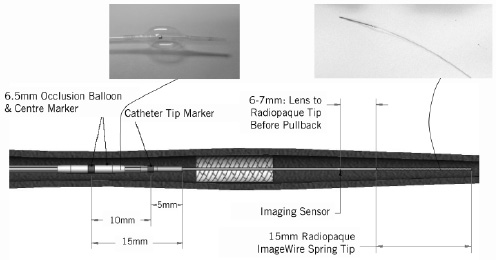
Figure 1. Helios™ proximal occlusion balloon catheter and ImageWire™. Intra-coronary flush is continuously performed via the end-hole of the (over-the-wire) occlusion balloon catheter and the occlusion balloon dilated proximal to the target segment during observation.
During imaging acquisition, coronary blood flow must be removed and we adopted a continuous flush of Ringer’s lactate solution via the end-hole of the occlusion balloon catheter at a flow rate of 0.5-1.5 ml/sec. Two Y-connectors are needed and attached to both a guiding and an occlusion balloon catheter respectively as shown in Figure 2.

Figure 2. Proximal end of guiding catheter and proximal occlusion balloon catheter showing the connections for the indeflator, power injector and guidewire.
We use a power injector (Mark V ProVis, Medrad, Inc., Indianola, PA, USA) for this slow injection with a setting of rise/fall: 0 sec, pressure limit: 100 psi, delay: 0 sec under inflation of the highly compliant occlusion balloon proximal to the lesion (0.5-0.7 Atm). The vessel occlusion time is limited to a maximum of 30 sec to avoid haemodynamic instability or arrhythmias. The stented segments are imaged using an automated pull-back (1.0 mm/sec) from distal to proximal. The cross sectional images are acquired at 15.4 frames/sec. In case the segment of interest is not completely studied because its length is > 30 mm or the continuous pull-back has to be interrupted due to patient instability, chest pain or arrhythmias, a second pull-back is performed again to accomplish complete lesion assessment.
How to optimise image quality
With increasing experience, we are generally able to acquire optimal images in around 90% of each lesion or stented segment studied. The main cause of failure remains inadequate blood removal. We believe optimal positioning of the balloon and selection of the infusion rate can overcome this problem in most cases. In the last 20 cases studied, images inadequate for assessment were taken in 1/20 (5%) and the cause of failure was inability to cross a very calcified and tortuous vessel with a stiff and bulky delivery balloon. There are however, some limitations that may preclude complete lesion and stent assessment and these will be discussed in detail below. In brief, the major limitations have to do with incomplete lesion assessment during placement of the imaging wire, inadequate blood removal and finally the limited scan range (5 mm) of the current OCT system. It has also been challenging to remove coronary blood flow completely in lesions involving large side branches and immediately following recanalisation of chronic total occlusions due to the flow from collaterals. The two crucial points therefore required to obtain optimal cross sectional images using the current OCT system are correct placement of the imaging optic sensor and optimisation of blood removal using the proximal occlusion balloon with continuous intra-coronary flush. We provide some tips and tricks that may be useful.
Imaging wire placement
Since the imaging wire is not torquable, we advance the over-the-wire occlusion balloon distal to the lesion to be assessed / stented segment to obtain a distal wire placement. Unlike the IVUS transducer, the optical sensor is invisible under fluoroscopy (Figure 3C) and therefore one must estimate the correct position, using the distal 15 mm radiopaque tip (Figure 3D) of the imaging wire and the two markers of the balloon catheter (Figure 3A, 3B).
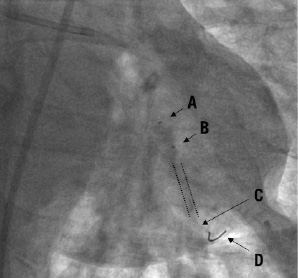
Figure 3. ImageWireTM placement. The infrared sensor (C), located 6-7 mm proximal to the distal 15 mm radiopaque wire tip (D) when fully advanced is invisible under fluoroscopy. It is correctly positioned distal to the stent (indicated by dotted lines). The occlusion balloon catheter tip marker (B; 5 mm proximal to the distal end) is above the proximal end of the stented segment. (A) indicates the centre marker of the occlusion balloon (10 mm proximal to B).
When fully advanced, the sensor is located 6-7 mm proximal to the radiopaque part as easily confirmed by direct observation of the position of the red light emitted when the imaging wire is handled out of the body. As there are no direct radiopaque markers for the infrared sensor, and despite meticulous attention, it is still possible to miss imaging an area of interest resulting in incomplete distal lesion edge assessment. Imaging after stent implantation facilitates positioning because it is sufficient to advance the proximal end of the radiopaque wire tip at least 1 cm distal to the stent struts to image the entire stented segment. For imaging prior to treatment, it is important to note that the occlusion balloon is too bulky to cross severe stenoses before pre-dilatation and that the imaging wire should be advanced distal to the lesion to ensure that the segment of interest is fully visualised.
Proximal occlusion balloon
Although the company’s instruction manual advises the use of diluted contrast (30-50% mix) to inflate the occlusion balloon, we use 0.9% normal saline. Saline takes less time for the occlusion balloon to be both fully dilated (to occlude blood flow) and deflated (to restore flow), resulting in a shorter period of ischaemia. The disadvantage of this method is that the balloon is not identifiable under fluoroscopy, however complete occlusion of the target vessel can be confirmed with test injection of contrast through the guiding catheter.
Intra-coronary flush
We use Ringer’s lactate during infusion because we expect it to be less arrhythmogenic than other crystalloid solutions. In most cases, we use a pump with an injection rate of 0.7 or 1.2 ml/sec of intra-coronary flush with good clearance of blood (Figure 4A).


Figure 4. Optimal and various patterns of suboptimal blood removal. Optimal imaging clearly shows all struts with shadows cast (A), (B) indicates considerably deteriorated imaging with bright layers of blood lacking circumferential visualisation of vessel wall and (C) indicates minimally deteriorated imaging showing some blood speckles inside the lumen and circumferential vessel wall but without clear strut identification compared with (A). Double white rings (arrow) are shadows of the proximal balloon catheter tip. (D-F) indicate typical patterns of suboptimal blood removal immediately following recanalisation of chronically occluded segments. Blood removal was not easy during pull-back because of the collateral blood flow synchronised to cardiac motion rendering strut assessment difficult. In the image of (F) some struts can be evaluated, but contiguous assessment at every sec (mm) was almost impossible.
Some particularly large vessels, those receiving good collateral flow or those with large side branches require higher flushing rates, with the potential for endothelial damage. Fortunately, however, thus far we have not experienced any complications such as coronary dissection, target vessel failure or clinical adverse events at index procedure or at follow-up. For a large coronary the flow rates required are still in a physiological range (0.5–1.5 ml/sec) resulting in a physiological pressure rise. The Y-connector attached to the guiding catheter must be fastened securely enough to prevent leakage of the flushing solution but not too tight as to damage the optical fibre during pull-back.
Complementary flush
The proximal occlusion balloon can be dilated up to 4.0 mm in diameter, but if it fails to completely occlude the vessel being assessed, blood will escape. This will, depending on the severity, compromise image quality considerably (Figure 4B) or only partially (Figure 4C) where you may continue to visualise the vessel wall albeit in a suboptimal fashion. Even for partially insufficient imaging like figure 4C, inflating the occlusion balloon to 0.7 atm (max) and increasing flush volume do not always resolve the issue. Repositioning of the occlusion balloon or complementary manual injection through the guiding catheter are alternative solutions. Despite all efforts, chronically occluded segments following recanalisation are difficult to evaluate as collateral flow synchronised to cardiac motion complicates blood removal rendering strut assessment every sec (mm) almost impossible (Figure 4D-4F).
Usage of the fragile imaging wire
In multiple attempts for pre- and post-procedural assessment or multi-vessel observation, it is important to be meticulous in handling the imaging wire: leaving it straight on the table rather than keeping it back in the hoop helps to avoid damaging the fragile optical fibre. Furthermore, the imaging sensor should not be advanced when either the wire is being inserted or pulled out of the guiding catheter or when it is within the hoop.
Quantitative analysis with OCT: focus on strut apposition
OCT offers the possibility of a detailed analysis of the superficial plaque components, with resolution far superior to IVUS (Figure 5)8,9.

Figure 5. Qualitative analysis of superficial plaque components. A) Fibrous plaque: Homogeneous signal-rich plaque extending circumferentially (arrow: guidewire artefact). B) Fibroatheroma: Heterogeneous plaque includes signal poor regions (arrowhead) with diffuse border indicating lipid components. Cap thickness can also be measured. C) Calcified plaque: Image acquired following balloon dilatation of chronically occluded segments showing calcium characterised by well delineated signal poor regions extending from 3 to 7 o’clock positions (arrows)
However, the assessment remains largely qualitative with the notable exception of the measurement of the thickness of the fibrous cap covering necrotic areas. Unless spectroscopy is introduced in the analysis package, with major changes in the hardware required to allow dual light emission, OCT cannot quantitate the various plaque components as IVUS does using radiofrequency analysis10. The other limitation of OCT for plaque quantitation is the inability to provide a full thickness analysis of large plaques because of its limited penetration. OCT however, offers obvious advantages when dealing with superficial structures such as the fibrous plaques and stent struts. In the remaining part of this review we will focus on the methods we use to assess strut apposition.
Off-line analysis of contiguous cross sections within the stented segment is performed at 1 mm intervals. Firstly, the distal end should be detected with images of circumferential struts. From the identified distal end of the stent, every 15 frames (almost equivalent to 1 mm with an acquisition rate of 15.4 frames/sec) cross sections are checked and the best images with clearly identifiable vessel wall and struts within 2 frames distal or proximal are selected for evaluation of strut apposition (‘Selected cross sections’). A proximal end with circumferential struts is also detected, and the interval from identified distal to proximal stent end is defined as the ‘scanned stent length (mm)’. ‘Percent (%) scanned stent length’ is calculated as scanned stent length divided by total stent length implanted for the lesion. Detected overlapping length should be added to the scanned length for this calculation when two or more stents have been implanted in an overlapping fashion. In each selected cross section ‘Complete cross sectional imaging’ is defined as entirely circumferential image acquisition of the luminal border (Figure 6).
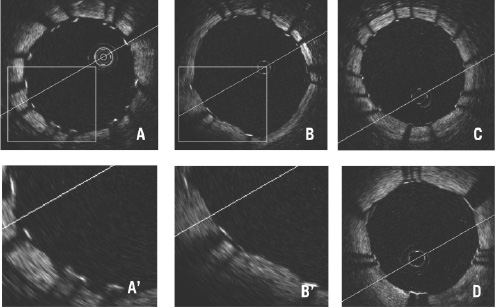
Figure 6. Complete cross sectional imaging of drug-eluting stents with apposed struts. (A) Cypher Select, (B) Taxus Liberte, (C) Endeavor, (D) CoStar. Cypher struts appear wider than the other 3, but all of their strut thicknesses are underestimated because of limited penetration of OCT.
‘Percent (%) complete cross sectional imaging’ is calculated as the rate of complete cross sectional imaging divided by the number of selected cross sections.
Stent struts appear as highly reflective surfaces and cast shadows on the vessel wall behind. When the strut is not fully attached to the vessel wall by visual estimate (almost equivalent to > 50 µm), the position of a stent strut relative to the vessel wall is measured by magnifying the individual stent strut to maximise accuracy. Firstly, one pointer is placed on the endo-luminal surface of the reflection, followed by another at the surface of the vessel wall within the stent strut shadow using the reflections of the wall on either side of the strut shadow. The measurement line should be as perpendicular to the strut and vessel wall as possible (Figure 7).
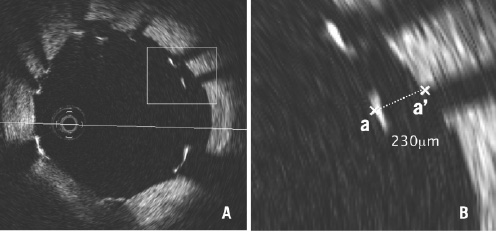
Figure 7. Measurement of strut apposition. The distance between the endo-luminal surface of the strut reflection and the vessel wall is measured prolonging and joining the contours of the wall on either side of the strut shadow with a measurement line as perpendicular as possible to the strut and vessel wall. The distance between (a) and (a’) is equal to 230 mm.
In case a strut protrudes into a side branch ostium, this should be classified as ‘malapposed’ and excluded from quantitative strut analysis.
Definition of strut apposition in DES
Since OCT can show only the endo-luminal surface of the strut due to limited penetration through the metal (Figure 8), strut and polymer thickness should be considered in assessing apposition for each type of DES design.
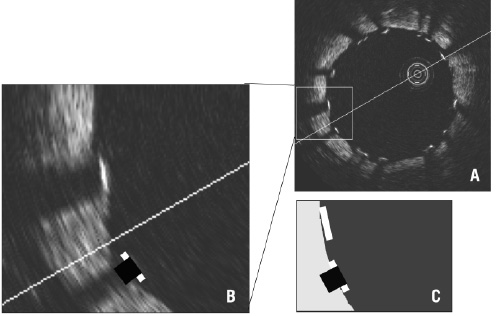
Figure 8. Visible and real strut thickness and width. A and B: OCT can show only the endo-luminal surface of the strut (bright white line) due to limited penetration through the metal; B and C: strut width is overestimated compared with the actual profile (black square) due to lateral resolution of 25-40 mm and there is a shadow behind struts where the vessel wall is not visible.
Apart from Yukon® DES stent (Translumina GmbH, Hechingen, Germany) with 115 µm (0.0045”) metal strut thickness, no polymer and an uneven rapamycin sprayed coating, four types of DES are clinically available in Europe presently: Cypher Select™ stent (Cordis, Johnson and Johnson Co., Miami Lake, FL, USA) with 140 µm strut and 7 µm polymer, Taxus® Liberte™ (Boston Scientific, Natick, MA, USA) with 97 µm and 15 µm, Endeavor™ (Medtronic AVE, Santa Rosa, CA, USA) with 91 µm and 8 µm and CoStar™ (Conor Medsystems, Inc., Hamilton Court Menlo Park, CA, USA) with 89 µm strut with no polymer around the struts. As a composite of metal strut and polymer, the thicknesses of each type of DES differ (Table 2).
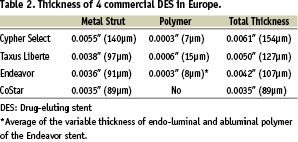
Consequently, we define ‘malapposed’ stent struts as struts with detachment from the vessel wall > 160 µm for Cypher Select, > 130 µm for Taxus Liberte, > 110 µm for Endeavor and > 90 µm for CoStar. Struts with distances less than half of the above cut-off values are defined as ‘embedded’ while all others are defined as ‘protruding’. In combination, both embedded and protruding struts are considered apposed to the vessel wall (Figure 9).


Figure 9. Definition of stent strut apposition. Note only endo-luminal surface of the metal can be identified with Optical Coherence Tomography. Different cut-offs should be adopted for each stent type. A strut is classified as embedded when less than half of a whole strut thickness is protruding into the lumen.
This classification may also be adopted to assess persistent or acquired late malapposition.
Assessment of tissue coverage following DES implantation
Unlike conventional stents which developed circumferential coverage with an average thickness of 500 µm or more, well visualised with IVUS and angiography (1mm late loss), DES delay and prevent the hyperplastic response so that the average late lumen loss for sirolimus- or paclitaxel- eluting stents can be as low as 0.1 or 0.2 mm which means the amount of intimal thickening will not be detectable with IVUS11-13. OCT offers a potential alternative to detect and measure these tiny layers of intimal coverage (Figure 10) and to assess late strut malapposition that can be distinguished, if images immediately after implantation are also available, into persistent (present already at the time of stent implantation) and acquired (negative remodelling or disappearance of superficial components behind struts such as thrombus).

Figure 10. Definition of late strut coverage. Classified into 3 groups. A: Complete - fully embedded in the tissue or circumferentially covered if a strut is protruding. B: Incomplete - partially covered with tissue. C: Absent - no visible tissue around a strut.
Limitations
Current intravascular OCT has some limitations. The imaging wire is extremely difficult to manipulate for delivery and the occlusion balloon needs to be advanced over the lesion, with a 2.3 Fr tip and 4.0 Fr shaft (proximal to the balloon) that may not cross a tight lesion or have difficulty being advanced over stented lesions. This last limitation is, however, common to IVUS catheters as well.
Ostial and very proximal lesions are not suitable for this system using the proximal occlusion balloon, because of the length of the tip, approximately 12 mm, and long occlusion balloon of 6.5 mm (Figure 1). This is currently under refinement. It should be noted however that, an image can still be acquired within the distal catheter end and through the balloon.
OCT is more accurate in assessing strut apposition compared with IVUS because of higher resolution, but its poor penetration (1.5 mm approximately) makes it inferior to IVUS in assessing stent expansion. Even if the stent struts are well apposed to the vessel wall (well attached to the intimal plaque) the stent may not be optimally expanded because balloon sizing with OCT is more difficult as it is often impossible to identify the external elastic membrane and the lumen of the distal vessel reference may be collapsed.
The system requires 30 seconds of complete coronary flow occlusion to observe a lesion of the length of 30 mm with the minimal pull-back speed of 1.0 mm/sec. The pull-back speed can be increased from 1.0 to 2.0 mm/sec with fixed frame rates of 15.4/sec, but the quality of imaging degrades with faster pull-back speeds. We have not experienced any haemodynamic instability or arrhythmias, but are compulsive in deflating the balloon and stopping flushing if significant ischaemic changes begin to develop. In some cases we have had to perform multiple pull-backs for periods shorter than 30 seconds because of ischaemia. All laborious manipulations with multiple pull-backs complicate the procedure and tend to result in incomplete blood removal and thereby hamper the quantitative analysis.
Uneven images (shifted to one side due to wire bias) are often seen in large and tortuous vessels and cause elliptical distortion of the lumen with part of the vessel outside the imaging screen. This is at present the most annoying limitation of the current software which has a limited scan range of 5 mm.
The next generation ImageWire™ will offer improved durability and trackability. Similarly, the Helios™ occlusion balloon catheter will be modified to have a shorter tip and a more kink resistant shaft. The M2 system (OCT hardware) will be improved to offer smoother Lmode (longitudinal) acquisition and edge-detection software. Eventually, automatic plaque morphology detection will also be included. Even after these changes, OCT will still be limited by suboptimal tissue penetration, because high resolution and penetration are mutually exclusive.
Conclusions
Although the current intravascular OCT system still needs some refinement for better handling and image quality, it should be considered the new gold standard in assessing apposition of stent struts quantitatively. The techniques and classifications discussed in this review can also be used for assessment of late stent malapposition taking into consideration tissue (fibrin or intimal) coverage. Clinical relevance between stent strut apposition and late adverse events such as stent thrombosis and restenosis in the DES era may also be clarified by OCT.
