Abstract
Aims: To validate a novel 3-D QCA system (CardiOp-B™) and compare the 2-D (CAAS II™) and 3-D systems in in vivo experimental settings. The phantom lumen diameters were also assessed ex vivo by optical coherence tomography (OCT). The accuracy of the 3-D system has not been appreciated.
Methods and results: Precision-drilled plexiglass phantoms with 5 different luminal diameters that ranged from 0.5 to 1.9 mm were percutaneously inserted into the coronary arteries in four Yorkshire pigs. Twenty-two angiographic images of the artificial phantom coronary artery stenoses in the pigs were acquired as an in vivo validation test. Quantitative assessments of the minimum and mean lumen diameters were performed using both QCA systems. Ex vivo images of the same phantom lumens were also taken and measured using OCT.
Both of the 2-D and 3-D QCA systems significantly underestimated the actual phantom lumen diameters with the exception of measurements taken in the lateral projection at isocenter using the 2-D QCA systems. This underestimation was more significant in the 3-D system (accuracy of 0.19 at isocenter; 0.23 by catheter calibration). There was good agreement between the two QCA systems. OCT measured the ex vivo lumen diameter of plexiglass phantoms precisely.
Conclusions: The accuracy of the luminal diameter measurements with the current 2-D system was still superior to the 3-D system. Further development and validation studies under various conditions are warranted. The excellent results achieved by OCT with the ex vivo images indicate its potential as an intravascular quantitative imaging tool for future clinical practice.
Introduction
The field of quantitative coronary angiography (QCA) has undergone substantial improvement since the first automated QCA developments took place 1980’s1. Two major clinical applications have stimulated this improvement: 1) the on-line use during coronary intervention procedures in catheterisation laboratories; 2) the use as an angiographic endpoint for the assessment of stent or pharmacological treatments in experimental and clinical trials. On the other hand, the use of two-dimensional (2-D) interpretation of lesion or vessel anatomy and the lack of information about the vessel wall (other than for calcification) are well known limitations of current angiography and are situations where intravascular ultrasound (IVUS) can provide supplemental information. Development of online three-dimensional (3-D) vessel reconstruction systems based on angiography may be a solution to the former limitation. The concept of 3-D reconstruction of coronary tree was postulated as early as the 1980’s2. The routine use of a 3-D quantitative angiography system in the catheterisation laboratory could be a major improvement in interventional cardiology.
Recently, a novel 3-D visualisation and quantitative analysis software system (CardiOp-B™, Paieon Medical Inc., Rosh Ha’ayin, Israel) has been introduced. This newly developed software system uses the detected vessel contours in two projections during coronary angiography to visualise a 3-D reconstruction of an arterial segment. Quantitative results are presented based on the reconstruction. Its utility and potential advantage over 2-D QCA systems has been reported3,4. However, to date there have been no studies determining the accuracy of the 3-D quantitative angiographic technique by the in vivo measurement of precisely known vessel lumens. Our group has implemented in vivo validation techniques using radiolucent cylindrical plexiglass or polyamide stenosis phantoms with precision-drilled eccentric lumens in the field of quantitative angiographic analysis5-7. The aim of this study was to validate a novel 3-D QCA system (CardiOp-B™) and compare the 2-D and 3-D systems in in vivo experimental settings that simulated a diagnostic coronary angiogram.
Aside from the primary objective, we also tested the accuracy of optical coherence tomography (OCT), a light-based imaging modality with a high resolution (10 µm), in the ex vivo measurement of lumen diameter using the same plexiglass phantoms. This additional examination was performed in order to investigate its potential as a quantitative intravascular imaging modality in the future.
Methods
This study was conducted according to the guidelines of the American Heart Association on animal use in research and was approved by the ethics committee on animal experimentation of the Erasmus Medical Center.
Plexiglas stenosis phantoms
The stenosis phantoms were manufactured at the workshop of the Erasmus Medical Center. The phantom stenoses that were used consist of radiolucent plexiglass (acrylate) and polyamide cylinders that have had precision-drilled circular lumens of 499 (aimed to be 0.5mm), 707 (0.7 mm), 982 (1.0 mm), 1,367 (1.4 mm) and 1,921 µm (1.9 mm) in diameter (Figure 1).
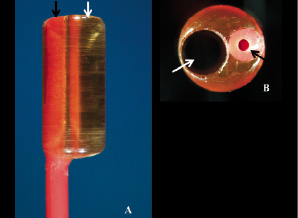
Figure 1. A: The magnified tip of one of the Fogarty catheters used for mounting the phantom. Note the transparent radiolucent cylinder connected to the tip of the catheter with a channel of 1.9 mm diameter (white arrow) and the catheter lumen used for insertion of removable metallic stylet (black arrow). B: The catheter tip photographed perpendicularly to the long axis of the phantom lumen. Note the almost perfect circular aspect of the precision-drilled lumen (diameter 1.9 mm, white arrow). The catheter lumen used for insertion of metallic stylet is indicated with a black arrow.
The outer diameters of the cylinders are 3.0 or 3.5 mm; the mean lengths of phantoms are 8.28, 7.96, 7.85, 8.01, and 7.38 mm in 0.5, 0.7, 1.0, 1.4, 1.9 mm diameter phantoms, respectively. Optical calibration of the stenosis channels using 40 fold magnification gives a tolerance of 0.003 mm. A second 1.3 mm diameter lumen, parallel to the stenosis lumen, has been drilled in the cylinders to enable their attachment to the tip of 4 Fr Fogarty catheters (Vermed, Neuilly en Thelle, France). The lumens of the Fogarty catheters contained a removable metallic stylet that aided the intracoronary insertion of the phantoms as well as their positioning in the radiographic isocenter. Details of our experimental approach to QCA validation have been previously described5-7.
Animal preparation
Four Yorkshire pigs (average weight, 40 to 45 kg) were pretreated with intramuscular ketamine (20 mg/kg) and intravenous etomidate (5 mg/kg). The animals were then intubated and ventilated with a mixture of oxygen and isoflurane. Anaesthesia was maintained with a continuous intravenous infusion of pentobarbital (5-20 mg/kg/hour). 12 Fr introducer sheaths were inserted into both carotid arteries to allow the sequential insertion of the guiding catheter and phantoms. Jugular access was used for the administration of medication and fluid. An intravenous bolus (10,000 IU/l) followed by a continuous infusion of heparin was given.
In vivo image acquisition of stenosis phantoms by fluoroscopy
The digital angiograms were obtained with a biplane cine angiographic system (Axiom Artis™, Siemens, Forchheim, Germany) that employs a matrix size of 1,024 x 1,024 pixels. The radiographic system settings used were the same (kVp, mA, ms) in all projections. All phantoms were imaged in two projections simultaneously. After engaging the 6 Fr guiding catheter (Mach 1™, Boston Scientific Corp., Natick, MA, USA) in either the left or right coronary artery, intracoronary isosorbide-dinitrate (1 mg) was administered. The first angiogram was then performed for orientation purposes. The phantoms were wedged in the coronary arteries and positioned in the X-ray isocenter using the tip of the metal wire as a marker. The wire was removed prior to angiography. Coronary angiography was performed by manual injection of contrast medium (Visipaque™ 320 mg I/ml, Amersham Health B.V., Eindhoven, The Netherlands). The ventilator was disconnected transiently during contrast injection to minimise the effect of diaphragmatic movement on angiographic images.
Calibration
Two different calibration methods were used during off-line analysis. 1) Calibration at the isocenter: this method was performed using an automatic isocentric calibration - this is one of the calibration options of the biplane angiographic system. The calculated calibration factor is used for 2-D and 3-D QCA analyses by entering the number in millimetres in the manual calibration mode; 2) Conventional catheter calibration: the non-tapering part of the tip of each 6 Fr guiding catheter filled with contrast was used as a reference.
Quantitative angiographic analysis of ex vivo and in vivo phantom images
The off-line measurement of the minimum lumen diameter (MLD) and the mean lumen diameter (mean LD) were performed by 2-D QCA (CAAS IITM version V2.0.1, Pie Medical Imaging, Maastricht, The Netherlands) as well as by 3-D QCA system (CardiOp-BTM version 1671017, Paieon Medical Inc.). For in vivo analysis, an end-diastolic cine frame was selected.
Manual edge correction is an option available in both systems, but this was intentionally never allowed in the present analyses. In the 2-D system, a restriction option was applied in order to correct for an unsatisfactorily detected contour in one image. This option is not technically a manual correction, but offers users the possibility of excluding parts of the image of the detection by restricting the area of interest. For the one measurement with the 3-D system, the automatically determined stenotic segment was manually corrected to avoid the measurement of the MLD at the site of a discrete intraluminal filling defect. Minimum values as well as mean values were determined as the diameters of the stenosis phantom lumens. Each angiographic image that was analysed or calibrated (for catheter calibration) was designated specifically by the number of the frame count so that all of the analyses using both QCA systems were performed upon identical images.
2-D QCA system
The diameter of the stenosis phantoms was calculated with an automatic contour detection technique. The user is able to define a number of centreline points within the vessel segment. The frontal and the lateral images are analysed separately. The mean LD of the phantom lumen is obtained with the CAAS II™ system from a user-defined region of interest (ROI) where the two vessel contours are considered to be parallel (Figure 2).
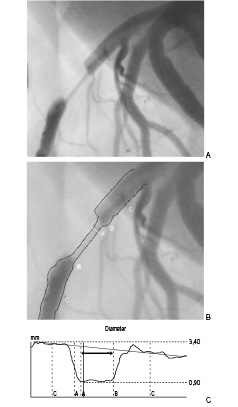
Figure 2. Angiographic visualisation of the artificial coronary obstruction produced by a 1.0 mm stenosis phantom in the left anterior descending artery (A) with subsequent quantitative measurement of luminal diameter by 2-D QCA system (CAAS II™) (B, C). The bidirectional arrow indicates the region of interest for mean luminal diameter (C).
3-D QCA system
This system uses the contours detected in the frontal and lateral images in combination with the projection data in the DICOM format into a 3-D reconstruction of an arterial segment. The two acquired images that are used for reconstruction must differ by an angle of at least 30 degrees. In this study, two orthogonal views, simultaneously acquired by the biplane system, were used for reconstructing a 3-D vessel image. If calibration was performed in one view, further calibration was not requested in the second corresponding view. To perform quantitative analysis, the user is requested to mark three points: proximal and distal reference points and point within the stenosis. The severity of the stenosis is indicated by the colour given by the computer to the reconstructed segment that varies from white (healthy vessel) to dark red (99% cross-sectional area stenosis) (Figure 3).

Figure 3. Illustration of the 3-D reconstruction process by CardiOp-BTM. Color-coded 3-D reconstruction of coronary artery with artificial stenotic segment (3-D Reconstruction view) is derived from 2 orthogonal views (Frontal and Lateral). The 3-D colour varies according to the severity of stenosis ranging from white (healthy vessel) to dark red (99% cross-sectional area stenosis). The squares in pale blue, yellow and green denote proximal reference point (P), most stenotic point (S) and distal reference point (D) of the target lesion, respectively. The region of interest (ROI) for calculation of mean luminal diameter can be manually defined by moving the proximal (P) and distal (D) points (Definition of ROI for mean LD; Graph view).
The minimum luminal diameter values are automatically given as one of the default quantitative data. As mean LD within the user-defined ROI is not automatically supplied in this system, we obtained the values using a text import wizard of MS Excel 2003.
The current version of 3-D QCA system does not provide quantitative degree of vessel curvature and bifurcation angle between main and side branch.
Ex vivo image acquisition of stenosis phantoms by OCT
We prepared a fluid mixture containing 90% degassed water and 10% ethanol as an ex vivo replacement for blood. The room temperature was kept at 22 °C. These conditions are similar to those required for the preparation for an ex vivo validation of intravascular ultrasound8,9. The OCT wire was inserted into the five differently sized phantom lumens. Images were obtained with the M2 OCT imaging system (Lightlab Imaging, inc.). The M2 OCT system uses a 1,310-nm broadband light source to produce images with an axial resolution of 15 µm and a lateral resolution of 25 µm by the principle of interferometry. The M2 uses the ImageWire™ imaging probe to deliver light to the tissue and collect the returning signals. The ImageWire™ consists of 0.006-inch (0.15 mm) fiberoptic core, inside a sheath with a maximum o.d. of 0.019 inch (0.48 mm).
OCT image analysis
The images were stored for off-line analysis in the OCT system computer. The analysis was performed using proprietary software from Lightlab Imaging, Inc. with a mouse based interface. The system was calibrated to the reflection of the OCT imaging wire that is the standard calibration technique for this system. Lumen diameter and lumen area in each of the 5 phantoms were measured.
Intra- and inter-observer variability assessment
Two independent observers, who were blinded to the real phantom diameters, assessed reproducibility by measuring the minimum and mean luminal diameter using each of the two QCA systems. In the ex vivo cases imaged by OCT, only the cross sectional diameter was analysed and used for evaluation of reproducibility. These examinations by two observers were performed on different days. One of the two observers performed second measurements on different days for assessment of individual reproducibility.
Statistical analysis
The individual values for minimum and mean luminal diameter obtained by both QCA systems were compared with the corresponding values of the phantom by paired t test (two-tailed). Additionally, the data were plotted against the actual phantom diameter values and a linear regression analysis was applied. The mean differences between measured luminal diameters and the corresponding phantom dimensions were computed and considered to be an index of the accuracy of the measurements, while the standard deviation of the differences was defined as an index of precision. The relative standard deviation was calculated (precision / mean of measured diameter value x 100) to assess the degree to which the sets of diameter data points varied. In order to determine the agreement between 2-D and 3-D QCA systems, Bland-Altman analysis was performed10. Statistical analyses were performed with SPSS 12.0.1 for Windows (SPSS Inc., Chicago, IL, USA). A p value < 0.05 was considered statistically significant.
Results
Thirty coronary angiographic images were acquired after intracoronary insertion of the stenosis phantoms. Three images were excluded from the QCA analysis because of extreme foreshortening of the stenosis segment in frontal views. Five images that had insufficient arterial filling using the 0.5 or 0.7 mm phantoms were also excluded. The remaining 22 images were used for the diameter measurements using both QCA systems.
In vivo intra- and inter-observer variability of the 2 QCA systems and ex vivo OCT was calculated in all the 22 analysable images (Table 1).

Satisfactory reproducibility was noted in all of the two QCA systems and OCT.
In vivo assessment of luminal diameter by 2-D and 3-D QCA
The comparative results of the actual phantom lumen diameter and the dimensional values derived from both QCA systems are shown in Table 2 along with Figures 4 and 5.
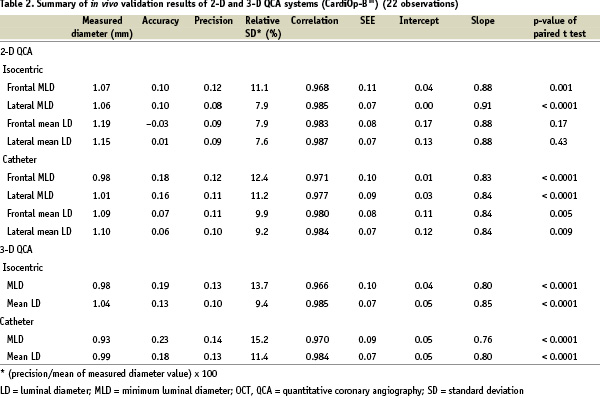
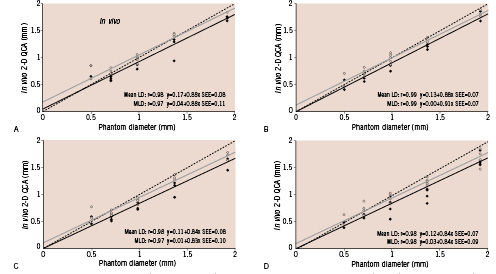
Figure 4. Two-dimensional QCA assessment of minimum (continuous black lines) and mean luminal diameter (continuous grey lines) with calibration at the isocenter in frontal (A) and lateral views (B) and with catheter calibration in frontal (C) and lateral views (D). The dashed lines indicate the line of identity.
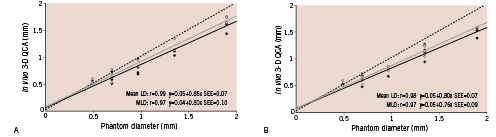
Figure 5. Three-dimensional QCA assessment of minimum (continuous black lines) and mean luminal diameter (continuous grey lines) with calibration at the isocenter (A) and with catheter calibration (B). The dashed lines indicate the line of identity.
In both systems, accuracy was better with isocentric calibration compared to catheter calibration. Mean luminal diameter measurements yielded better accuracy than minimum values in any of the dimensional measurements. Among the 8 methods of diameter measurements in the 2-D QCA, mean luminal diameter by isocentric calibration in lateral view proved to have the best accuracy (0.01 mm). Both systems significantly underestimated the actual phantom diameter values, except for minimum and mean diameters in the lateral view with isocentric calibration.
There was again good correlation between luminal diameter measurements and phantom actual diameter values with both QCA systems (r=0.961 ~ 0.987). However, the 2-D QCA system demonstrated better values of accuracy than the 3-D system in diameter measurements regardless of the calibration option.
Agreement between 2-D and 3-D QCA systems
A direct comparison between the 2-D (frontal views) and the 3-D QCA systems is shown in Figure 6.
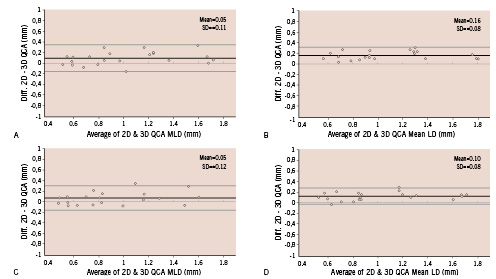
Figure 6. Bland-Altman plots of the differences between the minimum and mean luminal diameter measurements acquired by the 2 systems versus means of the measurements. A: minimum diameter with calibration at the isocenter. B: mean diameter with calibration at the isocenter. C: minimum diameter with catheter calibration. D: mean diameter with catheter calibration. The data from the frontal view are used as 2-D QCA measurements.
The two systems demonstrate good correlations in diameter measurements (r=0.947 isocenter, minimum; r=0.982, isocenter, mean; r=0.940, catheter, minimum; r=0.976, catheter, mean). The plot of differences between both systems demonstrates satisfactory agreement over the entire range of phantom sizes. This proved to be true for calibration at the isocenter as well as for catheter calibration (Figure 6).
Ex vivo assessment of luminal diameter by OCT
Figure 7A depicts the linear regression analysis of comparison between actual phantom luminal diameter versus ex vivo diameter values derived from OCT. OCT-based dimensional values proved to correlate extremely well with the real luminal diameter (accuracy=– 0.03, precision=0.02, relative standard deviation=1.8%, r=1.000, intercept=0.01, slope=1.02). OCT clearly visualised the circular lumen of plexiglass phantom (Figure 7B).
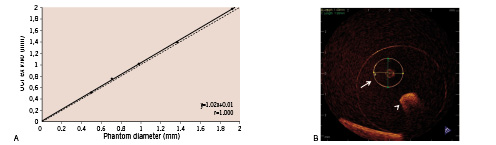
Figure 7. A: Linear regression analysis of the phantom lumen diameter versus the cross-sectional luminal diameter measured with OCT. B: Representative OCT images of the stenosis phantom with 1.4-mm lumen. Arrow: 1.4-mm lumen for measurement; arrow head: lumen for guidewire.
Discussion
The results of the present study indicate the following three findings: 1) the 3-D QCA system significantly underestimated actual phantom diameter values compared to the 2-D system; 2) the 3-D QCA system showed a good agreement with the 2-D QCA system; 3) the values of the ex vivo diameter measurements by OCT were almost identical to the actual phantom diameter values.
As the number of coronary interventions has increased over the years, the complexity of target lesions has increased concomitantly. Development of a 3-D visualisation and quantitative analysis system has been encouraged by the increasing need to better understand the true vessel structure and the spatial orientation of complex features and to quantify vessel morphology more precisely. There is a growing interest in applying this new technology as an additional imaging tool in interventional cardiology. Recently, the feasibility and potential superiority of 3-D QCA system in the measurement of 38 coronary lesions was reported by comparing it with a 2-D QCA system (Medview™, Medcon Telemedicine Technology, Tel Aviv, Israel)3. However, this 3-D QCA system should be evaluated in comparison with the largely validated conventional 2-D QCA systems5,7,11,12. Moreover, the accuracy or limitations of this system can only be appreciated by measuring in vivo vessels of known lumen dimensions. This is especially important since the accuracy of the reconstruction is not only the basis for quantitative results but also for producing a correctly visualised image. In theory the 3-D quantitative analysis should fully correct for foreshortening and out-of-plane magnification differences.
Systematic underestimation of luminal diameter measurements was noted for both QCA systems and this was more significant in the 3-D system. The image acquisition was performed by hand injection of contrast and this may result in less radiographic opacity of stenotic segment compared to mechanical injection. Consequently automated detection of vessel boundaries might have been affected leading to smaller diameter values than expected having been derived. However, even with mechanical contrast injection, the angiographic examination of these high-grade stenosis phantoms cannot always be satisfactory because of possible intraluminal thrombus that results from the reduced blood flow or from the presence of intraluminal cellular debris collected during the insertion of the phantoms.
The values of the both QCA systems with catheter calibration were smaller than those obtained with calibration at isocenter. This might be explained by an out-of-plane magnification phenomenon:a greater distance between the image intensifier and the catheter tip than between the image intensifier and the isocenter that would result in a smaller calibration factor13,14. In the 2-D QCA system, lateral views showed better accuracy and precision than frontal views. Foreshortened images were more frequently observed in frontal views than in lateral views. Accordingly, suboptimal contour detection of frontal images might have occurred. Although theoretically the 3-D reconstruction should enable the correction of foreshortening and out-of-plane magnification errors, these improvements could not be identified in the present analysis.
OCT is a novel imaging modality that provides intravascular images that have a resolution of approximately 10 - 20 µm. This 10-fold greater resolution in comparison with IVUS enables visualisation of microscopic structures within the coronary arteries15,16. In vivo dimensional and volumetric measurements of implanted coronary stents have shown that OCT can produce accurate results that are comparable to IVUS17. Post-mortem analysis suggested that OCT can measure the intima-media thickness more accurately than IVUS18. Currently OCT is regarded as a modality that may surpass the performance of angiography or IVUS after stent implantation19,20. The present study provided ex vivo validation of OCT with respect to diameter measurements. Unfortunately, we could not compare OCT to IVUS because the IVUS catheter could not cross phantom lumens smaller than 1.0 mm. Furthermore in vivo examination would most likely prove difficult in these high-grade stenoses as the presence of a wire itself might result in the rapid development of intolerable ischaemic changes for the animals even before the induction of further ischaemia by the OCT occlusion balloon.
Limitations
This validation test using concentric cylindrical phantoms was originally designed to test 2-D QCA systems5,7,11,12. The use of phantoms with a regular circular lumen does not allow the assessment of asymmetry. Here the use of reconstruction from two projections included in one 3-D result supplies information of lesion asymmetry more precisely than that available from 2-D analysis. Since the precise and validated eccentric phantoms were not readily available, we decided to conduct the present study with previously established approach using concentric phantoms5,7,11,12. The 3-D reconstruction is based on a two imaged diameters that results in an oval cross section where the 2-D analysis is based on one image results in a single diameter to be used for a circular cross section. However, densitometric analysis available in the 2-D QCA system can provide estimates for cross sectional areas in complex lesions21,22.
Our results were based on a series of small-size (< 2 mm) lumen phantoms. From a clinical point of view, validation tests using larger-size (> 2.25 ~ 2.5 mm) phantoms might be more relevant to investigate whether this 3D system is useful as a tool to determine the optimal device size, or to confirm the acute post-procedural results during the interventional procedures.
Conclusions
The minimum and mean luminal diameter measured with the 3-D QCA system underestimated the true phantom lumen diameter more than 2-D QCA. However, since there was a strong correlation with the 2-D QCA system, this system could be a useful alternative in clinical practice. OCT precisely measured the lumen diameter of plexiglass phantoms in this ex vivo experimental setting. In addition to its usefulness in the quantitative assessment of coronary plaque, this imaging tool could be developed further as a reliable device for intravascular quantitative assessment with the advancement of less invasive preparation for the image acquisition.