Abstract
Aims: There is no mention in the current “appropriateness criteria for CTCA” of the need of CTCA investigation prior to an attempt at recanalisation of a CTO. To define better the role of CTCA in the treatment of patients with CTOs, we performed CTCA in a consecutive cohort of eligible patients who were scheduled for percutaneous recanalisation of a CTO.
Methods and results: Symptomatic patients due to a CTO suitable for percutaneous treatment were included. One hundred and thirty-nine (142 CTOs) patients were studied. Overall success rate was 62.7%. By CTCA, the occlusion length was 24.9±18.3 vs. 30.7±20.7mm in successful and failed cases (p=0.1), but the frequency of patients with an occlusion length >15 mm was different, i.e. 63.2% vs. 82.7%, respectively (p=0.02). Severe calcification, (> 50% CSA) was more prevalent in failed cases (54.7% vs. 35.9%, p=0.03). Calcification at the entry of the occlusion was present in 58.5% of the failures vs. 41.6% of the successful cases (p=0.04), while calcium at the exit was not different. The length of calcification was 8.5±8.4 vs. 5.5±6.6 mm in the failed and successful cases respectively (p=0.027). By multivariable analysis, the only independent predictor of procedural success was the absence of severe calcification as defined by CTCA.
The mean effective radiation dose of the PCI was 39.3±30.1 mSv. The mean effective radiation dose of CT scan was 22.4 mSv: 19.2±6.5 mSv for contrast-enhanced scan, 3.2±1.7 mSv for calcium scoring scan.
Conclusions: More severe calcified patterns, as assessed by CTCA, are seen in failed cases. The radiation exposure during a CT scan prior to a CTO PCI is considerable, and further studies are required to determine whether this extra diagnostic study is warranted.
Abbreviations list
CCA: Conventional coronary angiography
CTCA: Computed tomography coronary angiography
CTO: Chronic total occlusion
PCI: Percutaneous coronary intervention
Introduction
Since success rate have remained unchanged over the last few years, there has been a decrease in the number of attempted percutaneous coronary interventions (PCI) in patients with chronic total occlusions (CTO)1. In the search for new therapeutic approaches to reopen the occluded vessel, many new CTO-dedicated guidewires and devices have become available2. Until recently, innovative imaging tools to provide the operator guidance during the most exacting phase of the procedure, i.e. crossing the lesion, have been lacking. Commonly, in angiography these lesions appear as missing segments within two vessel ends. In addition, the angiogram does not provide reliable information with regard to the trajectory of the occluded segment, its length and tissue composition, variables that have been correlated with low procedural success rate3. Computed tomography coronary angiography (CTCA) has developed into a reliable noninvasive technique to evaluate a patient for the presence of obstructive coronary artery disease4. Although, preliminary data suggests that computed tomography coronary angiography (CTCA) might be of beneficial guidance in attempting revascularisation of a CTO5, there is no mention in the current “appropriateness criteria for CTCA” of the need of a CTCA investigation prior to an attempt at recanalisation of CTO.
To define better the role of CTCA in the treatment of patients with CTOs, we performed CTCA in a consecutive cohort of eligible patients who were scheduled for percutaneous recanalisation of a CTO. We investigated angiographic and computed tomographic predictors of success and measured the amount of contrast material used during PCI and CTCA as well as the radiation exposure for both techniques.
Material and methods
Study population
Between April 2002 and March 2007, those eligible for this study included all consecutive patients presenting with symptomatic coronary artery disease due to a CTO. Specifically, patients without contra-indications for CTCA, suitable for percutaneous treatment who had provided written informed consent, were included. CTCA was considered contra-indicated in following situations: irregular heart rhythm, inability to sustain a sufficiently long breath hold (20 seconds with the 16-slice CT scanner, 15 seconds with the 64-slice or dual-source CT scanner), renal dysfunction (creatinine clearance <60 ml/min as defined with the Cockroft formula)6, hearing disability, and known contrast allergy.
A CTO was defined as either an occlusion on angiography with no antegrade filling of the distal vessel other than via collaterals or minimal antegrade flow (TIMI flow 0 or 1)7,8. All included patients had a native vessel occlusion estimated to be at least of three months duration based on either a history of sudden chest pain, a previous acute myocardial infarction in the same target vessel territory, or the time between the diagnosis made on coronary angiography and PCI. The type of CTO was either de novo or due to in-stent restenosis.
The protocol was approved by the local ethics committee and is in accordance with the principles of Good Clinical Practice for Trials of Medicinal Products in the European Community and the Declaration of Helsinki. All patients signed a written informed consent.
All the CT scans were discussed between the operator of CTO procedure and someone trained to interpreting CTCA prior to the interventional procedure.
All interventional procedures were performed by operators who were highly experienced in the treatment of CTOs, with the interventional strategy left to the discretion of the operator. Wires were used in a stepwise progression, starting with a wire that had a relatively less traumatic tip (Graphix Intermediate, Boston Scientific Corporation, Miami, Fl, USA) or a hydrophilic wire (Choice PT Plus, Boston Scientific Corporation, or Crosswire NT, Terumo Corporation, Tokyo, Japan) and progressing to stiffer wires (Miracle, Asahi Intec, Nagoya, Japan) and specialised technologies (Safe-Cross, Intraluminal Therapeutics, Carlsbad, NM, USA; or The CROSSER™ CTO Recanalisation System FlowCardia Inc, CA, USA; or the Laser Guidewire, Spectranetics, Colorado Springs, CO, USA). Detailed description of these devices and explanation of our approach to treat CTO patients has been previously reported2.
Procedural failure was defined as the inability to cross the occlusion with a guidewire.
All patients were pretreated with 300 mg of clopidogrel, which was continued at a dose of 75 mg/day for 6 months. All patients were advised to maintain aspirin (≥80 mg/day) lifelong.
Definitions
Procedural success: defined as successful opening of the chronic occlusion and restoration of flow (<50% residual stenosis and TIMI 2-3 flow).
Type of CTO: defined according to two characteristics, location (native vessel vs. graft) and quality (de novo or in-stent restenosis).
Occluded length: defined as the non-contrast enhanced segment of the vessel from the proximal to the distal end of the occlusion in the least foreshortened view on angiography or the 3-dimensional measurement of the occlusion using a dedicated software program (Circulation®, Siemens, Germany) of the CT workstation (Leonardo).
Stump morphology: defined as the entry site of the occlusion that has either a tapered- (central or eccentric) or a blunt appearance.
Side branch at the entry site: defined as the presence of any side branch, irrespective of the size, within 3 mm proximal to the entry of the occlusion.
Bridging collaterals: presence of multiple small collaterals connecting the proximal and distal lumens of the vessel by spanning through or around the occluded segment. This characteristic can only be measured by conventional angiography (CA).
Occlusion ends in bifurcation: the presence of a side branch larger than 1.5 mm within 3 mm distally to the distal end of the occlusion.
Rentrop classification9: grading of collateral filling was as follows: 0=none, 1=filling of side branches only, 2=partial filling of the epicardial segment, 3=complete filling of the epicardial segment. This classification only applies for conventional angiography since in CTCA the distal part of the vessel is almost always filled with contrast and thus can be regarded as Rentrop class 2 or 3.
Calcification: was defined as follows:
– By conventional angiography, defined as mild, moderate or severe.
– By CTCA, the number of separate calcium spots was counted and their length measured. The presence of calcium at the entry and exit side of the occlusion was annotated. All the spots were evaluated in a cross-sectional view to assess whether the calcification occupied more than 50% of the cross-sectional vessel area at any location within the occluded vessel segment. Finally, the amount of calcium in the occluded segment was quantified, using dedicated software.
Tortuosity: was defined as the presence of bends proximal to the lesion. By angiography, this feature was only scored in a binary fashion (yes/no), i.e. < or > than 45 degrees, while by CT, the angle of all the separate vessel bends was measured. (Figure 1)
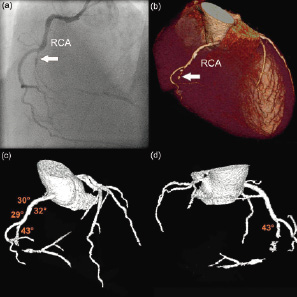
Figure 1. Assessment of tortuosity by computed tomography coronary angiography. (a) Angiographic image showing an occlusion (arrow) of the right coronary artery (RCA). (b) Volume-rendered CT image of the RCA, showing the occlusion (arrow) distal to the origin of the margo acutis. (c) 3-dimensional CT angiographic view of the coronary vasculature, illustrating the tortuosity of the vessel before the occlusion, with 4 consecutive bends. (d) same image as panel c but looking at the vessel from posterior; the final bend before the start of the occlusion is marked (43 degrees).
Angulation: was defined as the presence of bends within the occluded segment. By angiography, only a binary scoring system was used (yes/no), while by CT, the angle was measured in subsequent bends within the occlusion. (Figure 2)
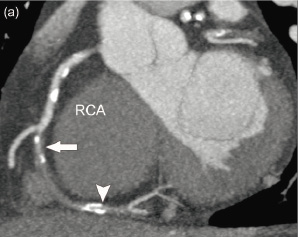
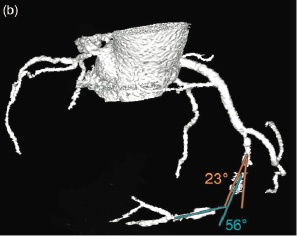
Figure 2. Assessment of angulation by computed tomography coronary angiography. (a) Maximal intensity projection of the right coronary artery (RCA) showing the vessel with the entry (arrow) and exit side (arrowhead) of the occlusion in one plane. (b) 3-dimensional CT angiographic view, illustrating the angulation within the occlusion; in this case 2 bends are visible.
Conventional coronary angiography (CCA)
Two experienced observers who were unaware of the results of the CT scans analysed each film; consensus was needed for each assessed parameter. Quantitative angiographic analysis (CAAS II, Pie Medical, Maastricht, The Netherlands) was performed to measure the vessel diameter prior to the occlusion side. The length of the occluded vessel segment was also quantified. The other variables, i.e. location of the occlusion, morphology of the stump, the presence of a side branch in the vicinity of the entry (<3 mm), collaterals and calcification were reported qualitatively.
Conventional coronary angiography: calculation of effective dose10
The Axiom study reports for each PCI procedure the used projections, the geometrical gantry settings and the generator settings for each digital cinematography (DCM), the used fluoroscopy time and the total dose-area product (DAP). The DAP is measured by an integral device in the x-ray tube, placed after the filters and the collimator and takes into account the quality, quantity, size and duration of the used x-ray beam.
A PC-based X-ray Monte Carlo program, from the Radiation and Nuclear Safety Agency, Helsinki, Finland, PCXMC, (reference Tapiovaara M, Lakkisto M, Servomaa A. A PC-Based Monte Carlo Program for calculating Patient Doses in Medical X-Ray Examinations. STUK-A139. Radiation and Nuclear Safety Agency, Helsinki, 1997) was used to estimate effective doses from conventional angiography. We did not correct for each gantry setting. We assumed all radiation was given in the Left Anterior Oblique 30 (LAO 30) projection, while the effective dose with careful simulation of all used gantry settings during DCM and fluoroscopy differed <2%. The focus-skin distance was 65 cm and the estimated entrance field size was 95 cm2 with a quality of 70 kV.
CT patient selection, scan protocol and image reconstruction
A cardiac CT scan was performed in the fortnight before PCI. During the described study period 3 successive scan generations were used in our centre. Up to July 2004, CT data were acquired using a 16-slice CT scanner (Sensation 16, Siemens, Germany). From August 2004 to March 2006, CT data were acquired using a 64-slice CT scanner (Sensation 64, Siemens, Germany) and from April 2006 on the latest dual-source CT scanner (Somatom Definition, Siemens, Germany) was used. In the period until March 2006, we systematically slowed down the heart rate in patients with a heart rate above 65 bpm, using 100 mg metoprolol or a non-dihydropyridine calcium-antagonist (diltiazem 60-120 mg) orally 1 hour before the scan. An additional IV bolus of metoprolol (5-10 mg) was occasionally administered where the heart rate remained above 65 bpm. After that period we did not use extra medication to slow down the heart rate. Instead, nitrates were systematically given as a sublingual spray (0.4 mg) to all patients 5 minutes before initiation of the scan provided the systolic blood pressure was above 100 mmHg.
Scan parameters for each of the 3 scanner types were the following:
– 16-slice CT scanner: collimation 16x0.75 mm, tube rotation time 375 ms, tube voltage of 120 kV, table feed 3 mm per rotation. For the non-enhanced scan we used a tube current of 150 mAs and applied prospective x-ray tube modulation. For the angiographic scan we used a tube current that ranged between 500 and 600 mAs without the use of dose pulsing.
– 64-slice CT scanner: collimation 64x0.6 mm, tube rotation time 330 ms, tube voltage of 120 kV, table feed 3.8 mm per rotation. For the non-enhanced scan we used a tube current of 150 mAs and applied prospective x-ray tube modulation. For the angiographic scan we used a tube current that ranged between 850 and 960 mAs without the use of dose pulsing.
– dual-source CT scanner: collimation 64x0.6 mm, tube rotation time 330 ms, tube voltage of 120 kV. For the non-enhanced scan we used a tube current of 84 mAs per tube and full X-ray tube current was given during 50-70% of the RR interval. For the angiographic scan we used a tube current of 412 mAs per tube and limited this amount of tube current to 25-70% of the RR-interval. Pitch values were adapted to heart rate (minimal pitch value of 0.2 for slow heart rates, up to a maximal pitch value of 0.45 with higher heart rates).
The contrast-enhanced scan was obtained after the intravenous injection of 70-100 ml of contrast material (iomeprol, 400 mg iodine/ml, Iomeron® with the 16- and 64-slice CT scanner or iopromide, 370 mg iodine/ml, Ultravist® with the dual source CT scanner) through a large antecubital vein at a flow rate of 4-5 ml/sec, followed by 40ml of saline flush at 4 ml/s. A bolus tracking technique was used to monitor the appearance of contrast material in the ascending aorta. Once the signal in the ascending aorta reached a predetermined density level of 100 Hounsfield units, CT acquisition was automatically started during an inspiratory breath hold. Images were reconstructed using ECG-gating to obtain optimal, motion free image quality.
The scan data were reconstructed at various phases of the cardiac cycle using medium-to-smooth (B26f) and sharp (B46f) convolution kernel. Image reconstruction was retrospectively gated to the ECG. The position of the reconstructed window within the cardiac cycle was individually optimised to minimise motion artefacts. Datasets containing no or minimal motion artefacts were transferred to a remote workstation (Leonardo workstation, Siemens, Erlangen, Germany) for further evaluation.
CT coronary angiography: calculation of effective dose
The effective radiation dose was calculated from the scan parameters using dedicated software (ImPACT CT Patient Dosimetry Calculator, version 0.99x), as described in the European Guidelines on Quality Criteria for Computed Tomography (Available at: http://www.drs.dk/guidelines/ct/ quality/index.htm).
CT data analysis
Two experienced observers independently evaluated the CT data sets on both the original axial images and on multiplanar reformatted reconstructions for the presence of an occluded vessel. This initial assessment was performed blinded to the angiographic data. Subsequently, the observer was provided with the angiographic information, i.e. the occluded vessel in which PCI was performed, without having access to the angiographic images. After confirmation of the right vessel, the further CT analysis was performed without knowledge of the angiographic characteristics of the occluded vessel. In a few occasions, especially in case of heavy calcifications of the vessel, angiographic information on the start and end of the occlusion was provided to allow calculation of the occlusion length. To measure the length of the occlusion on CT we used a dedicated software program (Circulation®, Siemens, Germany), which allows creating a central lumen line through the vessel. By rotating the vessel around this line the exact entry and exit point of the occlusion can be visualised, thus allowing us to measure the length of the occlusion along the 3-dimensional vessel path without foreshortening. (Figure 3).
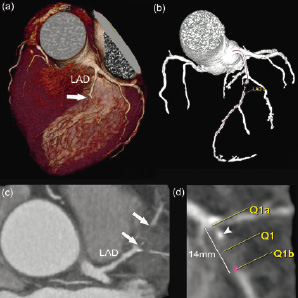
Figure 3. Measurement of the length of the occlusion by computed tomography coronary angiography. CT images showing an occlusion of the left anterior descending coronary artery (LAD). (a) Volume-rendered image showing the proximal part of the occlusion (arrow). (b) Using the Circulation® software the entire coronary tree can be extracted from the dataset. The start and end points for the vessel to be examined, in this example the LAD, are marked and a centreline through the middle of the vessel is displayed and labeled between these 2 points. (c) Maximal intensity projection showing the approximate length and composition, in this case non-calcified, of the occlusion. (d) After defining the centreline of the vessel, features of the occlusion such as length and composition can be evaluated. The markers Q1a and Q1b set the boundary marker at the beginning and end of the occlusion, which in this case measures 14mm. The proximal part of the occlusion shows a small amount of calcium (arrowhead).
Statistical analysis
Assumptions for normality were checked by Kolmogorov-Smirnov test and by visual assessment of Q-Q plots of residuals. Accordingly, log transformation was performed on the variables with skewed distribution. Continuous variables are presented as mean ±1SD and differences were compared using Student t test or Mann Whitney test. Categorical variables are presented as counts and percentages and differences were assessed by Fisher exact test or chi-square test, as appropriate. A two-sided p value of less than 0.05 indicated statistical significance.
The following variables were included in the multivariable analysis dataset: baseline characteristics (gender, age, diabetes mellitus, previous myocardial infarction, family history of coronary artery disease, smoking, hypertension, hypercholesterolaemia, previous PCI and previous coronary artery bypass surgery, vessel disease and target vessel), conventional angiographic characteristics (ostial location, stump morphology, presence of bridging collaterals, presence of side branch at the entry of the occlusion, degree of calcification and tortuosity [yes/no]); and CTCA characteristics (ostial location, stump morphology, presence of side branch at the entry of the occlusion, calcification -at entry, -at exit, >50% CSA, length of the calcification, angulation as a continuous variable, tortuosity as a continuous variable and length of the occlusion as a continuous variable. Due to collinearity problems, some variables were removed from the model. On the remainder of the variables we ran a backward selection procedure. Statistical analyses were performed with use of SAS V8.02.
Results
One hundred and thirty-nine (142 CTOs) consecutive patients were enrolled in this prospective registry of patients treated for a chronic total occlusion.
The mean age was 60.7±10.8 years, most of the patients being male (87.3%) (Table 1).
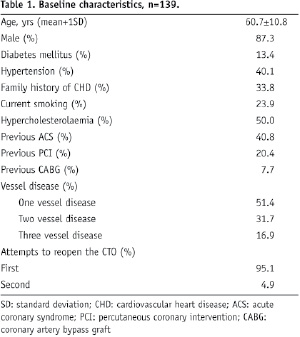
For the majority of the patients (95.1%) this was the first attempt to open the CTO. Most of the occlusions were de novo lesions and the most frequently treated coronary artery was the left anterior descending (Table 2).
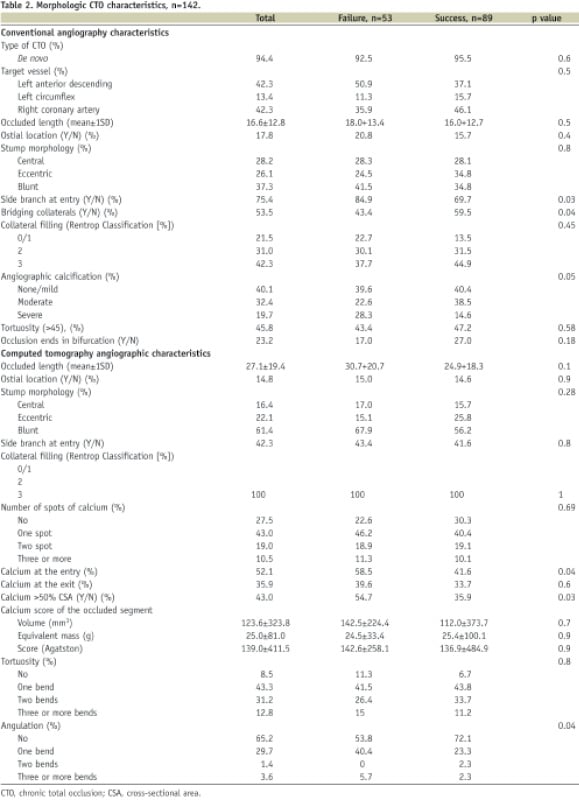
Overall success rate was 62.7%.
CTO characteristics by conventional coronary angiography and CTCA
By conventional coronary angiography, the mean vessel diameter was larger in successful procedures (2.9±0.4 vs 2.1±0.7, p=0.02) as compared to procedural failures. Overall the length of the occlusion was 16.6±12.8 mm and there was no difference in successful vs. unsuccessful cases (16.0±12.7 and 18.0±13.4, p=0.5). The presence of a side branch at the entry was more frequently seen in failed cases (84.9 vs. 69.7%, p=0.03). Conversely, the presence of bridging collaterals was more frequently seen in successful cases (59.5 vs. 43.4%, p=0.04). Severe calcification, as defined qualitatively, was more prevalent in failed cases (28.3 vs. 14.6%, p=0.05). (Table 2)
By CTCA, the occlusion length was widely dispersed, mean 27.1±19.4 mm (range 2.6 to 93.4 mm) and longer as compared with CA. Although the occlusion length did not differ in successful as compared to failed cases (24.9±18.3 and 30.7±20.7, p=0.1), the frequency of patients with an occlusion length >15 mm was significantly different, i.e. 63.2% in those with procedural success vs. 82.7% in those with procedural failure (p=0.02).
CTOs without calcification were present in 27.5% of the treated lesions. The presence of severe calcification, defined as calcium that occupies more than 50% of the vessel cross-sectional area, was more prevalent in failures (54.7%) as compared to patients with a successful PCI procedure (35.9%) (p=0.03). The length of the calcified segments was longer in failed as compared to success cases (8.5±8.4 vs. 5.5±6.6 mm, p=0.027). When calcifications were present in the CTO, it was especially located at the entry side of the occlusion. Interestingly, calcification at the entry of the occlusion was present in 58.5% of the failures as compared to 41.6% of the successful cases (p=0.04), while the frequency of calcium at the exit was not different between the two patient groups. The absence of angulation in the occlusion was also a predictor of favourable outcome: procedural success was 72.1% in CTOs without angulation as compared to 53.8% in angulated CTOs (p=0.04) (Table 2).
Of note, the calcification patterns are affected by age but similar between genders (data not shown). Patients with severe calcification (>50% CSA) were older than their counterparts (63.9±9.0 vs. 58.3±11.4, p=0.002). Patients with longer calcification segments (cut-off set on >4.3mm – median of the length of calcified segments in this population) were also older (63.4±9.7 vs. 55.8±11.2, p=0.005). Patients with calcification at the entry of the occlusion segment were 61.4±10.2 vs. 55.4±10.6 year old, p=0.0007, and also patients with calcification at the exit were older 62.6±9.5 vs. 55.9±10.7 year old, p<0.0001.
In Table 3 a comparison between CCA and CTCA for the detection of calcium in the occlusion is shown.
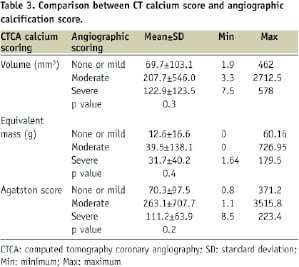
The angiographic estimation of the presence and severity of coronary calcification differed from the quantitative CT calcium score indices (i.e. volumetric score, equivalent mass or Agatston calcium score).
In the multivariable analysis the only variable that remained a significant predictor of procedural success, was the absence of severe calcification, i.e., calcium occupying >50% of the vessel CSA, as defined by CTCA (Table 4 and Figure 4).
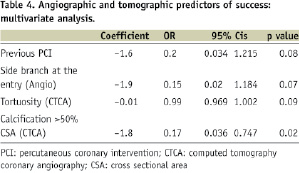
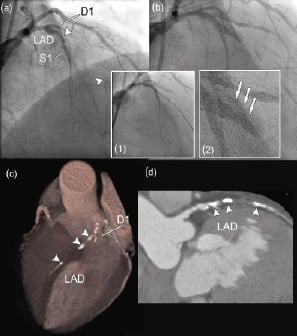
Figure 4. Assessment of calcification by computed tomography coronary angiography. Failed percutaneous coronary intervention in a patient with a chronic total occlusion of the left anterior descending coronary artery (LAD). (a) The angiographic borders of the occlusion are marked by arrows. (b) Final angiographic image showing persistent occlusion of the LAD. Insets show the wiring through the occlusion (inset 1) that appears to be in the false lumen as illustrated by the presence of contrast extravasation (arrows) once the wire is removed. (c) The volume-rendered CT image clearly shows heavy calcifications within the occluded segment (arrowheads). (d) Curved multiplanar reconstruction again highlighting the large calcifications (arrowheads) within the occlusion. D1, first diagonal branch. S1, septal branch.
Procedure related characteristics and effective radiation dose (Table 5)
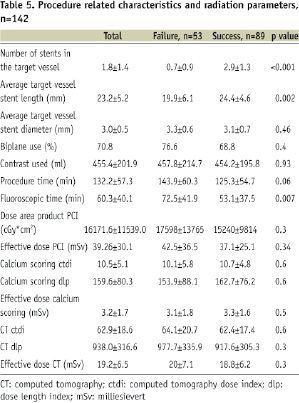
Overall, the mean amount of contrast used was 455.4±202 ml and was not different between the patient treatment groups. The fluoroscopic time was higher in the failed cases as compared to the successful cases, 72.5 versus 53.1 minutes respectively, p=0.007. The mean effective radiation dose of the PCI procedure was 39.3±30.1 mSv. Overall, the mean effective radiation dose of the preprocedural CT scan was 22.4 mSv: 19.2±6.5 mSv for the contrast-enhanced scan, 3.2±1.7 mSv for the calcium scoring scan. The mean effective radiation dose per scanner type was: 14.4±5.7 mSv for 16-slice CTCA (n=34 patients), 20.1±1.6 mSv for 64-slice CTCA (n=42 patients) and 21.8±6.5 mSv for dual-source CTCA (n=63 patients).
Discussion
In this registry of 139 patients we evaluated the possible role of CTCA when attempting PCI of CTOs. We found that the distribution rather than the amount of calcium impacts on the procedural outcome of this particular group of patients. Not unexpectedly, CTCA was more accurate than CCA for defining the morphological features of CTOs. In particular, we found that the assessment of calcification by CTCA was more predictive of success than CCA in the multivariate model. It is difficult to prove the added value of a preprocedural CT scan in terms of procedural outcome. However, it is fair to say that a better understanding of the anatomical features of an occluded vessel can modify our intentional treatment strategy11. Dedicated CTO wires and new treatment strategies have been developed recently and appear to be useful in selected cases12. However, these new tools need to be used judiciously, and in our view, in the right anatomical context. A promising new strategy to treat CTOs, is the retrograde approach which has been introduced as an alternative route for recanalisation of otherwise difficult or impossible lesions and is gaining acceptance among interventionalists due to its high success rate13. A possible explanation is the fact that calcium is more prevalent at the entry of the occlusion, so a higher chance to cross/break the distal cap and make progress retrograde would encourage the operator to continue until success is achieved (Figures 5a and 5b).
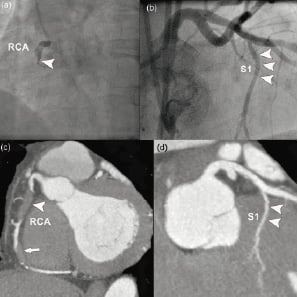
Figure 5a. Retrograde approach. (a) Angiographic image, showing proximal occlusion (arrowhead) of the right coronary artery (RCA). (b) Angiographic image of the left coronary artery, showing a large septal branch (arrowheads). (c) Corresponding CT image of the RCA showing 2 consecutive non-calcified occlusions of the vessel. (d) Corresponding CT image of the left coronary artery, also showing the large septal branch.
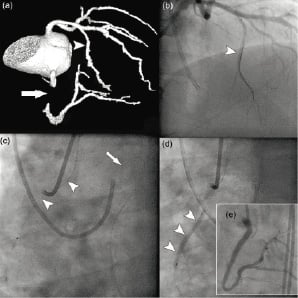
Figure 5b. Retrograde approach. Same patient as in 5a. Illustration of the percutaneous retrograde technique. (a) 3-dimensional CT angiographic view, showing he occlusion of the RCA (arrow) and the large septal branch (arrowhead). (b) Wiring of the septal branch (arrowhead). (c) The wire is introduced through the guiding catheter that is engaged in the left coronary artery (arrow) and was successfully advanced through the septal branch and finally retrograde through the RCA ending into the ascending aorta (arrowheads). (d) Balloon inflation over the wire that has been positioned retrograde in the RCA. (e) Final angiographic result after subsequent antegrade balloon dilatations and stenting of the vessel.
Our data corroborate what intuitively was written in the consensus document from the EuroCTO club14: “the distal fibrous cap is often less resistant than the proximal cap”. Another anatomical factor that favours the retrograde approach is the presence of side branch at the entry side of the occlusion that in our series was related to failed cases (Figures 5a and 5b).
The location of calcification is not only a strong determinant for crossing the lesion with the guidewire, but also influences the balloon selection. In severely calcified lesions small diameter balloons, i.e. 1.0, 1.1 and 1.25 mm, with a lubricious coating and acceptable shaft pushability are usually required14.
Calcification of the coronary arteries has been related to age in several publications15,16. In our study, CTOs with longer and more severe calcified patterns were present in older patients. Also, the mean age of patients with calcifications at the entry and exit sides of the occlusion was significantly higher.
Undoubtedly, this is a high-risk subset of patients in different aspects and the decision to choose a percutaneous intervention should envisage maximal chances for success at minimal patient risk. The amount of contrast used and the radiation dose a patient receives are important variables that have an impact on patient safety. The contrast load during a CTO recanalisation attempt is higher as compared to non-CTO procedures17,18. In this study, the average amount of contrast used was 455.4 ml. In addition, a PCI of a CTO is often characterised by a long procedural time and a high radiation dose. Usually during the procedure one view is maintained, or two orthogonal views in case of biplane use, which leads to an intense exposition of the same skin areas10 and body segments14. The average radiation dose of a PCI procedure in this study was 39.26 mSv. This is 8 times higher than the dose received during a conventional coronary angiogram19. In addition, patients received a mean radiation dose during the preprocedural cardiac CT scan of 22.4 mSv.
Clinical implications
In experienced centres, the success rate of a percutaneous CTO recanalisation attempt is on average 70%8,14. Knowing beforehand in which patients the chances of success are reasonably high appears to be worthwhile, as it has been shown that a failed recanalisation is associated with a worse outcome and a higher rate of major cardiac events20. The current study shows that CTCA is more precise than CCA for assessing the anatomical features of a CTO. At the cost of a significant additional amount of contrast and radiation, it would not be reasonable to propose a cardiac CT scan before each PCI attempt of a CTO. Instead, a cardiac CT scan seems most useful in patients in whom the angiographic features look unfavourable, or in patients in whom a second PCI attempt is contemplated. The decision whether or not to perform a contrast-enhanced scan after the calcium scoring scan depends on the information one wants to obtain: if the question is to have an idea of the amount of calcium in the occluded segment, a calcium scoring scan might be sufficient considering the fact that most of the radiation exposure derives from the contrast-enhanced scan. Pursuing a “complete scan”, including the administration of contrast, might be preferred in case of a suspected long occlusion, where one aims to obtain information on the 3-dimensional course of the occlusion, including the distribution of calcium. In addition, the contrast and radiation exposure of the patient should become less of an issue in the near future: new scanning protocols are dramatically reducing the radiation dose of a contrast-enhanced scan to less than 3 mSv21 and scheduling the cardiac CT scan at least a few days before the PCI would not increase the risk of contrast nephropathy.
The radiation from a PCI is considerable, but necessary to do the procedure. Good arguments are needed before embarking on a percutaneous recanalisation attempt and this decision process in general should incorporate the symptomatic status of the patient, documentation of myocardial ischaemia and, if possible, data with regard to the pre-procedural chances of success. The latter argument would be in favour of performing a cardiac CT scan in selected cases: patients in whom the CT characteristics of a CTO are unfavourable for PCI might be considered for an alternative therapeutic modality, i.e. medical treatment or bypass surgery.
Limitations of the study
Despite the fact that we failed to provide accurate data for occlusion duration, which is an important marker of procedure failure5, we performed a detailed and selective quantification of the calcium present in the occluded segment, for which occlusion duration is a surrogate marker as shown in a pathological study where fibrocalcific plaque increased with CTO age (p=0.008)22.
Although all the CTCA scans were discussed between the operator and someone trained in interpreting CTCA prior to the interventional procedure, there was no formal documentation of the changes in approach for treating the CTO in light of the CTCA findings. Thus, it was difficult to measure to what extent this knowledge concerning the CTO characteristics by CTCA impacts on the success rate. In order words, a severely calcified and long lesion might have discouraged the operator from a longer attempt.
In case of severe calcifications of the vessel, we relied on angiographic data to determine the length of the occlusion by CTCA. Although a limitation in this study, the repercussion in clinical practice would be minor, as the angiographic data are an essential component of the therapeutic decision process for a given patient. As mentioned in the discussion above, we would only recommend a cardiac CT scan in selected cases to complement the angiographic information.
Conclusion
Evaluation of CTOs by means of CTCA offers a better description of its anatomical features as compared to conventional angiography and predicts procedural success in patients referred for PCI. More specifically, the presence of severe calcification, i.e. calcium occupying >50% of the vessel CSA, as determined by CTCA is an independent predictor of procedural failure. The radiation exposure and amount of contrast used during a PCI attempt is considerable. The judicious use of a preprocedural cardiac CT scan makes sense and might modify the approach in case PCI is attempted or could drive the physician’s preference to an alternative therapeutic modality, i.e. medical treatment or bypass surgery.
