Abstract
Aims: Atherosclerosis is considered both a systemic and focal disease. Current diagnostic tools do not allow adequate in vivo identification and characterisation of lesions. Advanced spectral analysis of IVUS backscatter has displayed the potential for real-time plaque characterisation. The aim of this study is to determine the ex vivo accuracy of automated plaque characterisation by spectral analysis of intravascular ultrasound (IVUS) backscatter.
Methods and results: Plaques (n=184) from 51 coronary arteries were imaged by IVUS. The arteries were then pressure fixed and matching histology collected. Regions were selected from histology and corresponding IVUS data were used to build the plaque classification system using spectral analysis and classification trees. Tissue-maps were validated ex vivo by comparison with histology via 899 selected regions (n=94 plaques) that comprised 471 fibrous tissue (FT), 130 fibro-fatty (FF), 132 necrotic-core (NC) and 156 dense-calcium (DC) regions. The overall predictive accuracies were 93.5% for FT, 94.1% for FF, 95.8% for NC, and 96.7% for DC with sensitivities and specificities ranging from 72% to 99%. The Kappa statistic was calculated to be 0.845 indicating very high agreement with histology.
Conclusions: Automated spectral analysis of IVUS backscatter provides accurate ex vivo information on plaque composition, with considerable potential for assessment of plaque vulnerability in real-time.
Introduction
The prevention of acute coronary syndromes is the primary objective of the treatment of coronary artery disease. Current methods for studying human coronary artery disease, while accepted as the standard-of-care, nonetheless face certain important limitations. Angiography allows for evaluation of the geometry of the unobstructed part of the lumen, but it does not provide adequate information on the structure of the arterial wall itself which is essential to understanding the atherosclerotic process. Unlike angiography, intravascular ultrasound (IVUS) facilitates the demarcation of the three layers of the vessel wall and holds the potential for plaque characterisation. It is generally thought that in standard IVUS grey-scale images, calcified regions of a lesion and dense fibrous components generally reflect ultrasound energy well and thus appear bright and homogeneous. Conversely, regions of low echo-reflectance in IVUS are referred to as “soft” or “mixed” lesions. However, previous studies have shown that discrimination of plaque components from grey-scale IVUS images is inconsistent at best1,2.
Many studies have demonstrated the potential of IVUS based spectral analysis of ultrasound backscatter for discerning lesion components3-7. However, few quantitative histological comparisons or validations exist. Recently, we reported on the ability of IVUS based spectral analysis methodology (or Virtual Histology) to differentiate coronary plaques into four tissue components, and that the classification had predictive accuracies in the range of 79.7 to 92.8%5. However, these studies used preliminary analysis algorithms, were limited to post processing of data, and did not compare plaque morphology directly with the virtual histology (VH) image for validation purposes. Thus, the objective of this study was to determine the ex vivo sensitivity, specificity, and predictive accuracy of VH by direct comparison to corresponding histological sections.
Methods
Subjects
IVUS backscatter data were collected from 51 left anterior descending coronary artery (LAD) samples that were obtained within 24 hours of death. Subjects ranged in age from 35 to 80 years (mean 54±10 years) and comprised 37 males and 14 females (36 white and 15 black). The study sample was limited to those without prior PCI or surgical revascularisations. Additionally, data were not acquired from alcohol or drug abuse cases. The LAD was harvested, as it most often contains significant disease and is the site of most acute coronary events. All studies were IRB approved by the Cleveland Clinic.
Tissue preparation and data acquisition
Human hearts were procured within 24 hours of death, and IVUS data were acquired within 24 hours after excising the LAD. Each artery was dissected from the ostium to the apex, including approximately 40 mm of surrounding fat and myocardial tissue. Inclusion of surrounding tissue ensured the maintenance of proper vessel mechanical support and reduced ultrasound artefacts due to reflections from the tissue-surrounding media interface. The vessels were then submerged in PBS to eliminate all remaining effects of the tissue and air interface on the ultrasound data. The harvested arteries were mounted in a paraffin tray. Ostia were cannulated and side branches were ligated to reduce flow and to maintain physiological perfusion pressure. Constant flow and pressure was ensured with a SmartMap™ pressure wire system (Volcano Corporation, Rancho Cordova, CA, USA) and a computer-controlled air valve system that pressurised a 20 L PBS tank to 100 mmHg. The PBS was delivered within a physiological temperature range, warmed by a heating coil and measured by a thermistor (P/N WM103C, Sensor Scientific, Fairfield, NJ, USA). This imaging system was developed in-house and its usage has been documented and published by our research group8.
IVUS data were acquired with an InVision Plus IVUS console and 20 MHz, 3.5 Fr, phased-array EagleEye™ IVUS catheters (Volcano Corporation, Rancho Cordova, CA, USA). These catheters have an array of 64 ultrasound piezoelectric transducers mounted on a catheter that transmit and receive ultrasound signals multiple times resulting in 512 single scan lines or backscatter signals that span 360° inside an artery to produce one IVUS cross-sectional image. To assess the extent of disease, the IVUS catheter was introduced into the vessel as far distally as possible and manually pulled back until the catheter was back in the introducer. This pullback was used to identify regions of significant disease (approximately > 30% stenosis) which were subsequently imaged. The ultrasound backscatter data representing lesions on the IVUS monitor were digitised (12-bit resolution, 100 MHz sampling rate) in the IVUS system and then transferred and stored to a PC for off-line analysis. This region was then physically located on the vessel with a surgical needle and simultaneously identified on the IVUS monitor. A suture was placed at this location, avoiding any damage to the vessel. This step was performed to ensure an exact location marker when correlating the IVUS data to the corresponding histology section. The procedure was repeated as the catheter was manually advanced toward the proximal end of each vessel, for an average of 3-4 diseased sections per vessel yielding 184 sections from the 51 LAD specimens. Following RF data acquisition, each artery was perfusion fixed with formalin for 6-8 hours at 100 mmHg without changing its orientation. Tissue samples were excised, centred on each suture-marked region by approximately 2 mm on each side, and placed in histology preparation cassettes, maintaining the orientation. The suture remained in the excised section as a marker. The tissue was then processed, embedded in paraffin, and sectioned according to standard laboratory procedures. Multiple sections were collected from each block at the suture and stained with hematoxylin and eosin (H&E) and Movat pentachrome.
VH Images and histology correlation
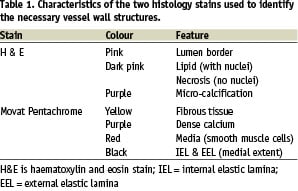
Digital histology images were acquired, 24-bit, full-colour, at 2.5x magnification using a Leica DMRXA2 motorised microscope (Leica Microsystems AG, Wetzlar, Germany) and a Spot RT colour camera controlled via the Spot Advanced software (version 3.4.2, Diagnostic Instruments, Sterling Heights, MI, USA). The resolution of the microscope and camera is at least an order of magnitude higher than the resolution of IVUS and is therefore a good “gold standard.” Table 1 outlines how each stained section was interpreted to identify various plaque components.
Histology was reviewed by one author, who was blinded to the VH analysis.
IVUS grey-scale images were reconstructed from the backscatter ultrasound data. For each IVUS grey-scale image, a corresponding histology section was selected that best matched the surrounding tissue layout, such as side branches, orientation of myocardium, veins etc. and the shape of plaque (eccentric or concentric).
The corresponding digitised histology sections were morphed to maintain correspondence in orientation with its IVUS counterpart. Previously described software, developed in-house, was used to perform this operation8. The VH plaque tissue classification scheme was developed using these data by spectral analysis and automated data normalisation as described recently by our group5,9. Briefly, the Movat pentachrome stained and morphed histology images were used to very carefully select region of interest (ROI) that represented only one of four plaque components (Figure 1) – fibrous tissue, fibro-fatty, necrotic core, and dense calcium.
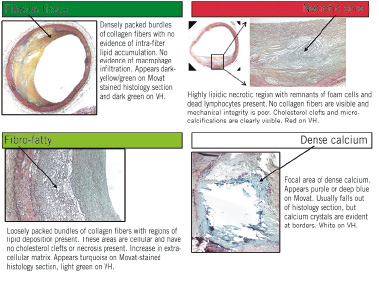
Figure 1. Virtual histology (VH) plaque component descriptions. Data from Movat pentachrome stained histology sections are selected to represent one of these four homogeneous tissue types found in atherosclerotic plaques that are of interest to interventional cardiologists. In VH images, dark green is fibrous tissue, light green is fibro-fatty, red is necrotic core, and white is dense calcium.
The corresponding regions were highlighted on the reconstructed IVUS grey-scale images, and the original ultrasound data samples representing those ROI were retrieved from the ultrasound backscatter (Figure 2).
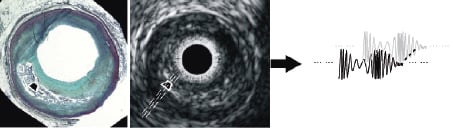
Figure 2. Movat pentachrome stained histology section (left) and IVUS image (middle) with ultrasound backscatter data (right). A representative homogenous region of interest is indicated by the white box marked on each image. Spectral analysis of the backscatter data from such regions was used to build the database of spectral parameters for plaque characterisation.
The ROI selection process was not limited to any particular distance in each plaque; rather they were chosen at various distances within the plaque from the centre of the vessel lumen. These regions were 32 data samples in length (approximately 246 µm), and 28±9 scan lines in width (512 scan lines span 360°) and were used only for development of the VH algorithm. Figure 2 schematically illustrates ROI selection and retrieval of the backscatter data representing an ROI. The ultrasound data for each ROI were extracted for the four plaque components and spectral analysis was performed via the improved automated algorithms recently developed by our group9,10. Eight variables or spectral parameters were used in the VH classification scheme (maximum power, frequency at maximum power, minimum power, frequency at minimum power, slope, intercept, mid-band fit and the integrated backscatter). The resulting classification scheme was used to calculate VH images for all IVUS data that had been matched to corresponding histology sections. The VH tissue maps were coloured by raster scanning with an analysis window size of a fixed width (32 ultrasound data samples ≈ 246 µm).
VH ex vivo accuracy assessment
The VH algorithm accuracy was previously determined by testing on a subset of the ROI used in construction of the spectral analysis classification algorithm5. Such validation is only representative of the accuracy of the classification scheme based on the homogeneity of these regions. Plaques are very heterogeneous by nature and dividing a plaque into four tissue components is difficult due to the amorphous overlap of the tissue components (Figure 3).
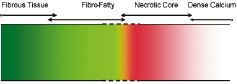
Figure 3. Virtual histology tissue spectrum is indicative of disease progression and illustrates the possible overlap zones between the four plaque component types used in this study; fibrous tissue, fibro-fatty, necrotic core, and dense calcium.
Such cautiously selected ‘homogeneous’ ROI are useful for studying ultrasound backscatter spectral characteristics to build a tissue classification scheme. However, they should not be used to assess the validity of the algorithm since the spectral analysis is applied to the entire ultrasound image, not just the areas with one tissue component. Hence, a different validation procedure, which is more suitable to the heterogeneous nature of the atherosclerotic disease process, was employed in the present study.
The colour-coded VH tissue maps derived from the spectral analysis and classification scheme were paired with the corresponding matched histology sections. Three experts were engaged in the task of systematically and quantitatively dividing each image pair into numerous regions that were individually assessed for accuracy. The process is outlined as follows (Figure 4):
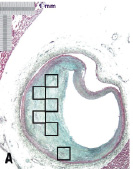
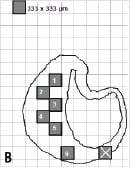
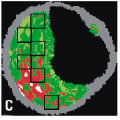
Figure 4. Region of interest (ROI) selection for ex vivo accuracy assessment. Three experts were engaged in the separate tasks of (B) drawing histology image outlines on transparent paper with a grid of 1/3x1/3 mm regions and highlighting alternating regions; (C) finding matching regions on corresponding VH images and interpreting the VH outcome in each ROI; and finally (A) interpreting the pathology outcome in all ROI. The experts were blinded to each others’ results.
Step 1: The first expert was provided printouts of the Movat pentachrome histology images digitised at 2.5x and transparent papers with a grid printed on them. The grid was of squares 1/3x1/3 mm in dimension. Healthy media in coronary arteries is about 300-500 µm and plaque thickness less than that is not considered pathological. Therefore, histology images were broken into square regions of approximately 330 µm in length and width to assess VH ex vivo accuracy. A transparent paper with the grid was overlaid on each histology printout and the plaque outline was sketched on it. Alternating grid boxes that fit within the plaque outline were then selected as the ROI for accuracy assessment. Plaques that were not thick enough to include at least one complete grid box were excluded from the study. The first expert was blinded to the pathology and the VH results.
Step 2: The second expert was asked to compare the transparent papers, with the histology outlines and square ROI drawn on the grid, to corresponding VH images. A matching region was identified on the VH images for each 1/3x1/3 mm ROI on the histology image outlines. ROI that could not be matched were excluded from the study. The expert was then asked to determine the tissue type in the ROI on the VH images. If multiple VH colours were present within any ROI, the tissue type with the maximum pixels within that ROI was selected as the VH result for that ROI. For example, if an ROI consisted of less white (dense calcium) and more light green (fibro-fatty), it was listed as a fibro-fatty region. This expert was blinded to the true pathology of each ROI.
Step 3: The last expert was asked to determine the pathology of each ROI from the histology outlines by examining the original histology slides. This expert was blinded to the VH results including the assessment of the second expert. Hence, the truth for each ROI was determined by the third expert and the VH outcome was determined by the second expert. A truth-table was constructed with the outcome of all regions broken into the four plaque components of interest: fibrous tissue, fibro-fatty, necrotic core and dense calcium. Figure 4 illustrates the procedure of ROI selection in accuracy assessment.
Statistical analyses
Statistical analyses consisted of calculating various measures of accuracy for each VH plaque component from the truth-table. Sensitivity, specificity and predictive accuracy were calculated for the four VH plaque types using standard formulae commonly accepted in medical literature11.
(1)
(2)
(3)
Data were not considered to be clustered and each ROI was treated as an independent data point even though each artery yielded multiple sections which then yielded multiple ROI. Confidence intervals were calculated for sensitivity and specificity for each tissue component based on conventional formulae assuming independent data points.
(4)
where X is either the sensitivity or specificity and N is the number of decisions used in the denominator for calculating the sensitivity or specificity.
In addition to the above measures of accuracy, the validity of the overall VH algorithm was tested ex vivo by calculating the Kappa statistic  as a measure of agreement between the ROI on VH images and corresponding histology interpretation. This metric was originally proposed by Cohen to determine the level of agreement between two observers12. It is calculated as:
(5)

where  is the observed proportion of agreement and
  is the expected proportion of agreement resulting from chance. Kappa has since been used widely in medical literature for assessing agreement between observers and in testing diagnostic tools against the truth. The measure should fall between 0 and 1 and has been interpreted differently by various groups but most concur that a test result of 0 indicates low agreement (i.e., low VH accuracy) and a test with 0.75 <
  > 1 would indicate a very high level of agreement (i.e., high VH accuracy)13. One important attribute is that Kappa is useful in correcting for agreements that result from chance13. Another attractive quality is that while conventional sensitivity, specificity and predictive accuracy are widely recognised as standards of accuracy in diagnostic tools for a two outcome disease (for e.g., benign or malignant, in case of diagnosing tumours), they are not well defined for multiple outcome tools, such as VH. VH currently has four outcomes of tissue types and a misclassification of necrotic core as fibro-fatty might not have the same importance as a misclassification of fibrous tissue with necrotic core. Also, tests like specificity and predictive accuracy are heavily affected by prevalence of a particular disease, where as Kappa could be interpreted to be less dependent on disease prevalence. Both forms of accuracy were reported in this study to reduce bias in results.
Results
VH image and histology correlation
These qualitative analyses yielded conclusive results on comparing multiple 4 µm thick histology images to approximately 300 µm thick VH images. Of the 184 sections imaged, 115 sections were well matched between histology and IVUS data using information from surrounding tissue and plaque shape. The remaining 69 sections were excluded from the study. Of the 115 lesions that were used for accuracy assessment, a further 17 lesions were excluded by the first expert since the level of stenosis was below the perceived 30% required for inclusion in the study. A square of 1/3x1/3 mm could not be fitted on the grid overlaid on any of these 17 lesions.
VH ex vivo accuracy assessment
The VH ex vivo accuracy assessment was dependent on the truth table constructed as a result of the second and third experts’ interpretation of ROI on VH images and corresponding histology slides, respectively. Another four sections were further excluded from the study at this stage by the second expert since the ROI from these histology outlines could not be reasonably located on the VH images. The remaining 94 lesions yielded a total of 947 ROI that were 1/3x1/3 mm in dimension. The corresponding ROI were located on VH images and interpreted by the second expert. Of the 947 ROI used by the second expert, 58 ROI were then excluded by the third expert. The grid overlay on the histology images for these 58 ROI indicated areas that were damaged due to histology processing
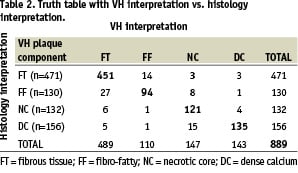
and hence could not be classified as any particular tissue. The final tally after all exclusion criteria were met was: 94 lesions with 889 ROI, comprising fibrous tissue (n=471), fibro-fatty (n=130), necrotic core (n=132) and dense calcium (n=156) as interpreted from histology by the third expert.
The VH and histology interpretation of the 889 ROI are reported in Table 2.
The sensitivity, specificity and predictive accuracy of each plaque component are listed in Table 3.
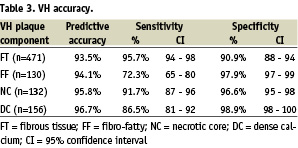
VH characterised atherosclerotic plaque with combined predictive accuracy > 93% for all four VH plaque components and at very high sensitivities (72-96%) and specificities (91-99%). The Kappa statistic of this VH algorithm was calculated to be 0.845 indicating extremely high agreement with histology13.
Discussion
The validation results in this study demonstrate that VH images provide > 90% accurate information on the composition of atheromas. The VH classification system in this study was built with data acquired from 51 LAD of varying stenosis and composition. Atherosclerosis is a complex disease and is heterogeneous in composition at all stages of development. The lesions were reviewed by an expert and certain ROI in those lesions were divided into four important categories that can together define various types of plaques. Therefore, the current VH images are a representation of these four tissue types – fibrous tissue, fibro-fatty, necrotic core and dense calcium. Figure 3 illustrates the overlap between these plaque components highlighting the possible source(s) of inaccuracy in VH. Areas of fibrous tissue and fibro-fatty tissue could overlap in VH images with progression of disease between these two components. Similarly, overlap could be observed between necrotic core and dense calcium which is expected from their natural association (see definitions in Figure 1). Such overlap is demonstrated in the truth table (Table 2). As few as 3% of fibrous tissue ROI were misclassified as fibro-fatty, and as many as 29% of fibro-fatty were misclassified as fibrous tissue. This is indicative of higher specificity of fibro-fatty and lower specificity of fibrous tissue. Plaques are generally fibrous in nature and as such the ROI used to build the VH algorithm are also possibly influenced by a bias towards fibrous tissue. This fact, due to prevalence of a certain plaque component, might tend to affect the accuracy metrics. In addition, medical literature currently lacks a statistical measure that can easily be applied to assess diagnostic tools with multiple (> 2) outcomes. Therefore, it is prudent to report the entire truth table in addition to surmising accuracies from it. The Kappa statistic is a single metric that attempts to combine all the aspects of a truth table for simpler evaluation of a diagnostic tool. Although  =0.845 well represents the high accuracy of the algorithm, individual sensitivities and specificities are important to judge a plaque characterisation tool to justify its usage in plaque regression and progression studies where the focus may be to study changes in certain plaque components only in response to certain drugs. Therefore, validation metrics using unbiased ROI selection are important (Figure 5).
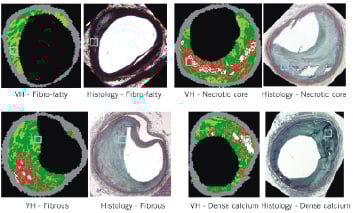
Figure 5. Four examples of region of interest (ROI) selected on Movat pentachrome histology slides and their interpretation compared to virtual histology (VH) images. (A) Illustrates fibro-fatty, (B) necrotic core, (C) fibrous tissue and (D) calcified region, all marked by the blue box.
Another approach to address these issues might be to eliminate the ROI selection process and any human biases associated with it by comparing the entire VH image and its attributes to corresponding histology images. Efforts are ongoing to classify the entire two-dimensional image as one plaque type (for e.g., TCFA or fibroatheroma) and compare with serial sectioned histology to assess lesion accuracy with VH. The present study provides an ex vivo validation of VH as assessed by single two-dimensional lesions and by comparing truth from 4 µm histology data to approximately 300 µm thick IVUS data. Care should be exercised in interpreting these results in relation to three-dimensional volumetric data acquired in vivo. Three-dimensional in vivo validations are still ongoing and there are only a few studies that currently exist with histology comparisons14-17. That said, the VH software provides interventional cardiologists with a pan-arterial approach to investigate total artery plaque burden and individual plaque component volumes or detailed view of a focal three-dimensional ROI with plaque composition in real-time; information thus far unavailable in the catheterisation laboratories.
Potential for identification of vulnerable plaques
A recent study by Glaser et al determined that as many as 5.8% of PCI patients will undergo non-culprit lesion progression requiring further PCI on the non-target lesion within the first year of the initial procedure; indicating new lesion instability18. Hence, the potentially unstable, but non-culprit lesions should also be identified and/or treated during initial PCI or with more efficient systemic therapy to prevent future events. The lesions that harbour these plaques are frequently only mildly stenotic on angiographic examination. Identification of plaques that have a high likelihood of causing clinical events will undoubtedly create new opportunities for treatment before the onset of acute ischaemic syndromes. Systemic stabilisation of arteries is increasingly becoming the theme in interventions even for patients with acute MI19 and VH allows improved interpretation of the disease in the entire artery with volumetric data of the individual VH plaque components. This unique facet could also enable plaque regression or progression studies and facilitate the evaluation of systemic therapies.
The identification of the at-risk non-critical lesions is dependent on the interpretation of each VH image. The current perspective of experts on vulnerable plaques suggests that plaques prone to rupture are not the only vulnerable plaques20. These could vary in description and be identified as the typical large lipid-necrotic core with thin fibrous cap, or the sub-occlusive thrombus with early organisation, or the proteoglycan matrix in smooth muscle cell-rich plaque, or intra-plaque haemorrhage, or the calcified nodule close to the lumen, and finally the chronically stenotic plaque with dense calcium, organised thrombus and an eccentric lumen20. All of these plaque descriptions can be recognised by an interventional cardiologist viewing VH images with the four plaque components and their relevant location within the plaques (exception is the detection of early or organising intra-luminal thrombus, which is currently excluded) as was recently described by Rodriguez-Granillo et al16. Thus, techniques such as VH have tremendous potential to gain clinical importance in the assessment of plaque vulnerability. This might require certain level of training and further understanding of VH in relation to clinical end-points, yet is a huge leap from grey-scale ultrasound that limits plaque-composition to guess-work.
Study limitations
The window size currently applied for selection of ROI and eventual tissue map or VH image reconstructions is approximately 246 µm in the radial direction. Therefore, detection of a thin fibrous cap < 65 µm in thickness21,22, is below the resolution of IVUS and detection by VH is compromised. This may restrict the identification of some vulnerable atheromas. However, the sensitivity of detecting necrotic core is 92% (Table 3) which bodes well for detection of TCFA since its definition includes a necrotic core > 40% of the total plaque volume in addition to the thin fibrous cap21. Similarly, in vessel wall sections with a low extent of disease, plaque classification depends on analysis of RF data spanning < 246 µm and could cause errors in the predictions. However, results from a recent study by Rodriguez-Granillo et al are encouraging where TCFA identified with VH were well correlated to positive remodelling16. Efforts are under way to improve VH and make full use of resolutions possible with commercially available IVUS systems (100 - 150 µm)23. Exploring advanced spectral analysis techniques and refining ultrasound data post-processing to enhance compensation for attenuation due to intervening tissue are some such improvements.
Another limitation of the current VH algorithm is the lack of identification of early or organised thrombus which also limits the recognition of certain at-risk plaques. However, the high accuracy observed with VH with the four plaque components has established the value of spectral analysis and statistical classification trees. Endeavours are being made to study thrombus formation for subsequent inclusion in the VH family of plaque components.
Conclusion
VH was tested ex vivo to provide accurate (93-97%) information on plaque composition. VH has considerable potential for assessment of plaque vulnerability by interrogating the entire length of the artery. It could assist in stent deployment, evaluation of systemic therapies, and provide crucial information in real-time on target lesions. This technique also has the promise to enable prospective patient outcome studies, thus far impossible, due to lack of commercially available plaque characterisation techniques.
Acknowledgements
This study was partially funded by the NIH RO1HL64686 (DGV - PI). In addition, the authors would like to thank scientists and engineers at Volcano Corporation, Rancho Cordova, California, for invaluable support with software development and graduate student Meghna Sareen from Case Western Reserve University, Cleveland, Ohio, for help with data acquisition. Discussions with Dr. Nancy Obuchowski in the department of Quantitative Health Sciences at Cleveland Clinic were very important in guiding the statistical analyses employed in this study. Lastly, Ms. Christine Kassuba, from the department of Biomedical Engineering, at Cleveland Clinic, provided useful editorial assistance.