Abstract
Aims: To develop a novel dedicated quantitative coronary analysis (QCA) for bifurcations.
Method and results: A dedicated software that has minimal user interaction so as to increase the QCA results reproducibility. The new CAAS 5 bifurcation software combines established algorithm for contour detection with novel ways to determine the lesion characteristics together with the angulation of the bifurcation.
Conclusion: The paper describes how this methodology is accomplished and reported.
Introduction
Coronary lesions located in a major bifurcation constitute a challenge for interventional cardiology1. It is associated with a higher rate of complications and increased restenotic rates2. Specific risks include plaque shifting to the side branch that can result in side branch occlusion during the main vessel percutaneous coronary intervention (PCI)3. In recent years, drug eluting stents have allowed the use of several two stent techniques to refashion the architecture at the bifurcation with better results achieved following kissing balloon post dilatation4. But it is debatable whether such complex remodelling offers an advantage over a provisional one stent approach5. As such, a number of dedicated devices for stenting of bifurcation lesions are being developed and introduced6. The methodology used to assess the efficacy of bifurcation stenting7 is also contentious. This is because standard quantitative coronary analysis (QCA) software was developed for the analysis of single lesions in “straight” vessels and must be enhanced to include the bifurcation8,9. There are several limitations with this approach that are related to the degree of vessel tapering within the bifurcation and in defining the true reference vessel size of both the main vessel and the side branch. As a result there is a need for dedicated programs to analyse and report the angiographic results of the bifurcation lesion that in addition to obtaining a correct and reproducible reference diameter, includes measurement of the bifurcation angles and characterisation of the bifurcation type so as to further support a treatment choice. In this communication, we describe a novel methodology for reporting bifurcation using a new version of the CAAS 5 software (Pie Medical Imaging, Maastricht, The Netherlands).
Determining the QCA at a bifurcation
The definition of a bifurcation is the subdivision of an artery into two arteries. When attempting to use conventional QCA software over a bifurcation the reference vessel diameter, i.e. the vessel’s estimated healthy diameter, will be based on an interpolation of the vessel’s “normal” part before and after the bifurcation. Frequently commercially available QCA methods have the possibility to indicate a position in the vessel’s segment with the diameter that will serve as the user-defined reference. But this reference diameter will only be valid on the side of the bifurcation where the user defined the reference and does not necessarily translate to the other constituent vessels at the bifurcation. Furthermore, the user dependency of the positioning of the reference makes this method less reproducible and in ostial lesions, a proximal reference diameter cannot be determined. The tapering of the vessel means that the proximal reference diameter and percentage diameter reduction of lesions proximal to the bifurcation will be underestimated, while those distally will be overestimated.
In an attempt to overcome these limitations, a recent evaluation of a bifurcation package (QVA-CMS® V6.0, Medis, Leiden, The Netherlands) divided the bifurcation in three parts, each of which conventional QCA can be applied10. To solve the reference problem the central bifurcation area was eliminated from the reference calculations. In this case the diameter and reference definition within the central bifurcation area isn’t taken fully into consideration. A different approach is undertaken in the CAAS 5 bifurcation software (CAAS 5, Pie Medical Imaging, Maastricht, the Netherlands) where the bifurcated vessel is considered to be a single entity, including the central bifurcation area. divided in 10 segments when stented (Figure 1).
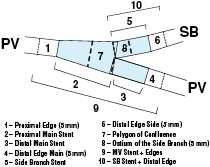
Figure 1. The 10 segments definition post stenting
In this analysis, the segments 1, 4 and 6 are 5 mm beyond the stent edge. The main vessel stent is divided at the carina as that proximal and distal corresponding to segments 2 and 3 respectively, with the side branch stent confined to segment 5. The central portion, segment 7 is an independent region called the Polygon of Confluence (POC) that is unique to the bifurcation and represents a new quantification modality. Segment 8 is an ostial region of side branch including 5 mm distal from the end of bifurcation.
CAAS 5 QCA bifurcation methodology
The CAAS 5 quantitative analysis of bifurcations can be separated in six key steps. These consist of
– contour detection of the involved vessel segments including the bifurcation segment,
– constructing the centreline and defining the Point of Bifurcation (POB),
– defining the Polygon of Confluence (POC),
– the diameters and references,
– calculating the angles between the branches, and finally,
– generating an analysis report.
Contour detection
This is performed in a semi-automated process employing either a manually drawn initial pathline, or three user-defined points - one at the proximal side of the main vessel and two at both distal ends of the bifurcated branches. The algorithm automatically calculates path lines using a wave propagation algorithm11, and the contours using the well-known minimal cost algorithm (MCA) that is based on the differences in the local grey scale and densitometry12. The software assumes the bifurcated vessel is a single object delineated by a left, middle and right contour, specifically making no further assumptions (Figure 2).
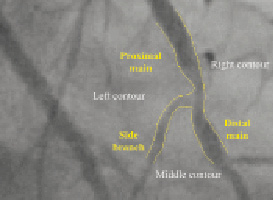
Figure 2. The bifurcation is treated as a single object delineated by three contours
Constructing the Point of Bifurcation (POB)
The Point of Bifurcation (POB) is defined as the point where all the centrelines meet; the centrelines being the lines through the middle of the vessel. The POB is defined as the midpoint of the largest circle that can be fitted in the bifurcation area, touching all three contours (Figure 3).
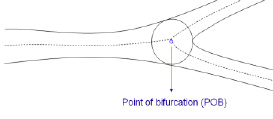
Figure 3. Centrelines splitting at the Point of Bifurcation
The intersections between this circle and the centrelines identify the start and end positions of the bifurcation region (Figure 4), the boundaries of a new measurement entity the Polygon of Confluence (POC) (Figure 5).
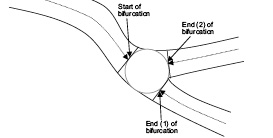
Figure 4. The bifurcation boundaries
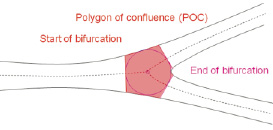
Figure 5. The Polygon Of Confluence [POC]
The Polygon of Confluence (POC)
The Polygon of Confluence (POC) represents the smallest possible independent region that behaves differently from a single vessel segment. It is defined on the 2D radiographic image as the area or region that encompasses the start and the end of the bifurcation region. Regions outside of the POC behave similar to single vessels in classic QCA. The polygon shape is created by connecting begin and end boundaries of the POC by the luminal borders of the vessel. Depending on the type of bifurcation it can have different shapes, such as a pentagon (Figure 5).
The plaque area can be evaluated against the actual luminal area or volume to give the percentage area or volume stenosis as a single value for the POC after reconstruction the vessel to its healthy situation as described in the next step. Furthermore the absolute POC area can be compared between pre-, post- and follow-up in clinical studies as a measure for procedural success.
Determining diameter and reference values within the bifurcation
In addition to having a single value to evaluate the POC, traditional diameter measurements can also be obtained. But unlike the branches, where the diameter measurements are determined by the distance between left and right border, it is not straightforward inside the POC. In order to derive such data within the POC the “Minimum Freedom” approach must be employed. In this approach shortest distances between a centreline point and the boundaries are determined, and the distance between these points used as best estimate for the diameter within the POC for that location along the centreline. The minimum luminal diameter (MLD) at the bifurcation can be found using this approach by walking through points along the termini of the bifurcation to the centre point within the polygon of confluence (Figure 6).
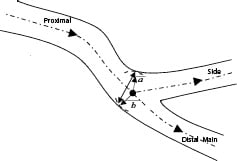
Figure 6. Determining the diameter within the bifurcation at the POC
The reference diameter outside the POC is determined from the edges of the ‘healthy’ part of the vessel. It is based only on the characteristics of the branch itself as in the CAAS single vessel software. Using edges derived from these references the reference inside the POC can be interpolated by means of a novel curvature based interpolation technique. This method assumes that at the bifurcation blood flows smoothly from the proximal vessel to the two distal vessels and that the curvature at the POC is constant (Figure 7).
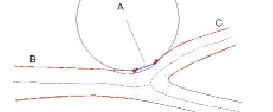
Figure 7. Modelling a part of a vessel by an annulus
Determining the bifurcation angulation
For the calculation of the angles between the arterial branches, a novel method is used which is scalable and reproducible. It employs lines derived from the circle used for the definition of the “POC”. The intersection positions of the circle with the centrelines are used as the centres for new circles (Figure 8).
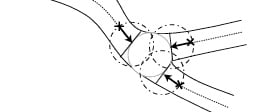
Figure 8. The bifurcation boundaries and angulation
These new circles have the same radius as the circle within the “POC” and are not dependent on the mean vessel diameter of the specific branch. The intersections of these new circles with the centrelines, depicted by the dots and crosses in Figure 8, create the lines for measuring the bifurcation angulation.
Generating the Report
The format and contents of the report has to be tailored to its application, such as the online guidance during treatment of bifurcated lesions versus the use for clinical research in a core laboratory (core lab) facility (Figure 9).
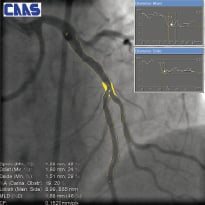
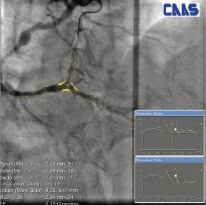
Figure 9. Two examples of on-screen reports
To facilitate this, different versions of the bifurcation analysis software are available for clinical and core lab use. Available analysis methods include automatic reference obstruction analysis, local reference analysis, user defined subsegments as well as the 10 segmental analysis method to analyse the stented bifurcations, post-procedure and at follow-up.
In general the following approach is adopted.
1. Preliminary results relevant for guidance during treatment are shown immediately on-screen. The most relevant results are shown for the current analysis method.
2. For each of these methods one or more detailed report pages are selectable, targeted at use for clinical research.
3. The results can be saved as an XML report or DICOM Structured Report, allowing open standardised reporting and archival of measurement data. This also allows for user customisable reports.
4. The new measure, yielding a single value for the Polygon of Confluence (POC), making zero assumptions about the division of flow, is reported. The percentage area stenosis within the POC is represented by a single value calculated as the ratio of the actual luminal area of the POC, divided by the reference area of the POC. (Figure 10)
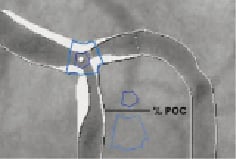
Figure 10. Calculating the percentage area stenosis with the POC.
5. After contour detection the Minimum Luminal Diameters (MLDs) and percentage diameter stenosis for each of the three branches are immediately reported so as to assist in classification of the bifurcation, for example into the Medina classification method.
6. The angle between the proximal main and the side-branch, and the angle between the distal-main and the side-branch are reported.
7. Referring to the laws of Murray and Finet that describe the relationship expected between the diameters of the branches in a healthy bifurcation a conformance score is produced for the bifurcated artery under investigation. For Murray’s law this score is defined as CMurray=(Dprox3/[Ddistmain3+Dside3])1/3, while for Finet’s law as CFinet=Dprox / 0,66.(Ddistmain+Dside). This conformance score is calculated for both the actual luminal diameters at the ostia of the three branches, as well as for the reference diameters at these positions.
8. A user definable Lesion Position Indicator [LPI] is initially positioned at the largest relative stenosis. This indicator can be arbitrarily moved by the operator throughout the main and side branch. At the user defined position the luminal diameter and reference diameter are reported for this indicator.
Discussion
In percutaneous coronary intervention, quantitative coronary angiography (QCA) is universally employed as a means to determine the efficacy of a stent or as a surrogate endpoint to clinical events. This methodology is efficient in analysis lesions in ‘straight’ vessels, but is incapable of accurately analysing bifurcation due to tapering of the vessel. The overestimation of distal lesions and overestimation of proximal lesions based on extrapolating the vessel diameter using current QCA analysis of bifurcations can lead to inappropriate device selection and stent deployment. It is therefore imperative to have dedicated QCA software aimed specifically at analysing bifurcations that takes into account the changing aspects of the vessel morphology but also able to give additional information about the lesion characteristics. In the new CAAS 5 bifurcation software, the entire bifurcation with its main vessel and side branches are analysed as a single entity. The analysis is completely automated once the operator has either manually drawn an initial pathline, or depicted three user-defined points. The system utilises the established wave propagation algorithm to create the pathline if not defined and the proven minimal cost algorithm for contour detection. By adopting the multi-segmentation model to define the fragments around the bifurcation a more accurate representation of the position of the lesion can be determined. This also enables a new entity the polygon of confluence (POC) to be defined which theoretically can be used as a novel reference entity. In all cases, simple and consistent definitions are used for determining the MLD and RVD based on the shortest distances between a centreline point and the vessel boundaries. The reference vessel diameters are derived from the vessel’s healthy region, and in the POC the reference is derived with a novel curvature based interpolation technique utilising principles of fluid dynamics. The importance of the bifurcation angulation in prognosis means, that as realised with QCA, an increase precision will be desirable in the future. This is taken into account in the CAAS 5 bifurcation software, where a scalable and reproducible assessment of bifurcation angles is determined in a novel approach.
Conclusion
The creation of the new dedicated CAAS 5 bifurcation software aims to circumvent some of the current limitations in adopting conventional QCA methodology to bifurcations. It combines established algorithm for contour detection with novel ways to determine the lesion characteristics and the angulation at the bifurcation. The minimal user interaction in the selection and processing of the coronary segments means that this methodology can potentially offer a greater degree of reproducibility in the QCA measurements.