Abstract
Background: Despite its high prevalence and major prognostic implications, coronary microvascular disease (CMD) is frequently underdiagnosed owing to the complexity and invasiveness of current diagnostic procedures.
Aims: This study aimed to introduce and validate the usefulness of a non-invasive index of microcirculatory resistance (IMR) derived from coronary computed tomography angiography (CCTA), called IMRCT, for accurate diagnosis of CMD.
Methods: This retrospective cohort study comprised consecutive patients referred for invasive coronary functional assessments who underwent CCTA within the 30 days preceding an invasive evaluation between January 2022 and March 2024. IMRCT was calculated by blinded evaluators and compared against invasively determined IMR, with IMR values ≥25 indicating CMD, to assess its diagnostic performance.
Results: A total of 176 patients (216 vessels) were included in the analysis. IMRCT showed good correlation with invasively measured IMR, both at the vessel level (r=0.71, 95% confidence interval [CI]: 0.62-0.76; p<0.001) and the patient level (r=0.72, 95% CI: 0.64-0.78; p<0.001). At the vessel level, diagnostic accuracy, sensitivity, specificity, and area under the curve were 81.9%, 80.8%, 82.5%, and 0.82, respectively; corresponding values at the patient level were 80.7%, 81.5%, 80.2%, and 0.81. In patients with non-obstructive coronary artery disease defined by CCTA stenosis <50%, coronary angiogram stenosis <50%, or fractional flow reserve>0.8, IMRCT reduced underdiagnosis rates from 38.8%, 35.3%, and 36.3% to 4.5%, 5.9%, and 5.6%, respectively.
Conclusions: IMRCT serves as a valuable complement to current diagnostic approaches, addressing their limitations and offering a promising alternative for the diagnosis of CMD, with the potential to significantly reduce misdiagnosis rates.
Coronary microvascular disease (CMD) represents a clinical condition of myocardial ischaemia resulting from structural and/or functional changes in the coronary microcirculation1. Since the pioneering report by Likoff et al on myocardial ischaemia caused by non-obstructive coronary artery disease (CAD)2, the diagnostic challenges of CMD have become increasingly recognised. Recent studies have demonstrated that up to 60.7% of patients with positive stress tests but non-obstructive CAD have underlying CMD when assessed by the invasive index of microcirculatory resistance (IMR)3, highlighting a critical gap in current diagnostic approaches.
Unlike obstructive CAD, which is readily identified through anatomical imaging, CMD remains underdiagnosed because of the lack of reliable non-invasive tools4. Non-invasive functional tests, including stress echocardiography, positron emission tomography (PET), and cardiac magnetic resonance imaging (MRI), face significant limitations in the comprehensive assessment of coronary microvascular disease5. Although PET provides quantitative measurements of myocardial blood flow, its widespread use is hindered by high cost and limited availability. Cardiac MRI, despite offering high spatial resolution, cannot definitively exclude the presence of multivessel epicardial disease. Furthermore, stress echocardiography exhibits operator-dependent variability when assessing coronary flow velocity reserve, which may affect the reproducibility and accuracy of the results.
Although invasive IMR measurements based on thermodilution techniques can effectively diagnose CMD678, their clinical adoption remains limited by procedural risks, costs, and the need for hyperaemic agents. This diagnostic dilemma highlights the urgent need for accurate, non-invasive alternatives to assess coronary microvascular function.
Coronary computed tomography angiography (CCTA) is increasingly recognised for its potential to evaluate microvascular dysfunction through combined anatomical and functional assessment. Recent evidence shows that structural CMD is associated with a 40% reduction in epicardial lumen volume compared to controls (p<0.001), with strong correlation to invasive microvascular resistance measurements (r=−0.59) and good diagnostic performance (area under the curve [AUC] 0.79)9. Significant progress has also been made in applying computational fluid dynamics (CFD) to non-invasive physiological assessment of the coronary circulation, further supporting the feasibility of this integrated approach101112. Building on these advancements, we propose an optimised CCTA-based IMR (IMRCT) measurement method for microvascular evaluation using standard CCTA technology. This approach addresses key limitations of current diagnostic strategies by enabling comprehensive coronary assessment within a single widely available imaging modality.
Methods
Study design and population
The study population consisted of consecutive patients retrospectively selected from an academic medical centre between 1 January 2022 and 31 March 2024. The study received ethical approval from the medical ethics review committee (approval number: B KY2024173) and was conducted following the principles of the Declaration of Helsinki. Informed consent was waived by the institutional review board for this retrospective analysis of fully anonymised clinical data, which posed no risk to participants.
Patients who met both of the following criteria were included: (1) successful completion of invasive intracoronary functional assessment for suspected myocardial ischaemia, and (2) availability of CCTA imaging performed within 30 days preceding the invasive procedure. Patients were excluded if they had (1) acute myocardial infarction, (2) incomplete or poor-quality image data, or (3) a history of previous coronary stent implantation or coronary artery bypass grafting.
CCTA imaging acquisition
The CCTA protocol adhered to the Society of Cardiovascular Computed Tomography 2021 guidelines13, using retrospective gating tailored to patient-specific factors such as weight and heart rate/rhythm (voltage 80-120 kV; current 100-350 mA). Imaging covered the coronary arteries, left ventricle, and proximal ascending aorta, achieving optimal resolution and speed with a 0.25 s gantry rotation and 0.6 mm collimation. High-concentration iodine contrast (50-55 mL; 350-370 mg I/mL) was injected at 5.5-6.0 mL/s, optimised for peak enhancement. Slice thickness was set to 0.6 mm; the Bv45 kernel and Advanced Modeled Iterative Reconstruction (ADMIRE [Siemens Healthineers]) algorithm were used for noise reduction and artefact minimisation, respectively. CCTA was performed using a second-generation dual-source computed tomography (CT) system (SOMATOM Definition Flash [Siemens Healthineers]).
Intracoronary functional assessment
Coronary angiography was performed using Innova IGS 5 (GE HealthCare). Intracoronary functional measurements were obtained using a non-side hole catheter (6-7 Fr) and a PressureWire X Guidewire (C12009 [Abbott Medical]) equipped with a pressure and temperature sensor, along with a RadiAnalyzer Xpress (St. Jude Medical). The procedures were conducted using established protocols14.
Before the functional test, 50-200 μg of nitroglycerine was injected. Resting and hyperaemic curves were obtained using three 3 mL saline injections; if the transit time varied by >30%, additional injections were administered until stable measurements were obtained. Maximal hyperaemia was maintained by the continuous infusion of adenosine triphosphate (140-180 μg/kg/min) via a peripheral vein, with simultaneous pressure monitoring. The fractional flow reserve (FFR) was determined as the ratio of distal coronary pressure to aortic pressure during hyperaemia. Coronary flow reserve (CFR) was calculated as the ratio of the mean transit time (Tmn) at rest to the mean transit time during hyperaemia. The IMR was determined as the product of distal coronary pressure and the hyperaemic mean transit time. An FFR ≤0.80, a CFR <2.0, and an IMR ≥25 were considered abnormal15. When FFR was ≤0.80, the IMR values were corrected using Yong’s formula16.
Estimation of IMRCT based on CCTA
The IMRCT calculation method was developed by the Health Information Intelligent Computing Laboratory at the School of Biomedical Engineering, Sun Yat-sen University, Shenzhen, China (Figure 1, Supplementary Figure 1, Supplementary Figure 2). The lab received only CCTA and clinical data without the results of invasive measurements. The lab segmented and reconstructed the coronary arteries, while the clinical centre marked the positions on the reconstructed model based on invasive measurements from coronary angiography.
This method estimates hyperaemic coronary blood flow (CBF) directly from vascular deformation extracted from multiphase CCTA data. Specifically, vascular deformations for each segment were automatically extracted, and inverse problem-solving techniques were applied to implicitly derive CBF. These techniques were based on physical constraints governing the relationship between vascular deformation and coronary blood flow. Segment-specific constraints were enforced, enabling individualised estimation of CBF by ensuring appropriate application of constraints on vascular deformation within each segment.
The estimated hyperaemic CBF served as outlet boundary conditions for subsequent CFD simulations. CFD simulations were then performed on patient-specific coronary artery models, generating pressure and velocity fields. IMRCT values were calculated from these simulation results. In our prior study, we also systematically evaluated the impact of variations in outlet boundary conditions on IMRCT computation17.
The Tmn prediction and flow estimation algorithm was developed and validated in our previous study, using an independent derivation cohort17. In the present study, we applied this established algorithm to a new and independent external validation cohort. The estimated flow was used as the boundary condition for IMRCT calculation. Analysis time was <30 min/case. More details are provided in Supplementary Appendix 1171819202122.
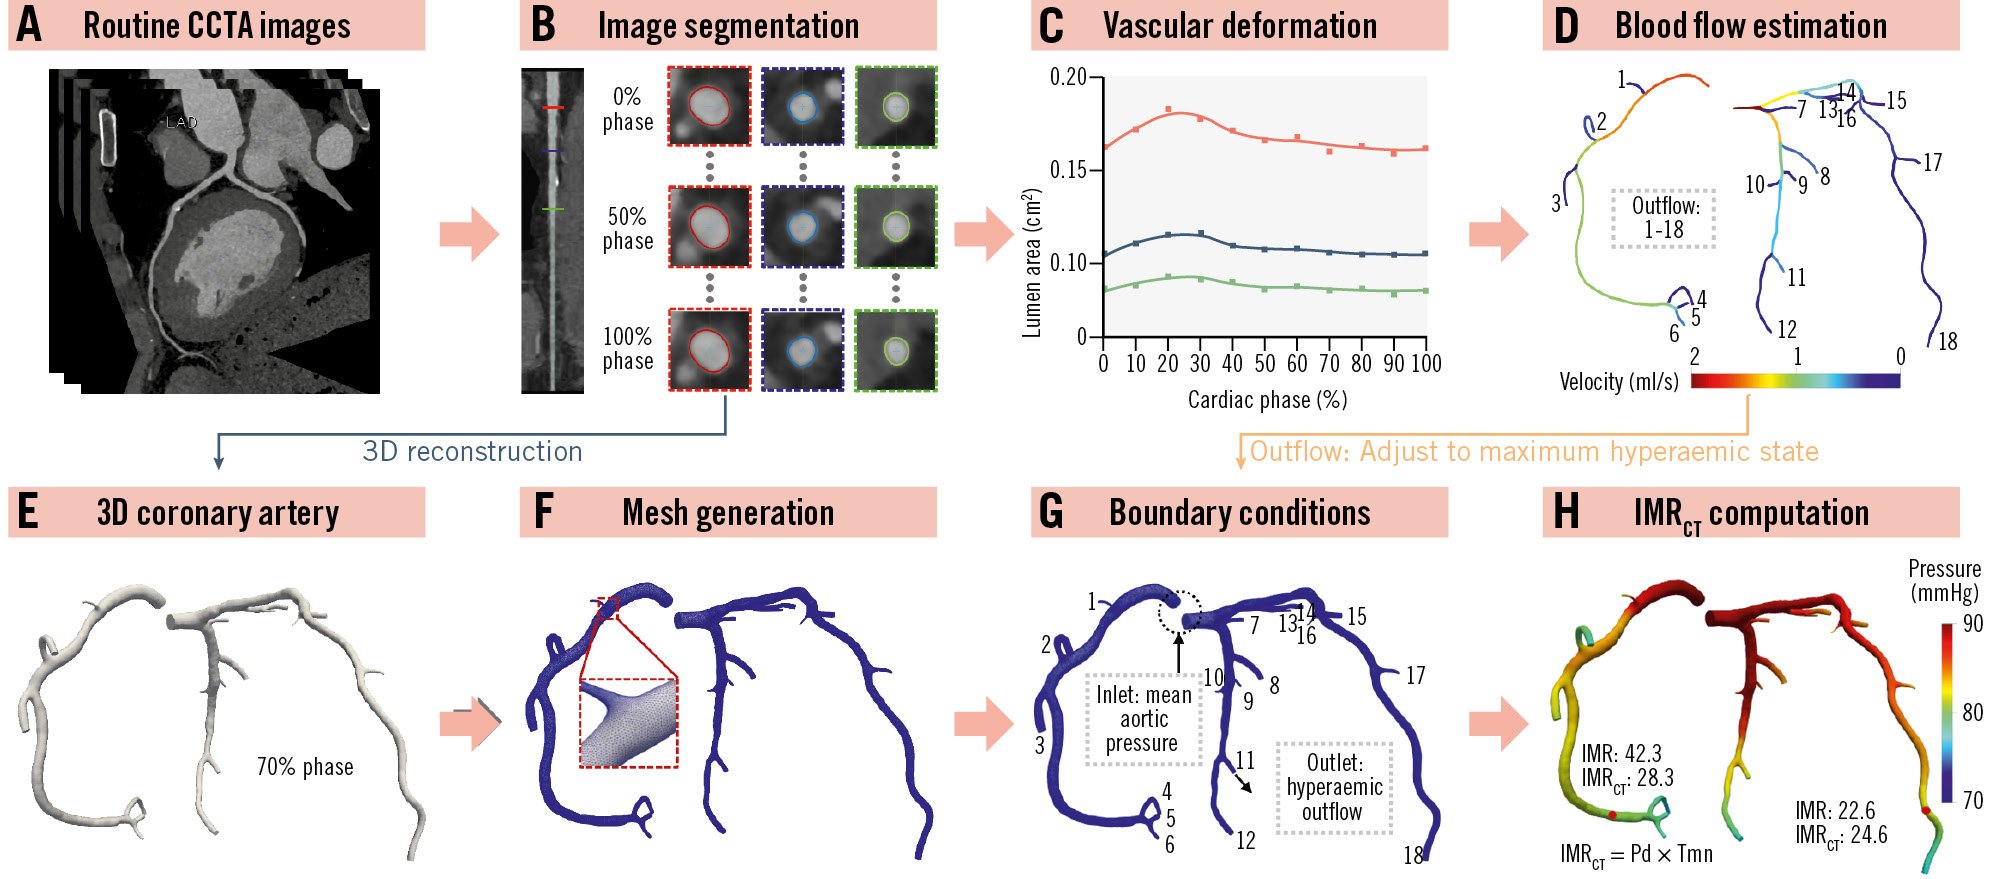
Figure 1. Overview of the workflow of the proposed IMRCT model. A) Input images of the IMRCT model. B) Segmentation of the multiphase CCTA image. C) Extraction of vascular deformation from the cross-sectional area. D) Coronary blood flow estimation based on vascular deformation. E) 3D model reconstruction of the diastolic coronary artery. F) Mesh generation of the 3D model. G) The setting of inlet and outlet boundary conditions in the CFD simulation. H) The results of IMRCT computation. 3D: three-dimensional; CCTA: coronary computed tomography angiography; CFD: computational fluid dynamics; IMR: index of microcirculatory resistance; IMRCT: CCTA-based IMR; Pd: distal pressure; Tmn: mean transit time
Statistical analysis
Shapiro-Wilk and Levene tests were used to assess the normality and homogeneity of variance in the dataset. Continuous variables are presented as the median and interquartile range (first quartile, third quartile). Categorical variables are presented as frequencies and percentages. Pearson and Spearman correlation coefficients evaluated the relationship between IMRCT and invasive IMR, while Bland-Altman analysis assessed agreement. Passing-Bablok regression quantified systematic bias, with the cumulative sum (CUSUM) control chart test confirming linearity. Diagnostic performance was analysed using receiver operating characteristic curves, with accuracy, sensitivity, specificity, positive predictive value, and negative predictive value calculated at patient and vessel levels. Decision curve analysis evaluated clinical utility by comparing the net benefit across risk thresholds. A Sankey diagram was generated to illustrate diagnostic agreement patterns. McNemar’s test was used to compare classification differences, and intrapatient vessel variability was assessed using generalised estimating equations. At the patient level, the highest IMR or IMRCT value was used for analysis in cases of multiple vessel measurements. Statistical significance was set at p<0.05 (two-tailed test). Analyses were performed using R software, version 4.3.2 (R Foundation for Statistical Computing) and MedCalc software, version 20.215 (MedCalc).
Results
BASELINE CLINICAL CHARACTERISTICS
The study reviewed 324 eligible cases, with 196 having complete examination records. Among these, 20 cases were excluded because of having either incomplete datasets or suboptimal image quality. Consequently, the final analytical sample comprised 176 cases (representing 216 vessels), which were subsequently submitted to the core laboratory for rigorous diagnostic efficacy validation (Supplementary Figure 3).
Table 1 presents the baseline characteristics of the patients (average patient age 61.2±8.8 years; males 65.3%). The median interval between CCTA and invasive IMR measurements was 5 days (interquartile range 4-9 days), with no adverse events occurring between the two examinations.
Supplementary Table 1 presents the distribution of vessels assessed per patient. Among the 176 patients, only 35 (19.9%) underwent IMR measurements in two or three vessels. Of these, 57.1% showed concordant IMR values (either all were above and equal to 25, or all were below 25), while 42.9% demonstrated discordant measurements, revealing myocardial perfusion heterogeneity. Notably, complete three-vessel assessment was performed in just five patients, with three showing consistent IMR values and two exhibiting discordance (illustrated in Supplementary Figure 4 and Supplementary Figure 5, for cases of agreement and disagreement, respectively). This heterogeneity was particularly evident in non-obstructive CAD cases. Among 123 patients with FFR>0.8, 41 (23.3% of the total cohort) showed isolated IMR elevation (CFR ≥2.0 and IMR ≥25), as detailed in Supplementary Table 2.
Table 2 shows the characteristics of the 216 vessels included in this study. Among these vessels, 73 (33.8%) had a positive IMR (median IMR 19.5; interquartile range 13.7-29.6). Notably, only 15 vessels (6.9%) with a positive IMR showed a corresponding positive FFR, while the remaining 58 vessels (26.8%) showed a negative FFR. In the CCTA and coronary angiography reports, 67 (31.0%) and 34 vessels (15.7%) exhibited <50% stenosis, respectively.
Table 1. Baseline characteristics of the study population.
| Characteristics | N=176 |
|---|---|
| Age, yrs | 61.2±8.8 |
| Male | 115 (65.3) |
| Body mass index, kg/m2 | 24.5±3.1 |
| Diabetes mellitus | 45 (25.6) |
| Hypertension | 113 (64.2) |
| Current smoker | 80 (45.5) |
| Presence of angina | 158 (89.78) |
| eGFR, mL/min/1.73 m2 | 91.5 (78.1, 103.5) (n=175*) |
| HbA1c, mmol/mol | 5.8 (5.5, 6.5) (n=154*) |
| Total cholesterol, mmol/L | 4.2 (3.6, 5.3) |
| Low-density lipoprotein cholesterol, mmol/L | 2.7±0.8 |
| Left ventricular ejection fraction, % | 65.0 (61.0, 69.0) (n=169*) |
| Total calcification score | 92.8 (5.6, 341.3) (n=164*) |
| Interval between CCTA and invasive IMR measurement, days | 5.0 (4.0, 9.0) |
| Number of patients with at least one vessel either >90% stenosed or occluded | 26 (14.8) |
| Nitroglycerine, µg | |
| 50 | 25 (14.2) |
| 51-100 | 146 (83.0) |
| 101-200 | 5 (2.8) |
| Contrast agent, mL | 80.0 (80.0, 110.0) |
| Values are n (%), mean±standard deviation, or median (interquartile range [Q1, Q3]). *Number of patients for whom continuous variables were calculated. CCTA: coronary computed tomography angiography; eGFR: estimated glomerular filtration rate; HbA1c: glycated haemoglobin; IMR: index of microcirculatory resistance; Q1: first quartile; Q3: third quartile | |
Table 2. Coronary artery characteristics.
| Characteristics | 216 vessels |
|---|---|
| Vessel | |
| LM | 0 (0) |
| LAD | 135 (62.5) |
| LCx | 32 (14.8) |
| RCA | 49 (22.7) |
| TIMI flow grade | |
| TIMI 3 | 205 (94.9) |
| TIMI 1 or TIMI 2 | 11 (5.1) |
| FFR | 0.86 (0.80, 0.91) |
| IMR | 19.5 (13.7, 29.6) |
| CFR | 3.2 (2.3, 4.8) |
| IMRCT | 21.7 (14.8, 28.6) |
| Diameter of stenosis based on CCTA, % | |
| <50% | 67 (31.0) |
| 50-69% | 92 (42.6) |
| 70-90% | 57 (26.4) |
| Diameter of stenosis based on CAG, % | |
| <50% | 34 (15.7) |
| 50-69% | 125 (57.9) |
| 70-90% | 57 (26.4) |
| Vessels with FFR >0.8 | 160 (74.1) |
| Vessels with IMR ≥25 | 73 (33.8) |
| Vessels with IMRCT ≥25 | 84 (38.9) |
| Vessels with FFR ≤0.8 and IMR ≥25 | 15 (6.9) |
| Vessels with FFR ≤0.8 and IMR <25 | 41 (19.0) |
| Vessels with FFR >0.8 and IMR ≥25 | 58 (26.8) |
| Vessels with FFR >0.8 and IMR <25 | 102 (47.2) |
| Values are presented as n (%) or median (interquartile range [Q1, Q3]). CAG: coronary angiography; CCTA: coronary computed tomography angiography; CFR: coronary flow reserve; FFR: fractional flow reserve; IMR: index of microcirculatory resistance; IMRCT: CCTA-based IMR; LAD: left anterior descending artery; LCx: left circumflex artery; LM: left main artery; Q1: first quartile; Q3: third quartile; RCA: right coronary artery; TIMI: Thrombolysis in Myocardial Infarction | |
Diagnostic performance of IMRCT for identifying CMD
Overall diagnostic performance
The predicted Tmn was validated against invasively measured Tmn in an independent cohort, showing a strong correlation (r=0.79; p<0.001) and minimal mean bias (0.05) in Bland-Altman analysis (Figure 2). In our dataset, the optimal AUC value at both patient and vessel levels was achieved at an IMRCT threshold of 23.84. At the vessel level, this threshold yielded the following values: AUC 0.85 (95% confidence interval [CI]: 0.80-0.90), accuracy 81.0% (95% CI: 75.1-86.0%), sensitivity 87.7% (95% CI: 77.9-94.2%), and specificity 77.6% (95% CI: 69.9-84.2%). The corresponding patient-level values were as follows: AUC 0.86 (95% CI: 0.80-0.91), accuracy 80.1% (95% CI: 73.4-85.7%), sensitivity 89.2% (95% CI: 79.1-95.6%), and specificity 74.8% (95% CI: 65.6-82.5%).
However, the low specificity necessitated additional adjustments. To balance sensitivity and specificity while improving understanding, acceptance, decision-making, and result interpretation, we re-evaluated the IMRCT using a threshold of 25, consistent with the threshold for the IMR. At this threshold, IMRCT showed vessel-level accuracy, sensitivity, and specificity of 81.9% (95% CI: 76.2-86.8%), 80.8% (95% CI: 69.9-89.1%), and 82.5% (95% CI: 75.3-88.4%), respectively (Table 3). Similarly, at the patient level, the predictive accuracy, sensitivity, and specificity were 80.7% (95% CI: 74.1-86.0%), 81.5% (95% CI: 70.0-90.1%), and 80.2% (95% CI: 71.5-87.1%), respectively (Table 3). With a cutoff value of 25, the vessel- and patient-level AUCs for predicting IMR ≥25 were 0.82 (95% CI: 0.76-0.87) and 0.81 (95% CI: 0.74-0.86), respectively (Figure 3A, Figure 3B). Thus, a cutoff value of 25 for IMRCT increased specificity while preserving adequate sensitivity and was particularly beneficial in terms of clinical applicability, reliability, and user-friendliness. Interestingly, although this cutoff value did not yield the highest AUC, it demonstrated greater accuracy than a cutoff value of 23.84. Therefore, we set the IMRCT cutoff at 25 in our study. Detailed vessel- and patient-level classifications are provided in Supplementary Table 3.
A notable linear correlation was observed between IMRCT and invasively measured IMR, with correlation coefficients of 0.71 at the vessel level (95% CI: 0.62-0.76; p<0.001) and 0.72 at the patient level (95% CI: 0.64-0.78; p<0.001), as shown in Figure 3C and Figure 3D. Passing-Bablok regression analysis between the IMRCT and the invasive IMR at the patient level (Supplementary Figure 6) yielded the following equation:
IMR=–3.02+1.14×IMRCT
indicating a small systematic difference (intercept: –3.02, 95% CI: –5.90 to –0.59) and a proportional bias (slope: 1.144, 95% CI: 1.030 to 1.275). The CUSUM test for linearity (p=0.40) confirmed the appropriateness of the linear model. Bland-Altman analysis further demonstrated small mean biases of 0.78 (95% CI: –0.43 to 2.01) and 0.92 (95% CI: –0.45 to 2.29) at the vessel and patient levels, respectively (Figure 3E, Figure 3F). The Sankey diagram (Figure 4) illustrates the diagnostic performance of IMRCT, with correct classification in 81.9% of cases (59 true positives and 118 true negatives) and discordant results in 18.1% (25 false positives and 14 false negatives). The McNemar test revealed non-significant differences at both the vessel level (5.09%, 95% CI: –0.53% to 10.72%; p=0.108) and the patient level (5.68%, 95% CI: –0.76% to 12.12%; p=0.121).
Supplementary Figure 7 illustrates IMRCT computation under four physiological scenarios: FFR-positive and IMR-positive, FFR-positive and IMR-negative, FFR-negative and IMR-positive, and FFR-negative and IMR-negative.
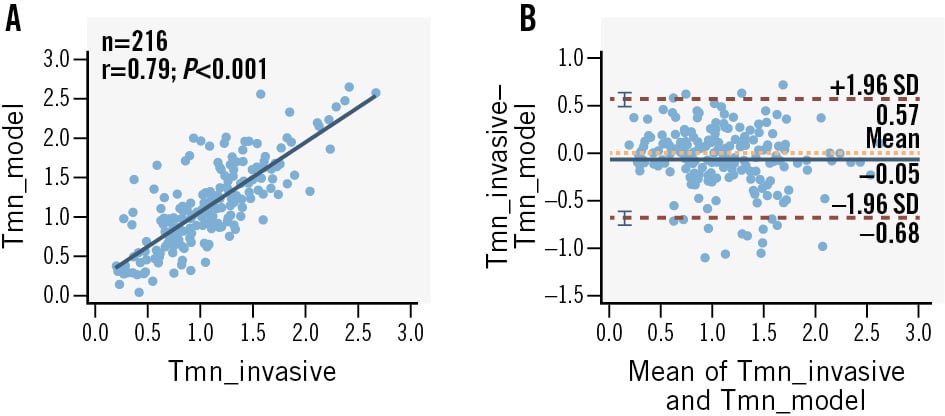
Figure 2. Correlation and agreement between the Tmn calculated by the IMRCT model and the invasive Tmn. A) Correlation between predicted and invasively measured Tmn. B) Bland-Altman plot of predicted versus invasively measured Tmn. CT: computed tomography; IMRCT: CCTA-based index of microcirculatory resistance; SD: standard deviation; Tmn: mean transit time
Table 3. Diagnostic efficacy of IMRCT at vessel and patient levels for IMR ≥25.
| No. | IMR ≥25 | Accuracy | Sensitivity | Specificity | PPV | NPV | AUC | |
|---|---|---|---|---|---|---|---|---|
| Vessel level | 216 | 73 (33.8) | 81.9 (76.2-86.8) | 80.8 (69.9-89.1) | 82.5 (75.3-88.4) | 70.3 (61.9-77.4) | 89.4 (84.0-93.1) | 0.82 (0.76-0.87) |
| Patient level | 176 | 65 (36.9) | 80.7 (74.1-86.0) | 81.5 (70.0-90.1) | 80.2 (71.5-87.1) | 70.7 (62.0-78.1) | 88.2 (81.5-92.6) | 0.81 (0.74-0.86) |
| The values are presented as n (%) or % (95% confidence interval). AUC: area under the curve; IMR: index of microcirculatory resistance; IMRCT: coronary computed tomography angiography-based IMR; NPV: negative predictive value; PPV: positive predictive value | ||||||||
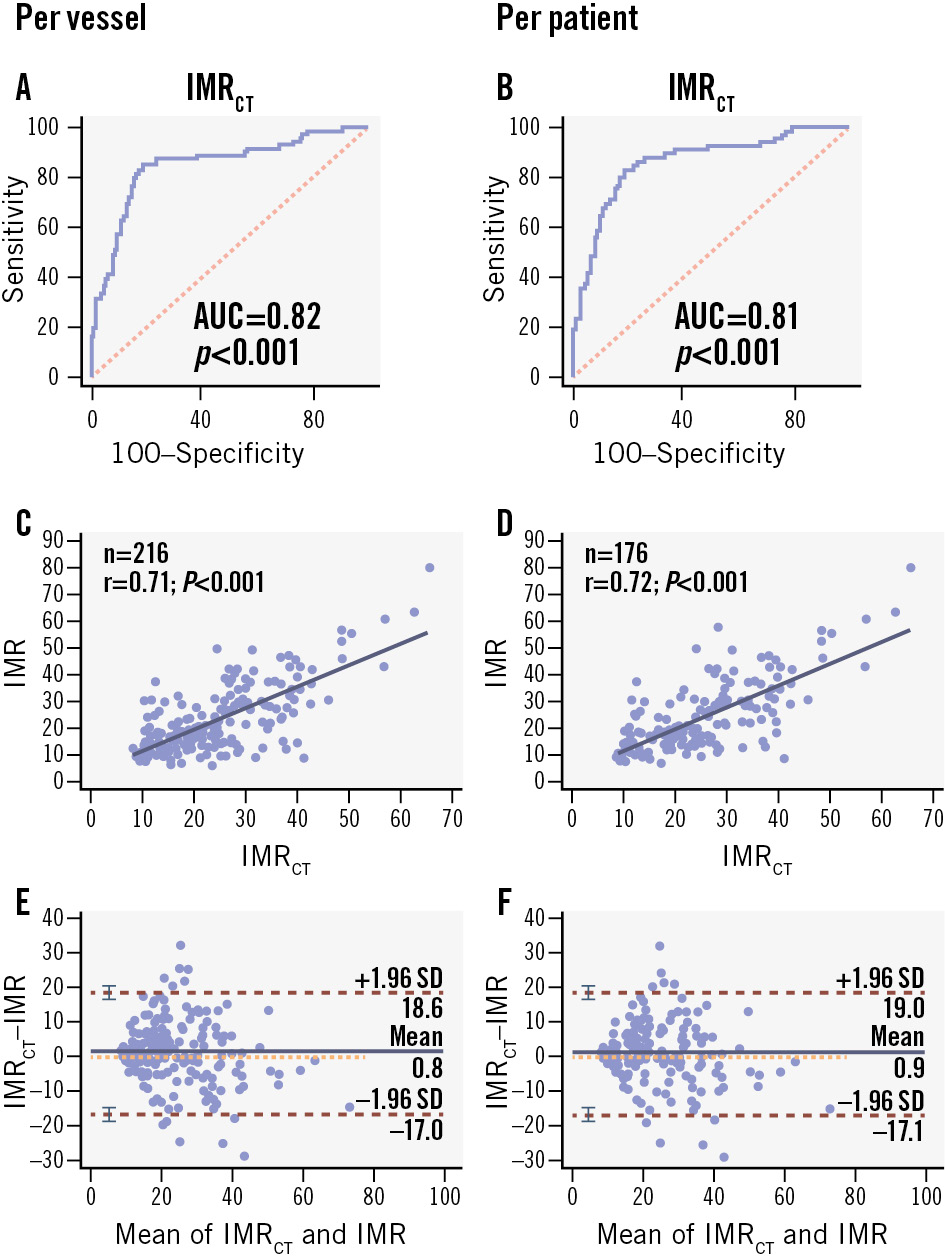
Figure 3. Per-vessel and per-patient diagnostic performance of IMRCT. A, B) AUC of IMRCT to IMR; (C, D) correlation of IMRCT to IMR; (E, F) Bland-Altman plots of IMRCT and IMR. AUC: area under the curve; IMR: index of microcirculatory resistance; IMRCT: coronary computed tomography angiography-based IMR; SD: standard deviation
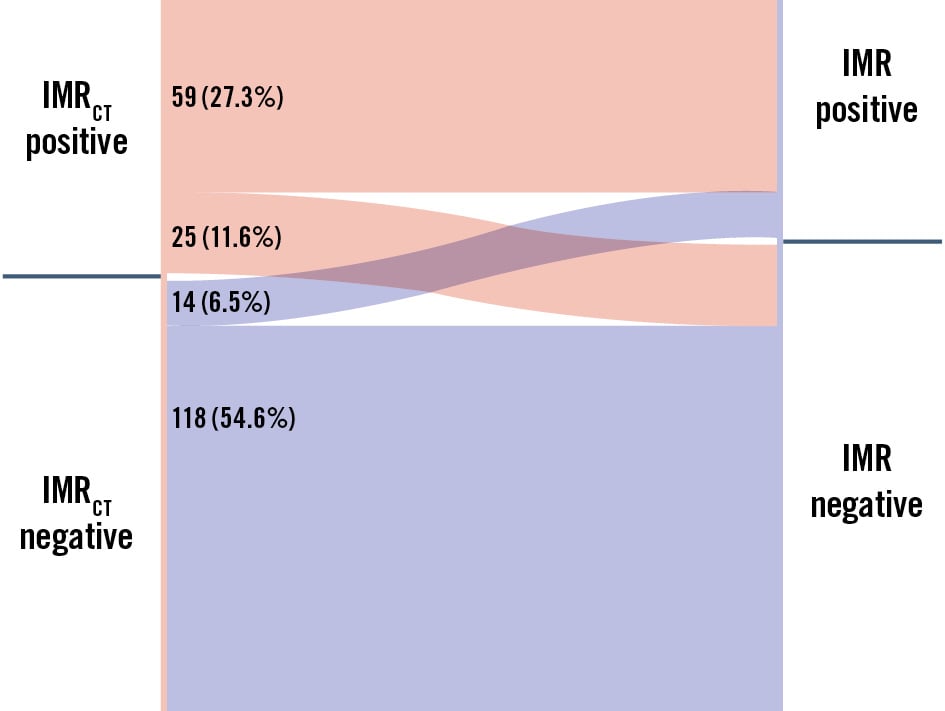
Figure 4. Sankey diagram of diagnostic agreement between IMRCT and IMR for CMD assessment. The Sankey diagram illustrates the counts and proportions of agreement and disagreement between IMRCT and IMR classifications. Each coloured segment corresponds to a specific category, with its width indicating the number of cases. The transitions between categories highlight patterns of diagnostic misclassification and provide insights into the performance of both methods. CMD: coronary microvascular disease; IMR: index of microcirculatory resistance; IMRCT: coronary computed tomography angiography-based IMR
Functional phenotypes and subgroup performance analyses
The diagnostic performance of IMRCT was evaluated across key clinical and anatomical subgroups. Analysis of coronary physiology phenotypes (Supplementary Table 2) revealed four distinct patterns: normal microvascular function (CFR ≥2.0 and IMR <25) in 65 cases (36.9%), isolated IMR elevation (CFR ≥2.0 and IMR ≥25) in 41 cases (23.3%), mixed microvascular dysfunction (CFR <2.0 and IMR ≥25) in 9 cases (5.1%), and functional CMD (CFR <2.0 and IMR <25) in 8 cases (4.5%). Sex-specific analysis showed isolated IMR elevation was more prevalent in females (26.2%, 16/61) than males (21.7%, 25/115), while functional CMD showed the opposite pattern (females 3.3% [2/61] vs males 5.2% [6/115]).
The diagnostic accuracy of IMRCT showed sex-specific differences, with higher performance in males (86.2%, 95% CI: 77.5-92.4%) compared to females (78.7%, 95% CI: 70.2-92.3%). Accuracy remained comparable between hypertensive (82.0%) and non-hypertensive patients (81.8%), as well as between subgroups of diabetic (81.3%) and non-diabetic patients (82.7%) (Supplementary Table 4, Supplementary Table 5).
When analysed by coronary territory, IMRCT demonstrated the highest accuracy in the right coronary artery (RCA; 87.8%; 95% CI: 75.2-95.4%), followed by the left circumflex (LCx; 84.4%; 95% CI: 67.2-94.7%) and left anterior descending arteries (LAD; 79.3%; 95% CI: 71.4-85.8%), as detailed in Supplementary Table 6 and Supplementary Table 7.
Evaluating the potential of IMRCT in reducing misdiagnosis across diverse subgroups
Since only a few patients underwent IMR measurements in all three vessels, patient-level analysis may have underestimated diagnostic omissions. Therefore, we used vessel-level analysis to accurately assess undetected cases, aiming to gauge the potential of IMRCT in reducing diagnostic oversights in the absence of IMR assessment. In every scenario, the use of IMRCT reduced the initial misdiagnosis rate, as detailed in Table 4. Notably, in patients classified as having non-obstructive CAD based on CCTA stenosis <50%, coronary angiography stenosis <50%, or FFR>0.8, the use of IMRCT significantly reduced the initial rates of underdiagnosis from 38.8%, 35.3%, and 36.3% to 4.5%, 5.9%, and 5.6%, respectively.
Table 4. Assessment of potential misdiagnosis and alterations post-IMRCT implementation across diverse scenarios.
| Clinical scenarios (n) | Vessels with IMR ≥25 | Initial misdiagnosis, % | Vessels correctly identified by IMRCT | Post-IMRCT misdiagnosis, % |
|---|---|---|---|---|
| CCTA stenosis <50% (67) | 26 | 38.8 | 23 | 4.5 |
| CCTA stenosis ≥50% (149) | 47 | 31.5 | 36 | 7.4 |
| CAG stenosis <50% (34) | 12 | 35.3 | 10 | 5.9 |
| CAG stenosis ≥50% (182) | 61 | 33.5 | 49 | 6.6 |
| FFR >0.8 (160) | 58 | 36.3 | 49 | 5.6 |
| FFR ≤0.8 (56) | 15 | 26.8 | 10 | 8.9 |
| The miss rate refers to the proportion of IMR-positive cases within their respective subgroups. CAG: coronary angiography; CCTA: coronary computed tomography angiography; FFR: fractional flow reserve; IMR: index of microcirculatory resistance; IMRCT: CCTA-based IMR | ||||
Decision curve analysis for clinical utility assessment
Decision curve analysis of the IMRCT-based predictive model (Supplementary Figure 8) demonstrated its superior clinical utility, with the model’s net benefit (Supplementary Figure 8A) nearly consistently exceeding both the “treat all” and “treat none” strategies. The model maintained robust performance across varying clinical scenarios, as shown in Supplementary Figure 8B where the number of true high-risk patients (dashed blue line) declined more gradually than the total high-risk classifications (solid red line) with increasing cost-benefit ratios (range: 1:100 to 100:1), confirming its ability to preserve diagnostic accuracy under more stringent criteria while appropriately reducing unnecessary interventions.
Discussion
To our knowledge, this is the first CT angiography-based method for evaluating coronary microcirculation. The IMRCT demonstrated good correlation with invasively determined measurements at both the vessel (r=0.71, 95% CI: 0.62-0.76; p<0.001) and patient (r=0.72, 95% CI: 0.64-0.78; p<0.001) levels, achieving diagnostic accuracies of 81.9% and 80.7%, respectively. Thus, IMRCT represents a reliable, non-invasive tool for diagnosing coronary microvascular disease. Given the widespread availability of CCTA, IMRCT holds significant clinical implications (Central illustration).
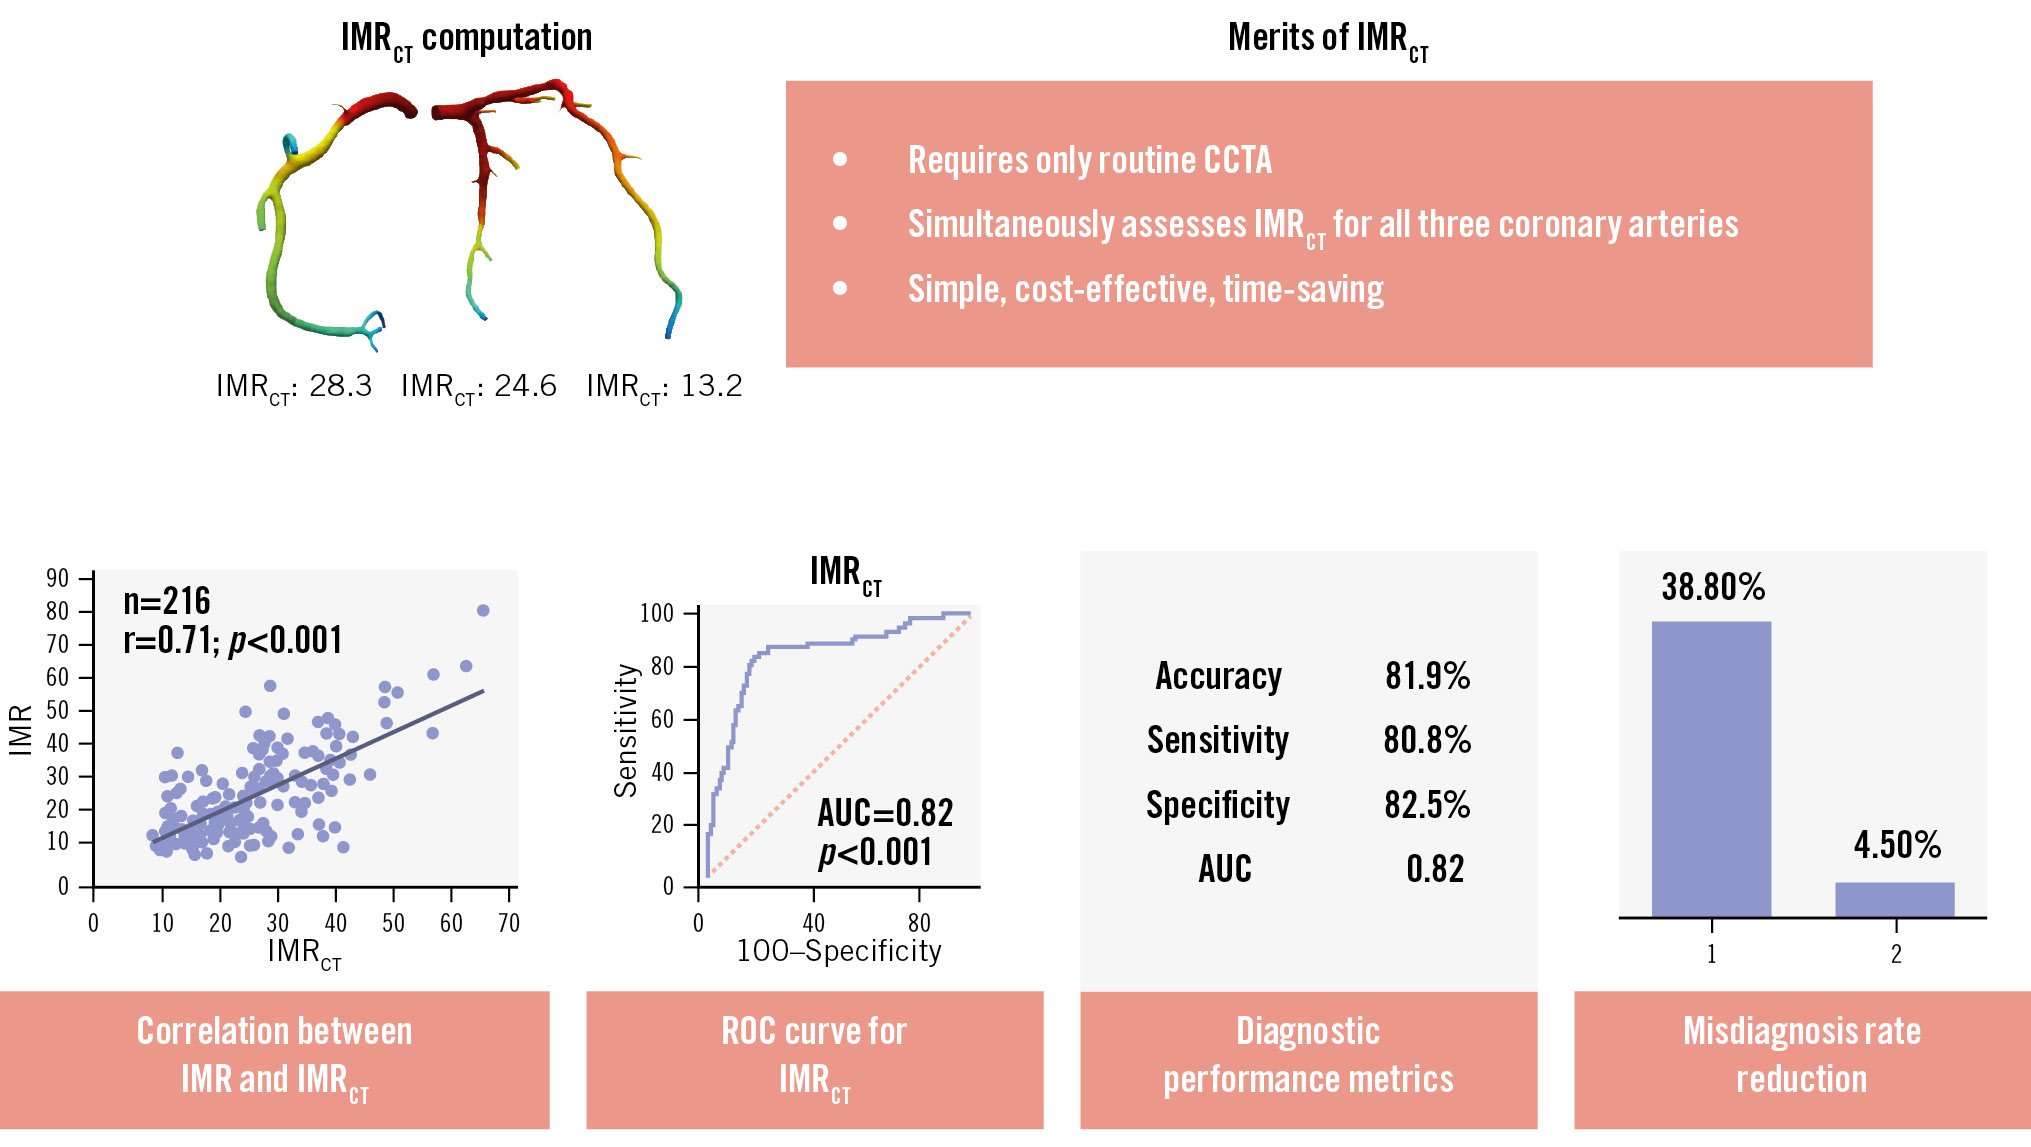
Central illustration. Diagnostic performance and merits of IMRCT in CMD. IMRCT leverages routine CCTA to provide an accurate, non-invasive approach for CMD diagnosis, markedly reducing missed diagnoses and overcoming the limitations of conventional methods. AUC: area under the curve; CCTA: coronary computed tomography angiography; CMD: coronary microvascular disease; IMR: index of microcirculatory resistance; IMRCT: CCTA-based IMR; ROC: receiver operating characteristic
IMRCT can overcome the limitations of current functional assessments for CMD
IMRCT analysis uses multiphase CCTA data from routine clinical scans with retrospective electrocardiogram gating, eliminating the need for additional scans. This approach allows the seamless integration of non-invasive IMRCT assessments into clinical practice while prioritising patient safety.
With sensitivities and specificities of approximately 80% in comparison with invasive IMR measurements, IMRCT may be suitable for broader clinical adoption. Our findings were systematically compared with established functional measurement techniques. A recent meta-analysis demonstrated that angiography-derived IMR achieved diagnostic parameters of 81% sensitivity, 80% specificity, and an AUC of 0.86823. Although IMRCT provides similar diagnostic accuracy, its non-invasive nature represents a distinct clinical advantage. An apparent discrepancy warrants discussion: while Passing-Bablok regression indicated systematic underestimation of invasive IMR by IMRCT (slope B=1.144) (Supplementary Figure 6), the Sankey diagram revealed a higher rate of false positives (11.6%) than false negatives (6.5%) (Figure 4). This paradox can be explained by fundamental differences between these analytical approaches.
First, the continuous nature of regression analysis captures absolute measurement differences across the full range of values, whereas classification-based analysis depends strictly on threshold-defined categories (IMR ≥25). Second, IMRCT exhibits greater variability near the diagnostic cutoff – likely due to limitations in CT spatial resolution and inherent haemodynamic fluctuations during measurement – resulting in more frequent misclassification of true-negative cases, despite overall lower absolute values. Notably, decision curve analysis confirmed that these technical discrepancies have minimal clinical impact (Supplementary Figure 8), as IMRCT demonstrated consistently superior net benefit across all risk thresholds. This suggests that most misclassifications occur in clinically ambiguous cases, where either diagnostic call would have little influence on clinical management.
Subgroup analyses revealed important patterns in IMRCT performance. While showing consistent accuracy across subgroups of patients with hypertension and diabetes, IMRCT demonstrated reduced diagnostic performance in females and in the left anterior descending artery (likely owing to its anatomical complexity24). Sex-specific analysis revealed females had a higher prevalence of isolated IMR elevation (26.2% vs 21.7% in males) but lower rates of strictly defined functional CMD (CFR <2.0 and IMR <25; 3.3% vs 5.2%). These distinct sex-based patterns reflect well-established differences in microvascular pathophysiology, the underlying mechanisms of which warrant further investigation252627.
We acknowledge that while IMRCT provides reliable resistance measurement, comprehensive CMD evaluation requires both resistance-based (IMR) and flow-based (CFR) metrics. Our data reveal important diagnostic discrepancies when these metrics are combined: 23.3% of patients exhibited isolated IMR elevation (CFR ≥2.0 with IMR ≥25), while 4.5% showed isolated CFR impairment (CFR <2.0 with IMR <25) (Supplementary Table 2). These patterns likely reflect distinct pathophysiological mechanisms – the former suggesting microvascular remodelling or focal resistance abnormalities and the latter indicating global flow impairment due to endothelial dysfunction or diffuse disease. This validation study was intentionally designed to evaluate IMRCT against invasive IMR, positioning it as a complementary tool rather than a complete substitute for existing diagnostics. The observed discrepancies between IMR and CFR measurements underscore why neither metric alone suffices for comprehensive CMD assessment. Our approach proves particularly valuable for the clinically relevant subgroup with isolated IMR elevation, though we recognise that patients with discordant CFR/IMR findings (e.g., preserved IMR with low CFR) represent a diagnostic gap for IMRCT in its current form.
While some evidence suggests better outcomes for patients with isolated IMR elevation compared to those with combined abnormalities, their long-term prognosis requires further study. Notably, our data show that 38% of vessels with FFR>0.8 had abnormal IMR but normal CFR, highlighting how IMRCT could detect early microvascular disease missed by flow-based assessments alone. Emerging CT-based CFR techniques may soon enable fully non-invasive multimodal assessment when combined with IMRCT, potentially resolving these diagnostic discrepancies by capturing both resistance and flow components of CMD pathophysiology.
IMRCT can mitigate the underdiagnosis of CMD across diverse clinical scenarios
CMD accounts for 28% to 43% of chest pain cases with non-obstructive CAD28 and shows a comorbidity rate of 41%29. Vessels showing <50% stenosis on CCTA/coronary angiography or FFR>0.8 are considered low risk and often not tested further. In our study, many of these vessels showed positive invasive IMR results, indicating missed CMD diagnoses, and IMRCT substantially reduced these missed diagnoses. Thus, IMRCT can decrease CMD underdiagnosis rates in non-obstructive CAD. Early diagnosis and tiered management of CMD can significantly improve angina symptoms and quality of life30. Since clinicians often tend to focus on major epicardial vessel lesions, potentially overlooking concurrent microvascular disease, IMRCT can help identify coexisting CMD in patients with obstructive CAD (CCTA/coronary angiography stenosis ≥50% or FFR ≤0.8).
IMRCT can yield non-invasive assessments of all major coronary arteries
To assess the overall microcirculatory condition of the myocardium, IMR measurements of all three major coronary arteries are necessary. In the 3V FFR-FRIENDS study31, among patients undergoing three-vessel IMR evaluation, 59.1% had no CMD, while 23.7% had CMD in one vessel, 14.0% in two vessels, and 3.2% in all three vessels. Moreover, the incidence of CMD was similar across the LAD, LCx, and RCA32.
The 3V FFR-FRIENDS study31 enrolled patients with >30% stenosis in all three coronary arteries, but in real-world clinical practice, patients often show a combination of stenotic and non-stenotic vessels. Ethical concerns limit invasive examinations to stenotic or slow-flow vessels, often the LAD. In our study, we analysed 135 LAD, which constituted 62.5% of the total vessels measured, aligning with the Swedish CArdioPulmonary BioImage Study cohort’s33 findings that the LAD had the highest prevalence of disease. However, we also found IMR-positive results in 32 LCx and 49 RCA, indicating that CMD can affect vessels beyond the left anterior descending artery.
Furthermore, the inconsistencies in IMR measurements in multiple coronary vessels indicated heterogeneity in microvascular function across different myocardial territories, potentially due to factors like blood flow characteristics, vessel dimensions, the supplied myocardial mass, and other mechanisms that remain to be elucidated2434. IMRCT overcomes this limitation by simultaneously assessing myocardial perfusion across all major coronary arteries, providing a practical solution for this issue.
Limitations
This study has several limitations. First, as a retrospective, single-centre study focusing on stable CAD patients, our analysis may be subject to selection bias. The current study also lacks standardised documentation of Canadian Cardiovascular Society class and New York Heart Association Functional Class, which limits our ability to correlate symptom severity with IMRCT values. These gaps are being addressed in an ongoing multicentre prospective trial that is incorporating structured symptom assessment and hard clinical endpoints to fully define the clinical utility of IMRCT. Second, inherent limitations of CCTA include reduced accuracy in patients with arrhythmias, tachycardia, or extensive coronary calcification – challenges that may be mitigated by future technical advancements and imaging strategies. Third, while IMRCT reliably assesses hyperaemic microvascular resistance, it has inherent limitations in fully characterising CMD. Specifically, it cannot assess functional CMD manifestations or detect vasospastic components – since acetylcholine provocation testing was not performed – and requires complementary flow-based metrics such as CFR for a comprehensive evaluation. Emerging approaches like microvascular resistance reserve35 may offer additional insights, particularly in patients with mixed disease phenotypes. However, current invasive protocols that integrate IMR, CFR, and vasomotor function testing remain the reference standard for a complete physiological assessment of the coronary microcirculation. Fourth, IMRCT computation remains influenced by the accuracy of the outlet hyperaemic flow boundary conditions, and further efforts are needed to improve outlet flow estimation36. The vessel wall material parameters are currently based on fixed values derived from healthy subjects and are not personalised for individual patients, which may limit the accuracy of modelling vessel elasticity in specific cases. Additionally, the empirical relationship used to convert resting flow to hyperaemic flow is derived from population-level data and may not be fully applicable to all patient subgroups.
Conclusions
This study clarified the potential of IMRCT measurements for CMD. Advancements in image reconstruction can improve the spatial resolution of CCTA and enhance the accuracy of IMRCT, thereby facilitating early detection, precise assessment, and management of CMD.
Impact on daily practice
This study addresses the unmet need for a reliable, non-invasive diagnostic tool for coronary microvascular disease (CMD) by establishing the clinical utility of a coronary computed tomography angiography-based index of microcirculatory resistance through advanced image-reconstruction technology. The method’s simplicity and diagnostic accuracy enhance early CMD detection rates while reducing misdiagnosis, enabling tailored microvascular-targeted therapies. This advancement optimises patient outcomes and refines CMD management strategies by integrating seamlessly into routine cardiovascular imaging workflows.
Funding
This study was supported by the Chongqing Talent Program (CQYC20210303360), the Chongqing Technological Innovation and Application Development Special Key Project (CSTB2023TIAD-KPX0061-2, CSTB2023TIAD-KPX0061-6), the National Natural Science Foundation of China (62101610, 62271511, 62101606, 62276282), the Chongqing Graduate Scientific Research and Innovation Project (CYB240291), and the Clinical Research Incubation Program of the First Affiliated Hospital of Army Medical University (2023IITZD04).
Conflict of interest statement
The authors have no conflicts of interest to declare.
Supplementary data
To read the full content of this article, please download the PDF.