Antonius F.W. van der Steen1,2*, Radj A. Baldewsing1, F. Levent Degertekin3, Stanislav Emelianov4, Martijn. E. Frijlink1, Yuji Furukawa5, Dave Goertz1,2, Mustafa Karaman6, Pierre T. Khuri-Yakub7, Kang Kim8, Frits Mastik1, T. Moriya9, Ömer Oralkan7, Yoshifumi Saijo10, Johannes A Schaar1, Patrick W Serruys1, Shriram Sethuraman4, Akira Tanaka11, Hendrik. J. Vos1,12, Russell Witte8, Matthew O’Donnell8
Introduction
Intravascular Ultrasound is a clinically available technique that can image the vessel wall and atherosclerotic plaque1. Although the first patent on this technique dates from 19722,3, the first catheters for clinical use were only available in the late eighties4,5. Since then this diagnostic technique is ever evolving. The main clinical applications to date have been assessment of free lumen and atherosclerotic plaque area6, volume and therapy guidance7,8 and guidance of stent placement9. To a lesser extent, it has been used for dosimetry in brachytherapy10 and for assessing the true 3D orientation of coronary arteries and plaque to perform haemodynamic and shear stress studies11-13.
At present, IVUS has only been used to a limited percentage of its potential. Most concepts mature outside the view of a clinical audience, but are widely discussed in the technical ultrasonics and biomedical engineering societies before they become available products. Probably the most appropriate platform for this has been the annually held IEEE Ultrasonics Symposium. Most IVUS equipment and signal processing methods were discussed here long before they became available in the clinic14,15. The array catheter and its beam forming were introduced in 199116. Also forward looking IVUS has been discussed by several groups17,18. Qualitative flow19,20 and quantitative flow21-23 assessment derived from IVUS data were introduced here as well as tissue characterization using RF data, now available under the name Virtual Histology24-27. Also IVUS Elastography, Palpography and tissue velocity imaging28-32 were nurtured at this symposium.
This paper gives a review of IVUS techniques under development that were discussed at the 2005 IEEE Ultrasonics symposium. Although not all will become products, it gives a good impression of what is cooking in engineering kitchens.
Forward-Viewing IVUS using CMUTs
Forward-viewing ultrasound volume images are desired for many intravascular and intracardiac applications such as guiding treatment of chronic total occlusion, helping stent deployment, and monitoring ablation procedures in the heart. Because of the requirements for a guidewire in catheters, an annular ring is the preferred geometry for transducer arrays. However, it is very challenging to implement this geometry in a very small scale (1-2 mm) using existing piezoelectric transducer technology18.
Capacitive Micro-machined Ultrasonic Transducers (CMUT) are transducers that consist of many tiny air filled capacitors, with a flexible electrode membrane on top. When a DC bias voltage is applied to these miniature membrane transducers a stress is developed proportional to the voltage applied squared and the top electrode membrane deflects. Operationally they show a lot of similarity to piezoelectric materials, but they do have a few distinct advantages.
CMUT arrays can be made in any arbitrary geometry with very small dimensions using photo-lithographic techniques and standard micro-fabrication processes. In addition to their ease of fabrication, CMUTs also offer performance advantages such as wide bandwidth and improved sensitivity33. CMUTs are also particularly suited for high frequency arrays because the fabrication process used is routinely able to produce features several microns in size. Recent developments in micro-machined ultrasound transducer technology have enabled implementation of IVUS arrays for forward-looking imaging at the tip of a catheter17,34. This technology is currently implemented by a group from Stanford35 and a group from Georgia Tech36.
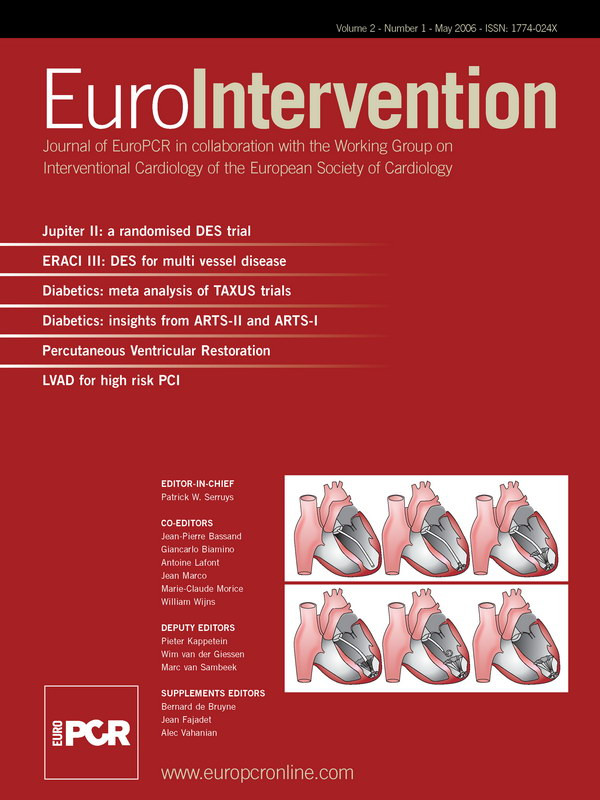
At Stanford, a 64-element, 2-mm diameter CMUT ring array allows full synthetic phased array volumetric images to be generated with integrated electronics (Figure 1a).
At Georgia Institute of Technology, a similar array with a 1.15 mm diameter has been constructed37-38. (Figure 1bc)
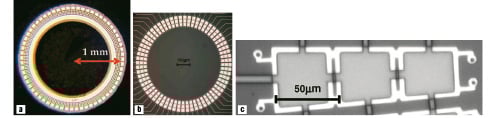
Figure 1. (a) Magnified view of the Stanford CMUT annular ring array. (b) Magnified view of the Georgia Tech CMUT annular ring array. (c) Further magnification of one element of the Georgia Tech array, each consists of f 3 rectangular cells connected in parallel.
An interesting feature of CMUT operation is the ability to change the operating frequency by changing the DC bias. If the DC bias is made so high that the upper membrane just touches the lower, the so called collapse mode, the membrane cannot vibrate any more at its fundamental resonance frequency and it will vibrate at harmonic frequencies. The resulting operating frequencies in conventional and collapse regimes for these arrays can be e.g. 8.5 MHz and 19 MHz, respectively. Potentially, this operating flexibility of CMUTs allows on-demand switching between its two modes of operation during the imaging procedure, thereby providing a choice between the low frequency conventional mode with high penetration for navigation and the high frequency collapse mode with high resolution for diagnosis. The imaging capacity of forward looking arrays is shown in Figure 2.
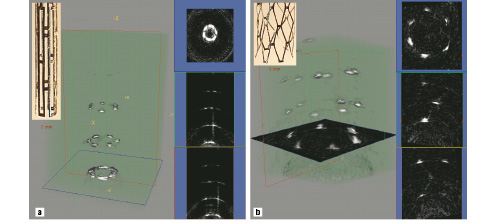
Figure 2. 3-D rendered ultrasound images and some cross-sections acquired with the Stanford array of (a) an undeployed Palmaz-Schatz stent; and (b) a deployed Palmaz-Schatz stent.
Phantoms including deployed and undeployed forms of a Palmaz-Schatz coronary stent have been imaged.
It should be understood that such elements have not been mounted on a catheter yet. Minimization and integration of electronics are the main challenges in the near future.
Ultrasonic micromotor for IVUS
Commercially available IVUS catheters contain either 64 static elements or one rotating element. An advantage of a single element is that it is larger, and thus it is easier to obtain a good signal to noise ratio or achieve higher frequencies, resulting in a higher resolution. One of the disadvantages of a mechanically rotating IVUS systems is non-uniform rotational distortion (NURD)31,39, caused by the long flex between the ultrasound element and the motor driving it. NURD can be overcome by rotating a transducer or a mirror using a micro motor placed close to them. The feasibility of an electromagnetic micromotor for IVUS has been shown in the past40,41. Given that metallic structures are potentially present in the close vicinity of the micromotor, including guidewires and stents, the design and manufacturing of an electromagnetic motor is quite critical. If the magnetic field is not fully contained in the motor, it may stop rotating or perform in an unpredictable fashion.
Ultrasonic motors do not suffer from this problem. In Tokyo, a new ultrasonic micromotor 1 mm in diameter and 3 mm in length has been built42. It can work in a liquid environment and is hollow, so that electronic connection wires for the transducer can pass through. The ultrasonic motor uses a wave guide in the shape of a helical coil as a stator. The coiled stator is placed inside or outside of the rotor and the stator is pressed to the rotor. The motor operates as a travelling wave type ultrasonic motor, a flexural wave propagates along the coiled acoustic wave guide. This so called “lamb wave” crawls like a caterpillar over the rotor. Since the stator is fixed this makes the rotor rotate. Two operational realizations of the motor are illustrated in Figure 3.
Figure 3. a. Ultrasound micromotor with an external stator. A flexural wave propagates along the coiled acoustic waveguide. This wave crawls like a caterpillar over the rotor, and makes it rotate. b. Ultrasound micromotor with an internal stator. (Scale is in cm)
In Figure 3a, the stator is placed outside the rotor, the diameter is 1 millimetre. In Figure 3b, the stator is placed inside the rotor. This version needs to miniaturized further since is has at present a diameter of 2 millimetres. The rotor of the first one is capable of rotating with a speed of approximately 500 - 2,000 r.p.m, the second one at 5000-8000 r.p.m., both according to the ultrasonic power delivered. Another feature of the motor is that the transducer to excite the Lamb wave and the driving part consisting of the rotor and the stator are separated. Since the former can be placed outside the body, the driving part can be made as small as 0.8 mm in diameter and 3mm in length. Although the concept works, the technology still needs to be transferred to a catheter.
Harmonic IVUS
Since its introduction43,44, Tissue Harmonic Imaging (THI) has increased the diagnostic value of conventional echocardiography. THI is a technique by which the received scattered ultrasound contains higher harmonics of the transmitted pulse due to non-linear sound propagation. THI enhances image quality through the combination of low harmonic content in the near field, a narrower beam, and reduced side lobe levels.
Although THI has been shown to increase image quality in medical ultrasound below 10 MHz, little work has been done to assess the benefits in IVUS applications. Initial studies showed the feasibility of THI at high frequencies for Ultrasound Biomicroscopy (UBM) and IVUS in vitro45,46. The reduction of stent imaging artifacts was shown when high frequency (20 - 40 MHz) THI was applied with a focused UBM transducer47. In vivo feasibility experiments of THI for an IVUS system using both a conventional and a custom-made mechanically-rotated IVUS catheter were described48.
A prototype IVUS imaging system using a fast-rotating single element was constructed to do phantom experiments and perform in vivo imaging. To study the ability of a conventional IVUS catheter and a custom-made Harmonic IVUS catheter49 to generate the required fundamental pressure to build up a detectable level of propagation harmonics, imaging experiments were performed. Data was acquired in fundamental 20 MHz (F20), harmonic 40 MHz (H40) mode, and for comparison purposes also in fundamental 40 MHz mode (F40). Harmonic images of cross-sections of an atherosclerotic aorta of a New Zealand White rabbit in vivo were formed by means of the Pulse Inversion (PI) technique. Signal-to-noise ratios (SNR) in H40 acquisitions were estimated in vivo for both catheters when driven by an F20 pulse with equal amplitude.
Cross-sectional images of the rabbit aorta in vivo were created using THI (Figure 4).
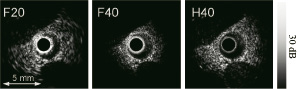
Figure 4. Cross-sections of an atherosclerotic rabbit aorta acquired in F20, F40 and H40 mode in vivo. These images are normalized with respect to the maximum signal level in the individual images.
The combined effect of amplifier saturation and reflections of the surrounding sheath, visible close to the transducer, is the least visible in H40 acquisition compared to both fundamental acquisitions. The latter emphasizes the advantage of reducing acoustic energy in the near field through the use of the harmonic beam. Recently, a transducer element (Figure 5) optimized for intravascular harmonic imaging, showing a frequency response with two peaks around 20 and 40 MHz, has been designed, fabricated and characterized49.
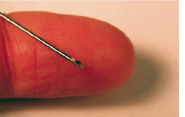
Figure 5a. The dual frequency transducer.
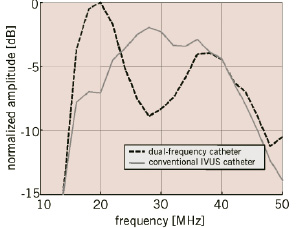
Figure 5b. One-way frequency responses of the dual-frequency catheter and a conventional IVUS catheter.
The main difference is an improved efficacy in transmit of 6 dB.
The in vivo imaging experiment resulted in a significant SNR improvement (>12 dB) in H40 mode of the custom-made catheter relative to the conventional catheter (Figure 6).
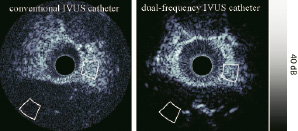
Figure 6. Cross-sections of rabbit aortas acquired in H40 mode with both a conventional and a dual-frequency IVUS catheter. Gray contours show the regions of interest for the SNR estimation.
However, careful interpretation is necessary since the aortas of only two different animals were imaged.
Incorporating optimised IVUS catheters for Harmonic Imaging indicates that instrumentation developments can improve harmonic IVUS imaging. Current studies investigate the feasibility of Harmonic IVUS with available clinical IVUS systems.
Contrast intravascular ultrasound
Microbubble contrast agents have been employed extensively at lower diagnostic ultrasound frequencies50, but have seen little use in intravascular ultrasound. While microbubbles can in some circumstances be visualised through simple echogenicity enhancement, sensitive and specific detection of the agent is invariably achieved using more bubble-specific acoustic signatures. Two approaches employed successfully at lower frequencies are second harmonic imaging (listening at twice the ultrasound transmit frequency) and subharmonic imaging (listening at half the ultrasound transmit frequency). Using prototype instrumentation, it has recently been shown that microbubbles can be imaged in this manner with IVUS51. With these new approaches, two applications are possible: vasa vasorum imaging and molecular imaging.
Vasa vasorum imaging
It is well recognized that developing neovascular vasa vasorum is necessary for atherosclerotic plaque progression and that the microvascular status of lesions can be a marker for vulnerability to rupture52,53. At present, there are no established clinical tools capable of imaging coronary artery vasa vasorum54. Animal studies have been conducted to investigate the combination of microbubble contrast agents with prototype nonlinear IVUS systems to image vasa vasorum. In these experiments, the IVUS catheter was situated in a region of interest in an atherosclerotic rabbit aorta while contrast agent (Definity®, Bristol Myers Squibb) was released proximally in the form of a bolus through a delivery catheter. The agent was first detected within the main lumen, and then (after 5-10 second delay) within the adventitia surrounding the plaque (Figure 7).
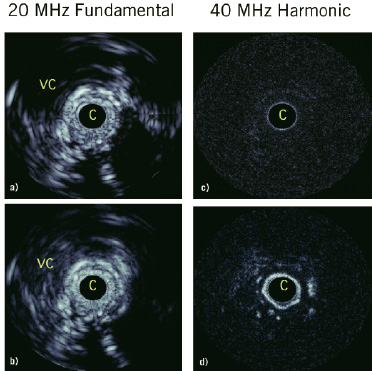
Figure 7. In vivo results in an atherosclerotic rabbit aorta using decanted Definity®. a) Fundamental mode prior to agent injection, where ‘c’ is the catheter, the vena cava is ‘vc’. b) Fundamental mode 15 seconds post injection where changes in adventitial enhancement are not evident, except for in a region at 4 o’clock and within the vena cava. c) Harmonic mode prior to injection shows the tissue signals to be largely suppressed. d) 15 second post-injection harmonic mode shows significant adventitial enhancement, consistent with the detection of adventitial microvessels. Scale of images is 12 mm across. The dynamic range of the fundamental and harmonic images are 40 and 25 dB respectively.
Quantification of the enhancement was statistically significant. In general, the spatial pattern of agent presence within the adventitia, and not the plaque itself, was consistent with the microvascular distribution revealed by histological sections taken in the vicinity of the imaging planes. These results indicate that contrast harmonic IVUS is capable of imaging features of vasa vasorum.
Molecular imaging
Targeted microbubble contrast agents used in conjunction with IVUS holds considerable potential for understanding the molecular status of atherosclerotic plaques, which may, in turn, impact plaque staging. A number of reports have indicated the feasibility of imaging microbubbles targeted to endothelial cell adhesion molecules55 and fibrin56. These studies relied upon simple enhancement of echogenicity to determine the presence of microbubbles, and as such require the accumulation of considerable agent concentrations at target sites. The feasibility of bubble-specific imaging of targeted agent using a prototype nonlinear IVUS system was investigated57. The agent was an experimental biotinated, lipid encapsulated formulation comprised substantially of micron and submicron sized bubbles (BG3039; Bracco Research, Geneva) targeted to an avidin coated agar substrate. Example images of tissue mimicking phantom coated with targeted contrast agents are shown in Figure 8.
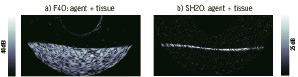
Figure 8. Agent targeted to tissue phantom in a) 40 MHz fundamental (F40) mode and b) in 20 MHz subharmonic (SH20) imaging modes. Image size 10 mm laterally, displaying half of rotational IVUS image.
In fundamental (i.e. conventional ‘linear’ imaging) mode (Figure8a), the agent is difficult to distinguish from background tissue signals. However, in second harmonic (not shown) and subharmonic (Figure 8b) modes the agent is clearly detected, with tissue signals suppressed below the noise floor. These results demonstrate the feasibility of harmonic imaging as a strategy for improving the sensitivity and specificity of targeted contrast agent detection at high ultrasound frequencies. Applicability of such molecular imaging approach in vivo still needs to be shown.
Plaque characterization techniques
Structure and composition, rather than the degree of stenosis, are important characteristics of atherosclerotic plaques58,59. Identification of vulnerable plaques that consist of a lipid or necrotic core, covered by a thin fibrous cap, so called Thin Cap Fibro Atheromas (TCFA’s) is particularly interesting, since the cap can rupture and if the necrotic core comes in touch with the blood it may create a thrombus that can occlude a vessel, causing an acute cardiovascular event. Hence, there is a need for a comprehensive imaging technique that can provide clinically relevant information both to detect and differentiate vulnerable plaques, and to determine the activity and the progression of the atherosclerotic lesion for appropriate management of the disease. Several techniques are under development for this task. Spectral analysis60 of radiofrequency data is utilised in Virtual Histology21, but there are several other approaches that may complement this technique, e.g. by using self organizing maps61. The elastic properties of a plaque are explored by IVUS Palpography30 and Elastography62, but also this technique can be extended using Modulography or Thermal Strain Imaging64. Also combination with other imaging modalities like Photo-Acoustic Imaging65 will likely increase sensitivity and specificity of the technique.
Intravascular photo-acoustic imaging
Catheter-based intravascular Photo-Acoustic (IVPA) imaging is being explored as a tool to identify and characterize the vulnerability of atherosclerotic plaques66. Integrated with intravascular ultrasound (IVUS) imaging65, this combined technique will be capable of direct assessment of both functional and morphological properties of coronary atherosclerotic plaques, thus differentiating various types of plaques and efficiently guiding interventions with improved outcomes.
IVPA imaging is based on the detection of acoustic waves generated by laser pulses66. Specifically, the tissue is irradiated with short (3-10 ns) laser pulses with energy fluence (1-2 mJ/cm2) far below the ablation threshold. As electromagnetic waves are differentially absorbed and tissue undergoes rapid thermoelastic expansion, broadband acoustic waves are generated within the irradiated volume.
Using an ultrasound detector (40-MHz IVUS catheter), these ultrasonic waves can be detected and spatially resolved to provide an image of internal tissue composition depicting the spatial distribution of optical absorbers. In IVPA imaging of arterial vessels, contrast is related to the optical absorption in intima, media, adventitia and atheromatous plaque67. In addition, photo-acoustic imaging has been integrated with IVUS. In this implementation, both IVPA and IVUS imaging systems utilize the same ultrasound sensor and associated receiver electronics allowing temporally consecutive, spatially concurrent ultrasonic and photo-acoustic imaging65.
IVUS and IVPA images were obtained from an excised section of a normal rabbit artery using a 40-MHz IVUS catheter. (Figure 9)
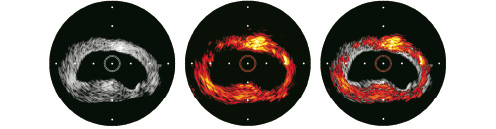
Figure 9. IVUS, photo-acoustic and combined image of a rabbit aorta.
Each image covers a 6.67-mm diameter field of view with the IVUS catheter positioned at the centre. IVPA and IVUS images are spatially co-registered and show excellent correspondence. Both images illustrate the feasibility of obtaining reliable photo-acoustic signals from tissues and the ability to perform combined IVUS and IVPA imaging. The combined IVUS/IVPA image suggests that the area of functional interest can be delineated in the overall context of the vessel structure highlighting the importance and advantages of integration.
Combined IVPA and IVUS imaging can offer several advantages in imaging atherosclerotic plaques and may become an important clinical tool with sufficient sensitivity and specificity to guide coronary artery interventions. It is anticipated that IVPA/IVUS imaging may detect and differentiate different types of atherosclerotic plaques since both anatomical (morphology) and functional (activity) properties of the vessel are expected to change significantly with the presence of vulnerable plaque, and to a lesser extent with other atherosclerotic lesions. Imaging at high (few tenths of micrometers) spatial resolution should be possible in most cases since the IVPA/IVUS probe can be located inside the lumen and near the vessel wall and, therefore, high frequency ultrasound can be utilized. IVUS is routinely used in many cardiac catheterization laboratories to guide interventions, and therefore, all necessary pre-requisites for IVPA/IVUS imaging are readily available. Patients will not be subjected to any additional procedures, and the examination time will not increase to perform combined IVPA/IVUS imaging of the vessel. Both IVUS and IVPA are non-ionizing with no safety concerns. Finally, elasticity imaging or palpography62 can also be integrated with IVUS/IVPA imaging to further enhance the clinical utility of IVUS68,69.
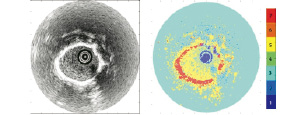
Figure 10. Conventional IVUS image (left) and color-coded image based on automatic classification by Self Organized Map (right).
IVUS RF data analysis for plaque classification using self-organizing maps
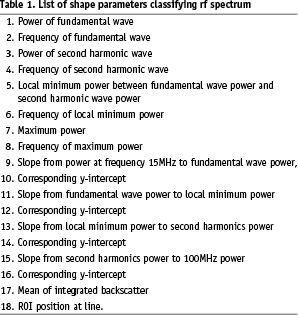
Spectral analysis of radiofrequency (RF) ultrasound signals may allow detailed assessment of plaque composition. The RF spectrum can be classified naturally using a self-organizing map (SOM) algorithm61.
In this analysis method IVUS data are acquired with a commercially available IVUS system with a centre frequency of 40MHz. RF data are digitized and stored in a workstation using an A/D board with a sampling frequency of 500Msa/s and 8 bits resolution. After band pass filtering (15MHz-105MHz) and applying a 128 point Hamming window, the frequency spectrum is calculated for each position using an autoregressive (AR) model of order 1570. Optimized AR spectra are used to compute 18 spectral shape parameters for each ROI. These parameters are listed in Table 1.
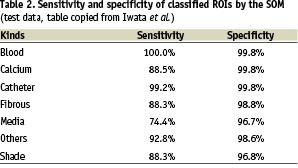
The self-organizing map71 is a neural network application used to classify these 18 parameters into seven categories which may correspond with catheter, shade, blood, fibrosis, calcium, lipid, media and others. In this study, the SOM classifier learned the spectral parameters for training. And then the SOM classifier indexed windowed areas of IVUS data based on these parameters. Finally, tissue maps were reconstructed on IVUS B-mode images based on the SOM. Table 2 gives sensitivities and specificities obtained from a limited initial data set (ref. proceedings).
It is clear that extensive validation is still necessary.
Modulography: elasticity imaging of atherosclerotic coronary plaques
A new imaging technique called Modulography (concatenation of ‘modulus’ and ‘graphy’) has been developed to compute and visualize the elasticity distribution (i.e., the Young’s modulus) of plaques in a so-called modulogram63. It directly shows the type and morphology of the main Thin Cap Fibro Atheroma (TCFA) components since the Young’s modulus is a material parameter that is low for soft tissue and high for stiff tissue.
The procedure begins by computing a plaque’s strain elastogram, [i.e., an image showing the deformation (strain) of the plaque caused by the pulsating blood pressure] using IVUS Elastography or Palpography62,72,73. Then, the plaque’s modulogram is derived from the measured elastogram, as follows74,75: an optimization algorithm iteratively adjusts the shape and stiffness parameters of a TCFA computer-model (Figure 11), until the corresponding computer-model elastogram resembles the measured elastogram; the resulting morphology and stiffness values of the computer-model defines the modulogram.
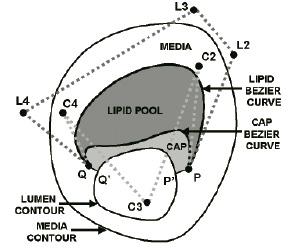
Figure 11. Computer-model of a thin-cap fibroatheroma plaque. The shape of the lipid and cap deformable Bézier curves are determined by the spatial locations of their control points. In this example there are 5 control points used for the lipid curve namely P, L2, L3, L4 and Q, and also 5 for the cap curve, namely P, C2, C3, C4 and Q.
The computer-model’s morphology parameters are the control-points of two deformable curves, one delineates the distal border of the lipid pool, the other the distal border of the cap; these components are assumed homogeneous and their stiffness is characterized by a YM. The inner and outer boundaries of the computer-model are contour-detected from the plaque’s IVUS echogram.
Modulography successfully derived modulograms from simulated and measured elastograms of TCFA plaques. The modulograms clearly showed the morphology and stiffness of the cap and lipid pool; this information is generally not directly identifiable from the echogram or elastogram (Figure 12).
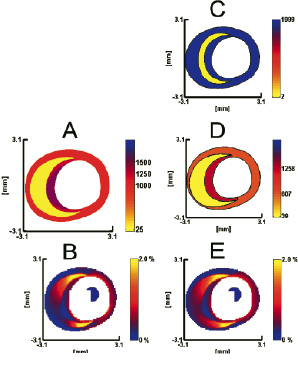
Figure 12. Modulography using a simulated strain elastogram of a thin-cap fibroatheroma plaque; its geometry and elastic material distribution was determined from tracing human coronary plaque histology. (a) Modulogram of the traced plaque; the Young’s moduli of its plaque components are ELIPID=25, EMEDIA=1000 and ECAP=1250 at center / 1500 at side regions. (b) Simulated elastogram computed from a. (c) Default modulogram at the start of the optimization process. (d) Final modulogram at the end of the optimization process, derived from b. (e) Strain elastogram computed from d. Notice the resemblance between elastograms b and e, as well as the similarity between modulograms a and d. Young’s moduli are in kPa and the intraluminal pressure difference is 20 mmHg. The range of each Young’s modulus colour bar is (0-2000) kPa.
The computer-model’s TCFA geometry was essential a priori information that allowed a stable derivation of the modulogram. However, plaques can also be heterogeneous, consisting of multiple regions of soft and stiff tissue. Therefore, we are currently generalizing Modulography, so that it works for arbitrary plaques76. To advance Modulography into the clinic a thorough validation study is required, as well as a pre-processing method for fully automatic assessment of proper elastograms in vivo77. As an addition to IVUS Elastography and Palpography, Modulography has strong potential to become an all-in-one IVUS-based tissue characterization tool for detecting coronary plaques73, for assessing information related to their proneness to rupture30, and for imaging their elastic material composition, all in vivo.
High resolution thermal strain imaging
It is well known that lipids have a negative temperature dependence of the sound speed, whereas water-based tissues have positive temperature dependence. Controlled local temperature modulation can be used to image the spatial distribution of temporal strain produced by changes in sound speed. The opposite sign of the two different tissue types creates the contrast required for resolving the lipid-laden pool within a vulnerable plaque from surrounding water-based arterial wall. High resolution Thermal Strain Imaging (TSI) using an ultrasound (US) microscope was applied to excised porcine tissues63,78. Samples were placed in a temperature controlled water chamber and scanned transversely and longitudinally using a custom high resolution microscope.
An illustration of the experimental system is presented in Figure 13.
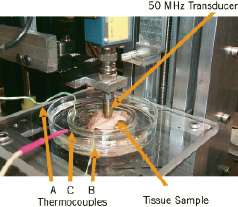
Figure 13. Experimental Set-up: Ultrasound Microscope. The coronary artery sample is held by a clip mounted at the bottom of the inner Petri dish. The outer Petri dish serves as a container for warm water to control temperature. Thermocouples monitor the temperature in the Petri dishes and inside the tissue. The single element transducer is fastened to the positioning slider driven by a stepping motor.
Phase sensitive, correlation based speckle tracking was applied to map the spatial distribution of temporal strain across the sample. TSI differentiated fatty tissue from the water based arterial wall and muscle with high contrast and a spatial resolution of 60 microns for a 50 MHz transducer. Both transverse and longitudinal TSI images compare well with B-Scans of arterial wall structures, including intima, media, adventitia and overlying fatty tissue, as illustrated in Figure 14.
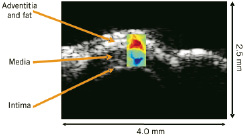
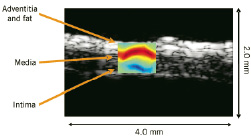
Figure 14. TSI of porcine coronary artery overlaid on the B-Scan. The top is the transverse scan and the bottom is the longitudinal scan. The dynamic range of the TSI is +/- 0.5 % over 4-5oC change in temperature. TSI images correlate well with B-Scans.
High resolution TSI images of coronary artery compare well with B-Scans of the arterial wall structure, including intima, media, adventitia and fatty tissue. This ex-vivo result demonstrates the feasibility of TSI for atherosclerotic plaque detection and monitoring at high resolution. A major obstacle for in-vivo application is tissue motion, including respiratory and cardiac motion. Motion compensation using spatial interpolation and linear least squares fitting can minimize the adverse effect of tissue motion79.
Conclusion
In this paper several new intravascular ultrasound technologies are discussed that have been presented at the 2005 IEEE Ultrasonics symposium. All have high potential, but none is clinically available at present. Still it is clear that the development of IVUS technology is focus of attention in many research laboratories, which will result in the evolution of many high impact applications. Possibilities that are presently beyond the horizon will come within reach in the foreseeable future.