Abstract
Aims: The aim of this paper is to report a method of atherosclerotic plaque tissue characterisation based on pattern recognition and assess its accuracy under conditions of potential clinical relevance.
Methods and results: Excised saline infused human arteries were imaged using IVUS with RF acquisition. 40% of the vessels were re-imaged with human blood infusion. A database of ~12000 image regions-of-interest (ROIs) of histologically established types was used to design a pattern recognition algorithm to predict the tissue type of a given ROI by comparing its RF-spectrum against the database, and also to estimate the confidence of prediction. Ex vivo validation demonstrated accuracies at the highest level of confidence as: 97%, 98%, 95%, and 98% for necrotic, lipidic, fibrotic and calcified regions respectively. Good agreement with histology was shown in an in vivo swine animal model.
Conclusions: Ex vivo validation demonstrated the ability to characterise plaque tissue using an IVUS+RF system and a method incorporating (1) full spectral information (2) spectral similarity (3) estimating confidence of characterisation and, (4) ability to characterise plaque imaged through blood. Promising results were demonstrated in a live animal model. This approach may have potential for accurate and reproducible plaque characterisation in vivo.
Introduction
Plaque rupture is the most common type of plaque complication, accounting for around 70% of fatal acute myocardial infarctions and/or sudden coronary deaths1. The goal of treatment of coronary arterial disease is the prevention of acute coronary syndrome. Intravascular ultrasound (IVUS) is commonly used in conjunction with angiography as an assessment tool to guide treatment of coronary arterial disease. IVUS images, in their traditional greyscale form, significantly add to diagnostic information provided by angiography especially in determining coronary vessel dimensions and borders of plaques. Research initiatives in tissue characterisation seek to develop methods that complement the information provided by IVUS in assessing the composition of plaques such as fibrofatty tissue, necrotic tissue and various stages of thrombus. For example, there would be clinical value in developing a method to distinguish between loose fibrous plaques classified as American Heart Association (AHA) type II or III and atheroma with a lipid core classified as AHA type IV or Va4.
Tissue characterisation methods that have been applied in the clinical setting with some level of success deduce and present information on tissue type using mathematical algorithms that operate directly on greyscale or texture2,3 or by analysing the frequency content of radiofrequency (RF) ultrasound data4,5.
This paper describes a method of tissue characterisation with the novel element of delivering characterisation results supplemented with a measure of confidence for each characterised component. A statistical analysis of accuracy is included.
The process of developing an algorithm to infer tissue type from the spectrum starts with the in vitro recording of radiofrequency signals from a large number of samples of each tissue type of clinical interest. A pattern recognition algorithm then looks at specially tailored “spectral signatures” that maintain their similarity within each tissue type and distinctness between tissue types. The goal is to characterise plaque components on the basis of differing spectral signatures which are caused by differences in acoustic properties of tissue which in turn could arise from differing pathology. A tissue characterisation algorithm is designed by modelling the tissue-induced spectral difference and then calibrating (training) against known tissue types that have been determined through histological analysis. A colour-coded tissue map is then generated with the various tissue types labelled in specific colours.
Methods
The development of an IVUS tissue characterisation system primarily involves the creation of a comprehensive set of ultrasound signals each member of which is established to have originated from tissue of known type. Once the database is built, mathematical techniques are used to understand how tissue type relates to ultrasound signal characteristics, ultimately leading to an algorithm to predict the tissue type given the ultrasound signal. These steps are described in this section.
Ex vivo human data collection
IVUS AND HISTOLOGY: Atlantis SR PRO® 40 MHz single-element mechanically rotating catheters (Boston Scientific Corp, Fremont, CA, USA) were used to acquire cross-sectional ultrasound images of excised human arteries at a pullback speed of 0.5 mm/s and a frame rate of 30 frames per second. The data was from twenty-five hearts that were obtained within twenty-four hours of autopsy. After being dissected and mounted in a tissue fixture filled with phosphate buffered saline (PBS) at physiologic pressure, the arteries were imaged from distal end to proximal end by an automatic catheter pullback procedure. This procedure was repeated with human blood circulating within the lumen at physiologic pressure. The RF data were digitised using a two-board 12-bit Acqiris system (Acqiris, Monroe, NY, USA) at a sampling rate of 400MHz. The RF data was catalogued and stored for subsequent analysis. The vessel tissue samples were then fixed in formalin and sections for histological analysis were prepared every 2 mm using standard laboratory techniques. The sections were stained with Hemtoxylin & Eosin, and Movat Pentachrome to delineate areas of collagen, calcifications, and lipid.
Ultimately, the available data amounted to 120 cross sections representing left anterior descending, left circumflex, and right coronary arteries of which 75 cross sections were imaged through saline and 45 cross sections were imaged through blood. Care was taken to use a number of different catheters in order to add variation in the data.
In vivo animal data collection
DIABETES-INDUCED ATHEROSCLEROSIS: A porcine model involving the administration of streptozotocin in conjunction with a diet high in fat and cholesterol was used in this study to induce atherosclerosis8. The protocol was approved by Harvard’s Institutional Animal Care and Use Committee.
IVUS AND HISTOLOGY: Once plaque formation was established, pullback data was acquired as described above. Coronary arteries from the pigs were harvested and preserved at –80°C. The arteries were frozen cut at the middle of the subsegments of interest and cryosectioned (7 µm sections). Verhoeff’s elastin-stained cryosections were stained with oil red O solution. Infiltration of inflammatory cells into intima was assessed by immunostaining using monoclonal antibody (clone 2A5, BD Biosciences Inc., San Jose, CA, USA) against pig CD45 leukocyte common antigen. Picrosirius red staining was applied to detect collagen types I and III. Olympus BX41 microscope with an Olympus DP70 digital camera was used for the digitisation of oil red O- and CD45-stained sections, whereas picrosirius red sections were digitised by polarisation microscopy (Nikon-Optiphot-2 microscope with Nikon polariser lenses and Sony DFW-SX900 digital camera).
Since the amount of available in vivo animal data is limited, this animal study was considered as a pilot to evaluate the feasibility of applying our algorithm in vivo.
Correlating IVUS and histology
To locate the correct cutting points, two to three major readily visible side-branches were identified on the IVUS pullbacks and used as references for the determination of the location of the cross sections of interest. The same branches were also identified on the harvested arteries by visual inspection. These branches were used as landmarks to correlate histology images and their corresponding IVUS counterparts.
The IVUS and histology images were examined side-by-side and regions corresponding to necrotic, lipidic, calcified, and fibrotic tissue were marked on the IVUS image using image editing tools. A colour-coded tissue map was then generated with the various tissue types labelled in specific colours.
Pattern recognition
PREDICTOR: The local spectrum of the radiofrequency signal corresponding to a location on the IVUS image was used as the predictor of tissue type. Our use of this predictor is similar to that used in5 with some important differences. The local spectrum was computed by averaging the magnitude of the windowed spectrum from 128 RF samples over five adjacent A-lines (Figure 1).
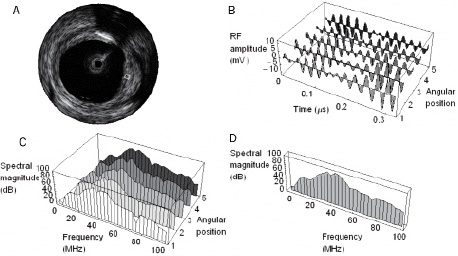
Figure 1. Computing the local spectrum. A specific region-of-interest (ROI) on an IVUS image is shown in (a). The raw radiofrequency signals along 5 adjacent A-lines comprising this ROI are graphically represented in (b). The individual spectra corresponding to these signals are in (c). The average of these 5 spectra yields the spectrum shown in (d). This local spectrum encodes information about the nature of the tissue within the ROI. This is the feature used by the pattern recognition algorithm to characterise tissue within the ROI.
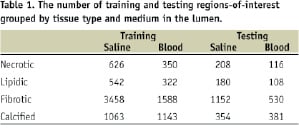
These regions-of-interest (ROIs) were uniformly distributed over all plaque regions that could be identified. The first 32 frequency bins representing a range of frequencies from 0 to 100 MHz were retained. Since we wish to represent predictors originating in saline-filled vessels and blood-filled vessels in a uniform way, the last element of the predictor is replaced with a 0 for saline or 1 for blood. We will continue to refer to these objects as “spectra” for simplicity. In the final tally, a set of about 12,000 predictors along with their known tissue type labels (classes) were available for classifier design and accuracy assessment. This set was randomly partitioned into a training set and a testing set containing 75% and 25% of the predictors, respectively. The number of training and testing predictors grouped by tissue type and lumen medium is given in Table 1.
CLASSIFIER: The basic concept invoked to infer tissue type from the spectrum is spectral similarity. The use of this concept makes it possible to characterise the tissue type by comparing the spectrum from an area on a vessel to entries in a library of spectra corresponding to known tissue types. The comparison is made possible by means of a mathematically defined measure of similarity between any two given spectra (Euclidean distance). Figure 2 illustrates the process of comparing the spectrum (grey spectrum, copied four times) from a region of unknown type to entries in a simple library of spectra (coloured spectra).
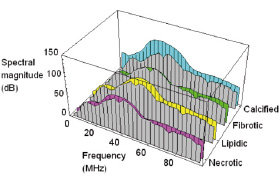
Figure 2. The principle of spectral similarity. The spectrum from a region of unknown type (grey) is shown superimposed against representative spectra of necrotic, lipidic, fibrotic and calcified types (coloured spectra). Clearly the grey spectrum would be recognised as having originated from fibrotic tissue.
In this example, the input spectrum is seen to be most similar to the fibrotic entry in the library and, hence, the corresponding ROI would be recognised as of fibrotic type.
The final form of the classifier (Figure 3) was obtained as described below by building around this basic concept.
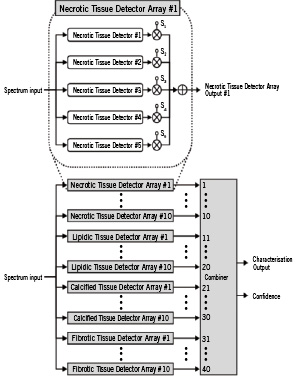
Figure 3. The architecture of the tissue characterisation classifier. The basic units in the classifier are spectral similarity detectors specifically tuned to a particular tissue type, e.g. Necrotic Tissue Detector #1. Several of these are assembled into an array, e.g. Necrotic Tissue Detector Array #1. The final form of the classifier contains a bank of 40 such arrays arranged in 4 groups of 10. Essentially, the bank takes in a spectrum from an ROI and processes it to yield a mathematical entity, a set of 40 numbers that more clearly distinguishes between tissue types. The final block called the Combiner takes in that set of 40 numbers and makes the final call on tissue type by checking the positions of high numbers in the set. The Combiner also outputs a confidence estimate by checking the degree of similarity between its input and ideal expected patterns corresponding to the recognised tissue type.
Basic tissue detectors: The basic units in the classifier are detectors specifically tuned to a particular tissue type, such as the unit labelled “Necrotic Tissue Detector #1” in Figure 3. This detector contains a small library of spectra corresponding to necrotic and non-necrotic tissue and, thus, has the ability to perform spectral similarity comparisons. The library associated with this detector is constructed such that it is more likely to output a +1 when presented with a spectrum from necrotic tissue and a –1 when presented with a spectrum from one of the other types. The units labelled “Necrotic Tissue Detector #2 through #5” contain similar (but not identical) small libraries of spectra corresponding to necrotic and non-necrotic tissue.
Tissue detector arrays: Using concepts of classifier combination7, it is possible to carefully design the five basic detectors described above so that with a high degree of certainty a weighted combination of the five outputs rises above zero when the “array” is presented with a spectrum from necrotic tissue, and falls below zero when presented with a spectrum from one of the other types. Note that the output of such an array is no longer a binary number. Rather than designing a single necrotic detector array by utilising all available training data, it is advantageous to design several (ten in Figure 3) necrotic detector arrays by letting each array be built by utilising randomly selected subsets of training data. Other tissue types are treated similarly.
Bank of tissue detector arrays: The final form of the classifier contains a bank of several such arrays. In Figure 3, we show 40 such arrays arranged in four groups of 10. Essentially, the bank takes an input spectrum and processes it to yield a set of 40 real numbers. The power of the classifier bank can be appreciated by regarding its output as a more discriminatory replacement for the input spectrum. For example, when presented with a spectrum from lipidic tissue, the classifier bank produces an output in which elements 11 through 20 are stronger than others – while this simple interpretation is not observable in the original spectrum (Figure 4).
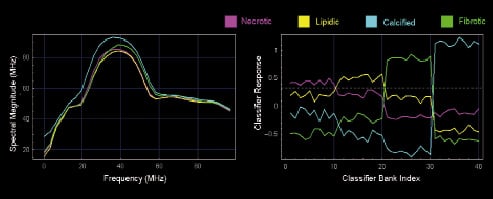
Figure 4. Comparison of distinctness of spectra and classifier bank output across tissue types. The left panel shows four example spectra, one from each tissue type. The corresponding classifier bank output on the right clearly shows each tissue type peaking in a distinct band. The dashed horizontal line can be used to determine the band where peaking occurs and hence determine tissue type.
Combiner: The final block called the “Combiner” takes in the set of 40 numbers and makes the final call on tissue type. In its simplest form, it can accomplish this by checking which of the numbers in the set are positive and which are negative. The final implementation employs a simple Bayesian classifier7.
CONFIDENCE: A novel aspect of this tissue characterisation algorithm is that it not only characterises tissue, but it also provides a measure of the confidence for each ROI characterised. Confidence is computed within the combiner by checking the degree of similarity between a given 40-element bank output and ideal expected patterns corresponding to the recognised tissue type. While the characterised tissue type is represented as colour, the confidence is represented as transparency with high confidence characterisations shown with more solid colour.
Ex Vivo validation
Validation of the spectral similarity algorithm was performed using a five-step process:
1. Mean spectra were computed for ROIs of histologically determined type
2. The spectra were randomly partitioned into test and training sets: 75% of the spectra were used for training the spectral similarity algorithm and the remaining 25% were used as the test set
3. The spectral similarity algorithm was then used to classify the test set
4. Steps 2 and 3 were repeated four times to reduce possible bias from the test set selection
5. The accuracy9 of the algorithm was computed by comparing the characterisation of each sub-region against the known histological tissue type.
Results
The bar chart in Figure 5a summarises the accuracy of ex vivo tissue characterisation of human coronary artery infused with blood.

Figure 5a. The accuracy of the spectral similarity algorithm. For tissue regions characterised with the highest confidence (75-100%) the accuracy ranges from 95% to 98%.
The accuracy of the similarity algorithm in characterising each of the four tissue types is shown grouped by confidence measure. For tissue regions characterised with the highest confidence (75-100%) the accuracy ranges from 95% to 98%. Even at the lowest confidence (0 to 25%) the accuracy is above 70%. The accuracy increases monotonically with confidence, confirming that the confidence measure computed by the algorithm may provide an estimate of the probable accuracy of the classification on a pixel-by-pixel basis.
Figure 5b shows the Bland-Altman plot of expert-marked-area versus algorithmically-determined-area of plaque components in the same 30 frames.
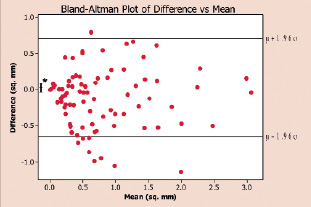
Figure 5b. Bland-Altman plot of expert-marked-area versus algorithmically-determined-area of plaque components in the same 30 frames. The uniform distribution of the points in is indicative of the agreement between the expert and the algorithm.
In vivo animal study: Using the animal data available, we were able to qualitatively verify the correctness of the predicted tiss
A Bland-Altman plot is a qualitative method of data plotting used to graphically confirm agreement between two different methods of measurement of the same parameter. The uniform distribution of the points is indicative of the agreement between the expert and the algorithm.
Figure 6 shows a conventional grey-scale IVUS image compared with a colour-coded image characterising different tissue types in an ex vivo section of human coronary artery infused with blood.
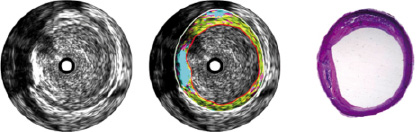
Figure 6. A conventional grey-scale IVUS image (left) compared with a colour-coded image (centre) characterising different tissue types in an ex vivo section of human coronary artery infused with blood. The plaque in the centre image was coloured by the automated tissue characterisation algorithm described in this paper. This characterisation essentially conforms to that produced by histological analysis (right). The colours map to tissue types as follows: Cyan: calcified/dense tissue, green: fibrotic tissue, yellow: lipidic tissue and magenta: necrotic tissue.
ue types. An example is shown in Figure 7.
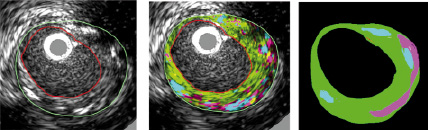
Figure 7. In vivo animal study demonstrating tissue characterisation. The accuracy of this characterisation is confirmed by the image on the right which shows the location of important plaque components identified by an expert review of histology. Note the ability of the algorithm to reproduce the distribution of calcified (cyan) and necrotic (magenta) tissue seen in histology. The colours map to tissue types as follows: Cyan: calcified/dense tissue, green: fibrotic tissue, yellow: lipidic tissue and magenta: necrotic tissue. (In vivo IVUS image from porcine model, histology, and interpretation courtesy of Yiannis S. Chatzizisis, MD, Brigham and Women’s Hospital, Boston, MA, USA)
While a quantitative comparison should be the ultimate test of the algorithm, we have presented this result depicting plaque types and distribution for this animal study to show that the method broadly delivers the expected characterisation. Quantitative results from a more carefully planned animal study are forthcoming.
Discussion
The approach to tissue characterisation described in this paper differs significantly from other IVUS-based methods in four aspects:
FULL SPECTRUM: The characterisation uses the entire usable spectrum from 0 to 100 MHz. While this approach involves more mathematical calculations than algorithms using reduced or summarised data, it increases the chances of correctly recognising tissue type by avoiding discarding any potentially useful information. Effectively, we let the entire algorithm determine the optimal use of information in the spectrum.
SPECTRAL SIMILARITY: This approach characterises the tissue type in a direct way by comparing the spectrum from an area on a vessel to entries in a library of spectra corresponding to known tissue types. By comparing spectra directly, we avoid having to infer tissue type using secondary derived features whose discriminating properties have not been established. Again, we let the layered arrays of detectors adapt to the training data and determine the optimal use of information in the spectrum.
CONFIDENCE: The method not only classifies tissue into four categories but it also provides a measure of the confidence in the characterisation of each region of interest. This feature is designed to distinguish between the characterisation of two regions both being recognised as lipidic – but with one region whose spectral properties make it slightly closer to lipidic than necrotic, and another region whose spectral properties are clearly those of lipidic tissue. The confidence adjusts the transparency of colour on the characterised image.
TRAINING WITH BLOOD AND SALINE: This approach employs an extensive library of spectra which includes data acquired from vessels filled with blood in addition to those more conventionally obtained from saline-filled vessels. The spectrum altering properties of blood are well-known and the algorithm takes this into account to ensure that the tissue characterisation system calibrated using in vitro data will work correctly in vivo. The example in Figure 7 demonstrates that this is indeed feasible. A more systematically designed animal study is underway to quantify the performance of the algorithm.
The algorithm described in this paper has a number of features intended to enhance tissue characterisation. For example, it combines the directness and accuracy of similarity-based methods with the ability of model-based methods to understand the training data to classify new data (generalisation). Having a large and diverse collection of independently designed classifiers is known to produce a more accurate classifier. In this respect the algorithm shares many advantages of a relatively recent class of algorithms called random forests10. This includes the ability to train rapidly and be stable in situations where the number of training examples varies vastly across tissue types. This enables characterisation of new data sets that the algorithm has not been trained on. Consider that the algorithm works well on in vivo pig data (Figure 7) although it is trained on ex vivo human cadaver data.
Challenges remain in developing a tissue classification algorithm with the ability to produce consistent results in a real world clinical setting. Anatomical variation, overlap in the acoustic properties of different tissue types, variations in the properties of IVUS transducers, and modifications to the information carrying signals caused by the passage of radiofrequency waves through intervening tissue and/or blood may lead to inconsistencies and inaccurate results.
Of particular interest is the characterisation of tissue behind calcium areas or within necrotic areas. The RF signal corresponding to these areas may represent noise, leading to incorrect characterisation. To some extent, the low confidence measure associated with these regions may successfully prevent incorrect interpretation. While dense calcium severely attenuates ultrasound, we have observed a characterisable level of low frequency energy in some cases, depending on the density and thickness of the calcium layer. One of our efforts to optimise the algorithm will seek to label as “unknown” the problem areas such as those occurring behind calcium and within guidewire artifacts.
Our future efforts to validate the method will involve additional ex vivo studies, in vivo animal validation studies and eventually patient studies involving DCA or heart transplantation.
The development of a reliable and accurate tissue characterisation system will help efforts to classify plaques with the highest probability of spontaneous rupture. The information obtained from tissue characterisation in combination with an understanding of the natural history of coronary artery disease may translate into a meaningful treatment protocol that decreases patient morbidity and mortality. Leading research in tissue characterisation seeks to provide new levels of anatomical detail and new dimensions of information for the diagnosis of disease. This work represents a step towards that goal.
Conclusions
The results of ex vivo validation have demonstrated the ability of this spectrum based approach in characterising plaque tissue using radiofrequency signals from a 40 MHz IVUS imaging system. The accuracy is sufficiently high for all tissue types with a low dependency on the medium in the lumen (saline or blood). Promising results have been demonstrated in live animal models as well. The approach has the potential to yield accurate and repeatable tissue characterisation in vivo.
Acknowledgements
The authors would like to thank Jennifer Lisauskas and Stephen Sum, at InfraRedx (Burlington, MA, USA), who developed the artery fixation cage and collected IVUS data. The ex vivo data were provided by a collaboration project with Columbia University. The histology samples were processed at CVPath (Gaithersburg, MD) under the supervision of Dr. Renu Virmani. In vivo IVUS image from porcine model, histology, and interpretation is courtesy of Yiannis S. Chatzizisis, MD, Brigham and Women’s Hospital, Boston, MA, USA. This study was funded by Boston Scientific Corporation.