Abstract
Aims: The aim of this prospective study was to evaluate the feasibility and accuracy of a recently developed 3D system (CardiOp-B; Paieon Medical Ltd., Israel) as compared to a validated quantitative coronary angiography (QCA) system (Siemens Quantcor, Siemens Medical Solutions).
Methods and results: In patients scheduled for heart catheterisation, minimal lumen diameter (MLD) and diameter-derived percent stenosis (DPS) were obtained for CAS (>50%) using both QCA and the 3D-system. To estimate stenosis length, a non-inflated balloon was inserted into the stenosis and the distance between balloon markers was measured using both methods and then compared to the known distance between the markers. In 61 patients 79 lesions were analysed. MLD measurements showed a good agreement between QCA and 3D with a mean difference of 0.08±0.035 mm. Reference diameter was 2.61±0.67 for 3D and 2.42±0.61 mm for QCA and 54.79±9.20% vs. 58.75±8.15% for the %-stenosis range, respectively. The mean true balloon length was 12.8 mm±3.8 mm. Lengths determined by the 3D system were 13.0±4.0 mm and 11.3±3.8 mm by QCA, respectively.
Conclusions: Evaluation of CAS using the novel 3D system was feasible and showed equivalent results to validated QCA measurements. Length measurements seemed to be more accurate by the 3D system as compared to QCA. Therefore, this 3D-system can be used to guide decisions in interventional cardiology.
Introduction
Visual analyses of coronary artery stenoses (CAS) is limited by a poor accuracy and a high inter- and intra- observer variability1,2. It is for this reason that quantitative coronary angiography (QCA) systems were developed, to provide for a more objective and reproducible evaluation of CAS3-5. Although these systems allow a precise measurement of the degree of CAS, there are still differences in the accuracy of different QCA-systems6,7. The fact that these systems are based on one single projection limits its use for the assessment of vessel anatomy and stenosis morphology.
Two-dimensional (2D) analysis is also subject to foreshortening effects, inhibiting accurate lesion length assessment1. Since it is based on two angiographic projections, 3D coronary analysis provides a more comprehensive analysis by overcoming the foreshortening effects8-10. The recently developed 3D-system (CardiOP-B, Paieon Medical Ltd., Israel) integrates information from two to three angiographic projections to create a 3D-reconstruction of an arterial segment. This system analyses vessel contour as well as contrast density allowing real time geometrical and quantitative information on the vessel structure.
The aim of the study was to evaluate the feasibility and accuracy of this 3D-system regarding stenosis quantification and length measurement, comparing it to a well validated 2D-QCA system (Quantcor; Siemens Medical Solutions, Forchheim, Germany11) in patients with CAS.
Methods
Coronary angiography
Diagnostic coronary angiography and percutaneous coronary intervention (PCI) was performed according to current standard practice using 6 Fr catheters. Vessels were visualised by an anionic contrast medium after an intracoronary bolus injection of 0.2 mg of Nitroglycerin during angiography.
Inclusion criteria for the study were: lesions > 50% diameter stenosis as assessed by visual estimation in a major coronary artery, at least one lesion of a major vessel, up to three lesions per patient, and adequate epipolarity conditions for creating a 3D reconstruction.
Exclusion criteria were an ostial location of the lesion, total occlusion or TIMI 0-1 flow after introduction of the guidewire or of the non-inflated balloon. Also, cases in which two adequate views for 3D reconstruction could not be obtained, either due to poor contrast filling or due to overlapping vessels were excluded. Before inclusion all patients had given written informed consent.
For reconstruction of 3D diagnostic sequences, contrast medium (Hexabrix®, Schering, Germany) was injected into coronary arteries and images were obtained from two different projections. During PCI, a reconstruction of the vessel with the non-inflated balloon in the centre of the stenosis was performed.
A guiding catheter calibration method was used, in which the catheter size can be inserted in “Fr”. Calibration was performed at the catheter tip in the same end-diastolic frame for both systems without contrast medium inside.
Quantitative coronary angiography
QCA, using 2-dimensional analysis was performed according to standard protocols11. As manual edge correction was not available on the 3D system, it was not applied in the QCA analysis. Therefore only those lesions were included for further analysis, in which manual correction not was indicated. QCA analysis was performed on each of the two images that were used to create the 3D reconstruction. MLD and percent stenosis measurements were based on a diameter analysis that were automatically determined by that system. Further parameters were additionally created: reference vessel diameter (RD) and %-stenosis. Additionally data about the calculated area parameters by densitometry and by calculation of the circle formula were available.
Three-dimensional analysis
The 3D-analysis was performed with the CardiOp-B, Version 1.5.7. For this purpose the lesion was identified in two angiographic views of either the diagnostic or the balloon image sequence. Catheter calibration was performed on the first view that was analysed. In each view, reference diameters were marked proximally and distally to the lesion in segments without stenosis. A third marker was placed into the centre of the lesion at the MLD-point. After this procedure, the system automatically presented a 3D-reconstruction of the vessel. MLD and diameter percent stenosis values were obtained from diagnostic reconstructions (Figure 1).
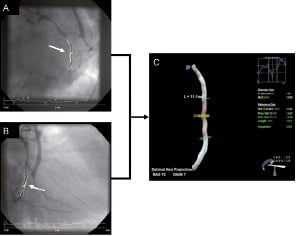
Figure 1. Coronary angiography and 3D-reconstruction of the bypassed circumflex coronary artery. Panel A shows the left anterior oblique (LAO) view and Panel B the right anterior oblique (RAO) view of the same vessel. The arrows point to the lesion zone, which are marked as white lines by the automatic contour detection of the QCA-system. Panel C shows the 3D-reconstruction of the same coronary artery. Note that the CABG is not depicted in 3D-reconstruction. The proximal reference diameter (RD) of the CX-artery was 2.41 mm, the distal RD was 2.45 mm and the RD at MLD-point was 2.43 mm. The lesions length was caluculated with 11.1 mm, the MLD with 0.90 mm and the diameter stenosis was 63%. The white lines represent the automatic contour detection of the 3D system.
In cases with poor epipolarity geometry, i.e. the two chosen views were not geometrically compatible, one of the views was changed and an additional attempt was made. The 3D reconstruction was performed within 1±3 minutes during the procedure.
The data generated by the 3D system were based on the identification of the minimal lumen area (MLA) of a CAS. For 3D reconstruction MLD was calculated automatically based upon MLA measurement. Further parameters were reference vessel area and percent stenosis at MLA.
Comparison of QCA and 3D measurements
The 2D QCA, as well as the 3D system, calculate results based on densitometry. Identical end diastolic frames were used for analysis. Due to the eccentricity of the lesion, both systems could determine minimal lumen dimensions at different sites, which was MLD for QCA and MLA for 3D. For QCA, the view with the smallest MLD was selected for comparison.
Length measurements were obtained from the non-inflated balloon reconstruction by positioning the system´s length bars on the balloon markers, which were visible in the images. This was performed for both systems. For the length measurements with 2D-QCA, the image with the fewest foreshortening was chosen.
In all cases the operator was blinded to the true distance between the markers. The true length value was defined as the distance between the markers on the non-inflated balloon. This distance was provided by the manufacturer.
Statistical analysis
CAS were classified by location and lesion type according to the ACC/AHA classification12. Linear regression analysis and Pearson correlation were used to compare the QCA and the 3D-reconstruction. Student t-test was applied to compare the differences of the QCA and the 3D system with the true balloon sizes as well as to compare QCA and 3D measurements.
Bland-Altman analysis compared the difference between measured balloon length of each system to the known length of the non-inflated balloon as well as MLD and stenosis degree between the two systems. Statistical analysis was performed using a commercial tool (Microsoft SPSS 10.1). A p-value < 0.05 was considered significant for all statistical analysis.
Results
Patient characteristics
Sixty-one consecutive patients (19 female, 42 male), who presented with stable coronary artery disease (Canadian Cardiology Society [CCS]-class II-III) were included in the study. All underwent diagnostic catheterisation and/or PCI in our clinic with coronary artery stenosis of > 50%, visually confirmed by angiography. The mean age was 66±12 years and left ventricular ejection fraction was 58±13%. Nine patients (15%) had single-vessel disease, 18 patients (30%) double-vessel disease and 34 patients (55%), triple-vessel disease. Two patients (3%) had undergone a prior CABG procedure. In 51 patients (83%), this was a repeat coronary angiography; and in 10 patients (17%) this was the first coronary angiography. Forty-one patients (67%) had a history of prior PCI, with implantation of a coronary artery stent in 38 patients and without implantation of a stent in three patients, whereas for 20 patients (33%) this was the first PCI.
Calibration factors
The calibration factor for the 3D reconstruction group was 0.20±0.02 and for the 2D-QCA group 0.18±0.02.
Lesion analysis
Seventy-nine lesions in 61 patients were identified. Of these, 10 were excluded due to insufficient edge detection (2D QCA: n=5; 3D: n=5). Five of these 69 lesions were excluded due to the lack of availability of two projections, four were excluded due to ostial location, and four due to incomplete filling of the vessels with contrast media. Thus, 56 stenoses were evaluated for MLD comparison and length measurements. In none of the lesions was there a stent implanted from prior PCI. Twenty-four stenoses (43%) were located in the circumflex artery (CX), 17 (30%) in the left anterior descending artery (LAD), 14 (25%) in the right coronary artery and one (2%) in the left main stem (LM).
According to the ACC/AHA-classification12, simple lesions were present in 26 cases, three (5%) type A-lesions and 23 (41%) type B1 lesions. Complex lesions were detected in 30 cases, 21 (38%) type B2 lesions and nine (16%) type C lesions.
Comparison between 3D and 2D regarding diameter function
The absolute values for MLD and associated parameters are listed in Table 1.
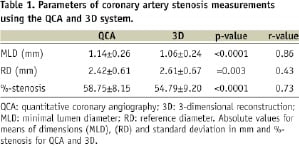
The mean difference of MLD measurements between both techniques was 0.08±0.035 mm, which was in the range of the specification for both systems (95% CI), (Figure 2a).
For percent diameter stenosis, there was also only a small difference between 3D and the QCA system (QCA 58.75±8.15, 3D 54.79±9.25, 95%CI -29.0% - 11.6%, (Figure 2b).
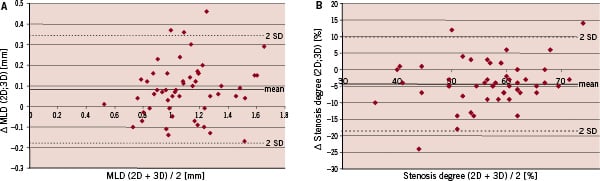
Figure 2. Figure 2a: Bland-Altman plot of the MLD differences between 2D and 3D QCA. Y-axis shows the difference between 3D and 2D measured MLD in mm. X-axis signifies the average of 2D and 3D measured MLD in mm. Figure 2b: Bland-Altman plot of the stenosis degree differences between 2D and 3D QCA. Y-axis shows the difference between the different stenosis degree measurements for each stenosis evaluated by 2D and 3D. X-axis signifies the average of 2D and 3D measured %-stenosis values.
Results of length measurements
The mean true balloon length was 12.8mm±3.8mm. Lengths determined by the 3D system were 13.0±4.0mm and 11.3±3.8mm by QCA respectively.
Bland-Altman analysis yielded a mean difference (2D-bias) of 1.5±0.3 mm between true length and length as calculated by QCA, and of 0.15 ±0.1 mm between true length and length as measured by 3D. The 95%-CI of the 2D system was –2.5 mm to 5.5 mm, compared to a confidence interval of –1.6 mm to 1.3 mm for the 3D system (Figure 3a and 3b).
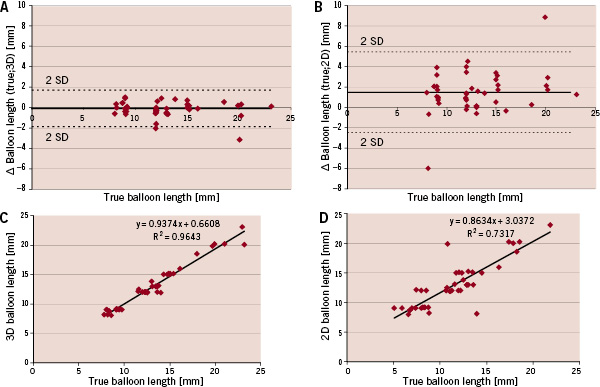
Figure 3. Bland-Altman Plots of differences between true and 2D measured as well as true and 3D measured balloon lengths and correlations of 2D and 3D measured balloon lengths to true balloon lengths. Y-axis in 3a and 3b shows the difference between true and 3D measured balloon length (3a) and true and 2D measured balloon length. X-axis shows the true length in mm. 3C and 3D show the correlations for 3D and 2D measured balloon lengths in mm (y-axis) and the true balloon length in mm (x-axis)
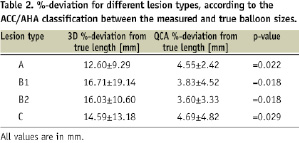
The overall correlation between the 3D measured balloon-sizes and the true balloon length was r2=0.96 (p<0.0001) as compared to r2=0.73 (p<0.0001) for the 2D system (Figure 3c and 3d). There was a significantly better correlation between true lengths and 3D for both simple and complex lesions as well as for all examined major vessel segments compared to QCA (Table 2).
Discussion
The 3D-reconstruction system was developed to improve visualisation and diagnostic information of two dimensional angiographic views of coronary artery stenoses.
The major finding of our study was that coronary artery diameter measurements were comparable, and stenosis length measurements were even more accurate, using the novel 3D system as compared to conventional 2D-QCA.
In a comparison between CAAS 5 and CardiOp B using an animal model, Ramcharitar et al19 performed quantitative assessments in stenotic phantoms, which were implanted in the coronaries of four pigs. Using phantom measurements, the authors showed that in 21 angiographic images the CardiOp B-system significantly underestimated the MLD, while both systems significantly overestimated the MLD at the minimal lumen area point. In our in vivo study, we could verify that in terms of diameter stenosis, the new system determined MLD values and diameter-based degrees of CAS with good correlation to 2D QCA measurements. Our results are consistent with the findings of Tsuchida et al18. Despite the fact that there was a better accuracy regarding MLD-measurements for 2D-QCA in phantoms in comparison with optical coherence tomography (OCT), they found a good agreement between 2D and 3D measurements for diameter measurements.
Comparing the results for percent diameter stenosis, we found a more accurate stenosis determination by the 3D system than using QCA. The bias of 0.08 was within the published acceptance criteria for precision of QCA systems, which was 0.13 mm11,13. Since 2D QCA was regarded as the “gold standard” for vessel diameter measurements this results confirm the applicability of the 3D system for diameter measurements.
In terms of determining stenosis length, 3D measurements seemed to be superior as compared to QCA regardless of vessel type and lesion classification.
The bias for the 3D measurements was –0.15 mm, which is nearly ten times smaller than the bias of the 2D system, which was +1.5 mm. The fact that the 2D-QCA bias was positive, indicated that the measured values were smaller than true. This supported the hypothesis that 2D analysis is susceptible to foreshortening effects. The smaller 95%-confidence interval for the 3D system suggested a higher reliability of the new system compared to QCA for length measurements.
Due to its two-dimensionality, QCA may not reflect the length of a stenosis accurately and is subject to foreshortening, to vessel overlap and tortuosity. Using 3D-reconstruction, Green et al showed that in 156 vessel segments of 149 patients, vessel foreshortening was greater in expert recommended views compared to computer generated views. Expert recommended views frequently resulted in more foreshortening than computer generated optimal views, which had only 0.5%±1.2% foreshortening with < 2% overlap for the same 156 segments. Optimal views differed from the operator-selected working views by more than 10 degrees in over 90% of vessels and frequently occurred in entirely different imaging quadrants. They concluded, that vessel foreshortening occurs frequently in standard angiographic projections during stent deployment10.
This is confirmed by our findings. The 2D-QCA reconstruction of balloon length, which reflects the 2-dimensional working view of the operator showed a significantly higher foreshortening than the 3D view.
Furthermore, the smaller 95%-confidence interval for the 3D system, found in our study suggested a higher reliability of the new system compared to QCA for length measurements.
The resultant accuracy and precision of the 3D system is also in the range of IVUS-length measurements. Fuessl showed in 105 patients comparing the IVUS-measured stent-length with the manufacturer supplied stent length a bias of 0.45 mm and 95%-confidence intervals of –1.1 to 2.0 mm14.
Our results are consistent with other studies. In a recent trial, Gradaus et al20 correlated 61 stents during high-pressure inflation with the predefined sizes and the results of the 3D-reconstruction. They found a high linear correlation between the real vessel size and the obtained vessel dimension, with the highest correlation for stent length measurements.
Gollapudi and coworkers showed previously15 with the same system that 3D reconstruction can optimise the choice of drug eluting stent (DES) length and number during PCI and can help to reduce the number of stents implanted. In a total of 42 consecutive lesions they calculated the optimal stent length and number with 3D-reconstruction and compared it with the number and length of DES actually chosen by the operator. They found that the optimal stent number calculated by 3D was less than the actual number chosen by the operator. There was a trend that the optimal stent length was less than the actual stented length.
Dvir et al also showed, in 38 images of 11 patients, that 3D reconstruction was more precise than QCA in comparison to inter-observer variability, lesion length assessment, RD, MLD and MLA16. However, their studies were performed with a much less established and validated software (Medview).
Clinical implications
The major clinical advantage of this 3D-system is that it offers new strategies for PCI. Stent selection and sizing can now be based on exact and reliable measurements with a relevant reduction of misleading effects. These are present in QCA and visual estimation, as they represent only 2D views of 3D coronary artery morphology.
Another main advantage of the 3D system might be its support for therapeutic strategy planning in patients with reduced renal function or renal failure. Using the system in a real time mode might reduce the number of angiograms needed for an accurate intervention and allow planning of the CAS intervention using two projections with a good understanding of the vessel morphology and tortuosity.
It also provides additional morphologic information, like changes in vessel structure caused by stent placement in bifurcated lesions as shown by Dvir et al17. As the number of patients with complex coronary artery lesions which are treated interventionally still is increasing, it is necessary to quantify these complex lesions quickly, precisely and reliably online. In this respect, the 3D software seems to have visible advantages compared to the 2-dimensional QCA systems.
Limitations
The 3D reconstruction of the coronary arteries were based on two 2D projection images. Therefore all angiographic limitations, like an insufficient edge detection etc., held true for both, 2D and 3D reconstruction.
In an attempt to take into consideration comparable parameters, we tried to minimise any manual influence on the results and to reduce user interactions to a minimum. Therefore, only those lesions with a correct edge detection, in which manual correction was not indicated, were included for further analysis.
Another main limitation concerns vessel diameter and the lack of a gold standard applicable for vessel diameter quantification. A validation study of diameter with IVUS or OCT would have strengthened our results regarding diameter measurements, but this was not performed in the present study.
Conclusion
Evaluation of coronary artery stenoses diameters using the novel 3D system was feasible, and showed equivalent results to validated QCA measurements. In comparison with common QCA systems, it offers a higher accuracy and precision for lesion length determination and can thus support the cardiologist in selection of the interventional strategy and stent sizing during interventional procedures.