Introduction
Raman spectroscopy is a powerful technique that can be used to characterise the chemical composition of biological tissue1,2. The methods used to collect Raman spectra are relatively easy to follow. Basically, light of a single wavelength is directed onto a sample, and then light scattered from the sample is collected and launched into a spectrometer. The spectrometer separates the light according to its wavelength, like a prism spreads sunlight into a rainbow. This rainbow of light is projected onto a detector which can record the intensities of each colour of light. A plot of these light intensities as a function of wavelength is called a spectrum. In Raman spectroscopy applications, the spectrum abscissa is measured in units of wave-numbers, or inverse wavelength (cm–1), which is proportional to the energy of the light.
A Raman spectrum of a given molecule is unique, which makes Raman spectroscopy ideal for detecting, identifying and diagnosing diseases that involve gross chemical changes in tissue, such as atherosclerosis. Raman spectra of arterial tissue can be obtained by processing the collected light that is scattered from an artery as it is illuminated with a laser beam. Since Raman spectroscopy is non-destructive, one can collect spectra of the tissue in situ, which can be processed to provide quantitative information about the chemical composition of an arterial wall.
Raman spectroscopy is capable of assaying the chemical compositions of artery tissues and diagnosing human atherosclerotic plaques3-10. By coupling Raman spectroscopy technology with optical fibres, one can collect Raman scattered light from otherwise inaccessible locations and route the collected signal to spectrometer systems for analysis. Previously we fabricated Raman optical fibre probes that utilised a region of the Raman spectrum called the “fingerprint” (FP) region (< ~1800 cm–1 shifted light) to conduct remote assays, but unfortunately these collected spectra were typically corrupted by Raman signal from the fibres themselves11-12. In order to collect uncorrupted FP Raman spectra, one must incorporate complicated optics and filters on the tips of catheters and often these designs need multiple fibres13-17.
New developments that utilise another region of the Raman spectrum, called high wavenumber (HW) Raman shifted light (> ~2500 cm–1 shifted light), have enabled one to collect quality Raman spectra remotely via a single optical fibre, greatly simplifying the size and complexity of the catheter and making it commercially feasible18-19.
Indications for use
The vPredict™ Optical Catheter System is being designed to rapidly analyse materials within arterial walls during a procedure referred to as an Optiography™ Scan. Using advanced optical analysis techniques, the system is intended to detect and display the chemical composition of atherosclerotic plaques.
Technical specifications
Instrumentation characteristics
We designed an intravascular HW Raman system to deliver excitation light to and collect scattered light from multiple locations within coronary arteries via a disposable catheter. Each location in the arterial wall is illuminated by <25 mW of ~671 nm wavelength light via an optical fibre, and the resulting scattered light is collected by the same optical fibre and guided to a spectrometer where it is processed and analysed in the ~825 nm to ~850 nm wavelength range (~2800 cm–1 to ~3100 cm–1). An individual measurement currently requires ~200 ms collection time, and recent catheter material improvements will likely reduce the acquisition time to <100 ms.
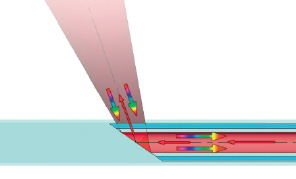
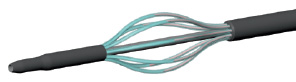
A single HW Raman sensor is illustrated in Figure 1a. Laser light is coupled into an optical fibre and guided in the catheter to a target site within an artery. The distal end of the output fibre facet is angled to direct excitation light onto the vessel wall, and the resulting scattered light is collected by the same fibre and guided back through the catheter to a spectrometer system. To provide circumferential sampling of an arterial wall, the catheter includes multiple sensors that are evenly distributed circumferentially, as shown in Figure 1b.
a
b
Figure 1. Schematic diagram of a single sensor (a) used to collect Raman scattered light. Laser light is coupled into an optical fibre and guided to a target site within an artery. The fibre facet is angled to direct the laser light onto the vessel wall, and the resulting scattered light is collected by the same fibre and guided back through the catheter to a spectrometer system. The entire fibre is housed in polymer tubing to protect the fibre and arterial wall. An assembled catheter (b) consists of 8 single sensors that are equally spaced around the circumference of the artery.
The collected light gathered by each sensor is guided to a spectrometer, where it is individually analysed. Measured spectra of the arterial wall are fit to calibrated spectra of known compounds to provide relevant qualitative and quantitative measures of vessel composition, including cholesterol, cholesterol esters, triglycerides, and proteins.
The catheter can be withdrawn, either manually or automatically, to collect sequential spectra along the length of the vessel. If the pullback is at a constant rate (e.g. ~0.5 mm/second), the location within the artery of the distal end of the catheter sensors is inferred with knowledge of the elapsed time after pullback initiation. Initial positioning of the catheter relative to the surrounding anatomy can be determined with fluoroscopy utilising radio-opaque markers on the catheter distal end, and relative angular positioning can be ascertained by registration of the proximal catheter fibres with the distal catheter end.
Raman spectra in the high wavenumber region
Representative HW Raman spectra are shown in Figure 2.
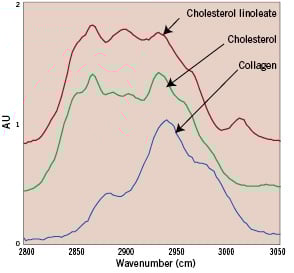
Figure 2. Spectra of high wavenumber Raman shifted light from cholesterol linoleate (red line), free cholesterol (green line), and collagen (blue line).
The spectra taken from lipids are very different from those obtained from proteins. Lipid subcategories are also distinguishable, with unique spectral signatures for substances such as cholesterols, triglycerides, and esterified cholesterols18. The spectra from different artery types are distinct and provide clear features for determining the chemical composition and histological classification of the arterial wall. Non-atherosclerotic coronary artery spectra are dominated by protein and triglyceride features, and lipid-laden plaques exhibit features of cholesterol and cholesterol esters20.
Data processing
Previous laboratory studies have shown that chemical concentrations calculated with FP Raman spectroscopy agree with standard chemical assays to within a few percent7. We have conducted a similar study demonstrating that similar assay comparisons can be made with HW Raman spectra obtained via optical fibres21. Briefly human cadaver coronary artery samples were submerged in liquid nitrogen, minced in a tissue pulveriser, and several Raman spectra were collected from locations throughout the sample volume. Each mince sample was then assayed for lipid and protein content, providing concentrations of free cholesterol, cholesterol esters, phospholipids, triglycerides, and protein. Basis spectra were calculated with chemometric techniques by ensuring that chemical concentrations calculated from the Raman spectra agreed with the actual concentrations measured with standard assay techniques. Excellent agreement was reached between the relative weights calculated with Raman spectroscopic techniques and those determined with standard assays conducted on the minces (Figure 3).
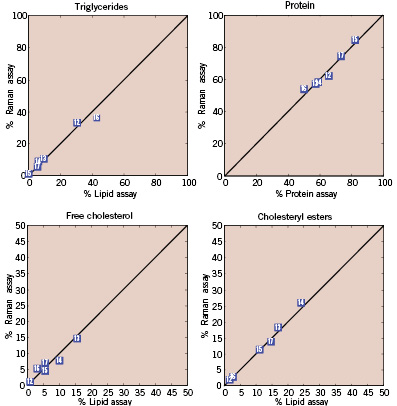
Figure 3. Comparison of the percentage weights of lipids and protein measured in coronary artery minces by Raman spectral analysis and standard chemical assay techniques. Raman techniques can further classify the cholesterols as either free or esterified (not shown).
These initial studies are being expanded to extend the accuracy and validity of the spectra processing model.
In vivo Raman analysis
In previous studies, we extracted quantitative chemical information from Raman spectra obtained from intact coronary artery exhibiting different stages of atherosclerosis and correlated this information with standard histological tissue diagnosis8 (Figure 4).
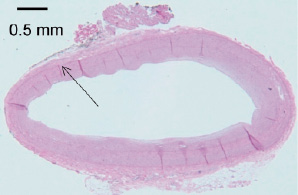
Figure 4. Human coronary artery with intimal hyperplasia utilised in the porcine Xenograft study. Arrow indicates the sampling area which is identified with the green registration ink.
To improve clinical utility, we developed an algorithm based on these chemical parameters that allowed the classification of coronary artery atherosclerosis in situ, according to standard pathological classification schemes. This technique, when applied in a percutaneous setting, may give the clinician not only access to information which has been unavailable for evaluating the type and degree of severity of the disease, but it may also provide the clinician with a new and more definitive basis for guiding treatment.
We recently reported successful collection of HW Raman spectra in vivo and percutaneously in swine22. Animal testing of Raman spectroscopy is challenging, since the spectra of compounds from animals do not necessarily agree with those from humans. Therefore we expanded our animal studies and utilised a xenograft model to test the catheter system, where a human cadaver artery is grafted onto the heart of a swine, allowing in vivo percutaneous testing in an animal model, yet remains as close to a human study as possible23. After Raman spectra are collected from the human artery in the xenograft setting, the examined locations are marked with colloidal ink and submitted for histological analysis.
In this initial xenograft study, we identified lipid-laden plaque with the collected Raman spectra utilising the overall cholesterol content, i.e. the sum of the free cholesterol and cholesterol esters contents, and set a decision threshold at 12%, as determined in previous studies8. As expected, the lipid laden plaques exhibit an increased content of free cholesterol and cholesterol esters, while the non-atherosclerotic samples are mainly protein and triglycerides24.
Conclusion
The potential applications in cardiology of Raman spectroscopy techniques are widespread, and we presented some exploratory studies to illustrate its potential. Raman spectroscopy is reproducible, objective and thus independent of intra- and inter-observer variability. Historically cardiovascular studies with Raman spectroscopy have been hindered by the high background noise generated by scattering within the optical fibres used to construct intravascular Raman probes, but new developments that utilise another region of the Raman spectrum have enabled one to collect quality Raman spectra remotely via a single optical fibre, greatly simplifying the size and complexity of the catheter and making it commercially feasible. Once in vivo Raman measurements are routinely available, the clinician will be provided with unprecedented capabilities that could serve many purposes, such as monitoring the effects of lipid lowering therapies and locating rupture-prone lesions.
Acknowledgements
Custom catheters were constructed by Nick Green (Professional Prototypes, Inc.) and Eric Marple (Emvision, FL. USA).