Endovascular ultrasound renal sympathetic denervation (uRDN) was demonstrated to lower daytime ambulatory systolic blood pressure (dASBP) by 5.9 mmHg as compared to a sham procedure at 2 months123. The blood pressure (BP)-lowering effect of uRDN may have been confounded by uncontrolled and non-protocol-defined changes in concomitant antihypertensive medications (AHMs). These changes could have resulted from either patient non-adherence to protocol-defined AHMs or physician prescriptions that deviated from the study protocol. The aim of the current analysis was to evaluate the BP-lowering effect of uRDN adjusted for changes in detected AHMs.
The RADIANCE-HTN TRIO trial was an international multicentre randomised sham-controlled trial in patients with resistant hypertension (RH; ClinicalTrials.gov: NCT02649426)24. After 4 weeks of standardised therapy (valsartan/olmesartan, amlodipine and hydrochlorothiazide), patients with daytime ambulatory BP ≥135/85 mmHg were randomised to uRDN with the Paradise Ultrasound Renal Denervation system (Recor Medical) or a sham procedure. Ambulatory BP monitoring coinciding with urine chemical adherence testing for the detection of AHMs or their metabolites (using ultra-high performance liquid chromatography coupled with tandem mass spectrometry [LC-MS/MS]) was performed at baseline, 2 months and 6 months5. Between baseline and 2 months, changing AHMs was only allowed if BP safety thresholds were exceeded, while between 2 months and 6 months AHMs could be changed based on uncontrolled home BP. Patients, physicians and outcome assessors were masked to randomisation until 6 months. The primary outcome was the between-group change in dASBP from baseline to 2 months, adjusted for baseline dASBP and the number of detected AHMs in urine at baseline and 2 months. Other BP outcomes included the 2-month and 6-month changes in ambulatory BP, office BP and home BP, with a similar adjustment as for the primary outcome. In parallel, the number of prescribed and detected AHMs and class-specific detection rates were reported. Statistical analyses for BP outcomes at 2 months and 6 months were performed using analysis of covariance (ANCOVA), adjusted for the baseline BP value and the number of detected AHMs at baseline and follow-up. Linear mixed-effects models were used for the temporal evolution of BP based on baseline, 2-month and 6-month observations, and the Student’s t-test or Wilcoxon rank-sum test was used for AHM outcomes. Subgroup analyses were performed in patients with a stable, increased, or decreased number of detected AHMs using ANCOVA, without adjustment for detected AHMs. Statistical analyses were performed using SAS, version 9.4 (SAS Institute).
A total of 100 patients with a mean age of 52.6±8.8 years (23% female, 71% white) were included (Supplementary Figure 1, Supplementary Table 1 - Supplementary Table 2-Supplementary Table 3). The mean baseline daytime ambulatory BP was 149.0/93.4±10.7/6.7 mmHg with 2.7±1.2 AHMs detected out of 3.1±0.3 AHMs prescribed (Supplementary Table 4). Within the 2-month period, detected AHMs remained unchanged (n=72), increased (n=17) or decreased (n=11) (Supplementary Figure 1). On average, no differences were observed in prescribed or detected AHMs (Supplementary Table 4, Supplementary Table 5). The change in dASBP was −10.9 (95% confidence interval [CI]: −15.5 to −6.3) mmHg in the uRDN group and −4.0 (95% CI: −8.0 to 0.0) mmHg in the sham control group. The baseline-adjusted between-group difference was −6.9 (95% CI: −12.8 to −1.1) mmHg in favour of uRDN (p=0.007). Following additional adjustment for the number of detected AHMs, the between-group difference was −9.3 (95% CI: −14.9 to −3.7) mmHg (p<0.001) (Central illustration). Similar results were observed for other ambulatory, office and home BP measures at 2 months (Table 1). Within the 6-month period, no significant difference in dASBP was observed between the uRDN and sham groups (Supplementary Table 6). Within a linear mixed-effects model combining observations from baseline, 2 months and 6 months, the modelled between-group difference in dASBP at 6 months was not significantly different between the uRDN and sham groups (−2.4 [95% CI: −6.5 to 1.6] mmHg; p=0.24). Following adjustment for concomitant AHMs, the modelled difference was −6.9 (95% CI: −11.0 to −2.7) mmHg (p=0.002) in favour of uRDN (Supplementary Table 7). Subgroup analyses have been displayed in Supplementary Figure 2 and Supplementary Figure 3.
Our findings demonstrated that the significant reduction in dASBP following uRDN was maintained when adjusting for concomitant AHMs (objectified using LC-MS/MS) at 2 months. At 6 months, no significant between-group difference in dASBP was observed, most likely due to the smaller sample size and increased heterogeneity in AHMs (mainly related to protocol-mandated uptitration of AHMs). To increase statistical power, all observations were pooled in a linear mixed-effects model, which confirmed a BP-lowering effect up to 6 months after adjusting for AHMs. The primary AHM-adjusted BP outcome was based on all available observations and was therefore considered less biased than subgroup-based analyses, which are prone to confounding-by-indication bias.
Limitations of this study include the selection of a specific subgroup with complete ambulatory BP and LC-MS/MS data from the RADIANCE-HTN TRIO trial, the post hoc study design, and the specific population of RH patients on a triple-combination single pill. Consequently, our results should be interpreted as hypothesis-generating and should be validated in future research.
The BP-lowering effect of uRDN in patients with RH was maintained and numerically more pronounced after adjusting for changes in detected AHMs.
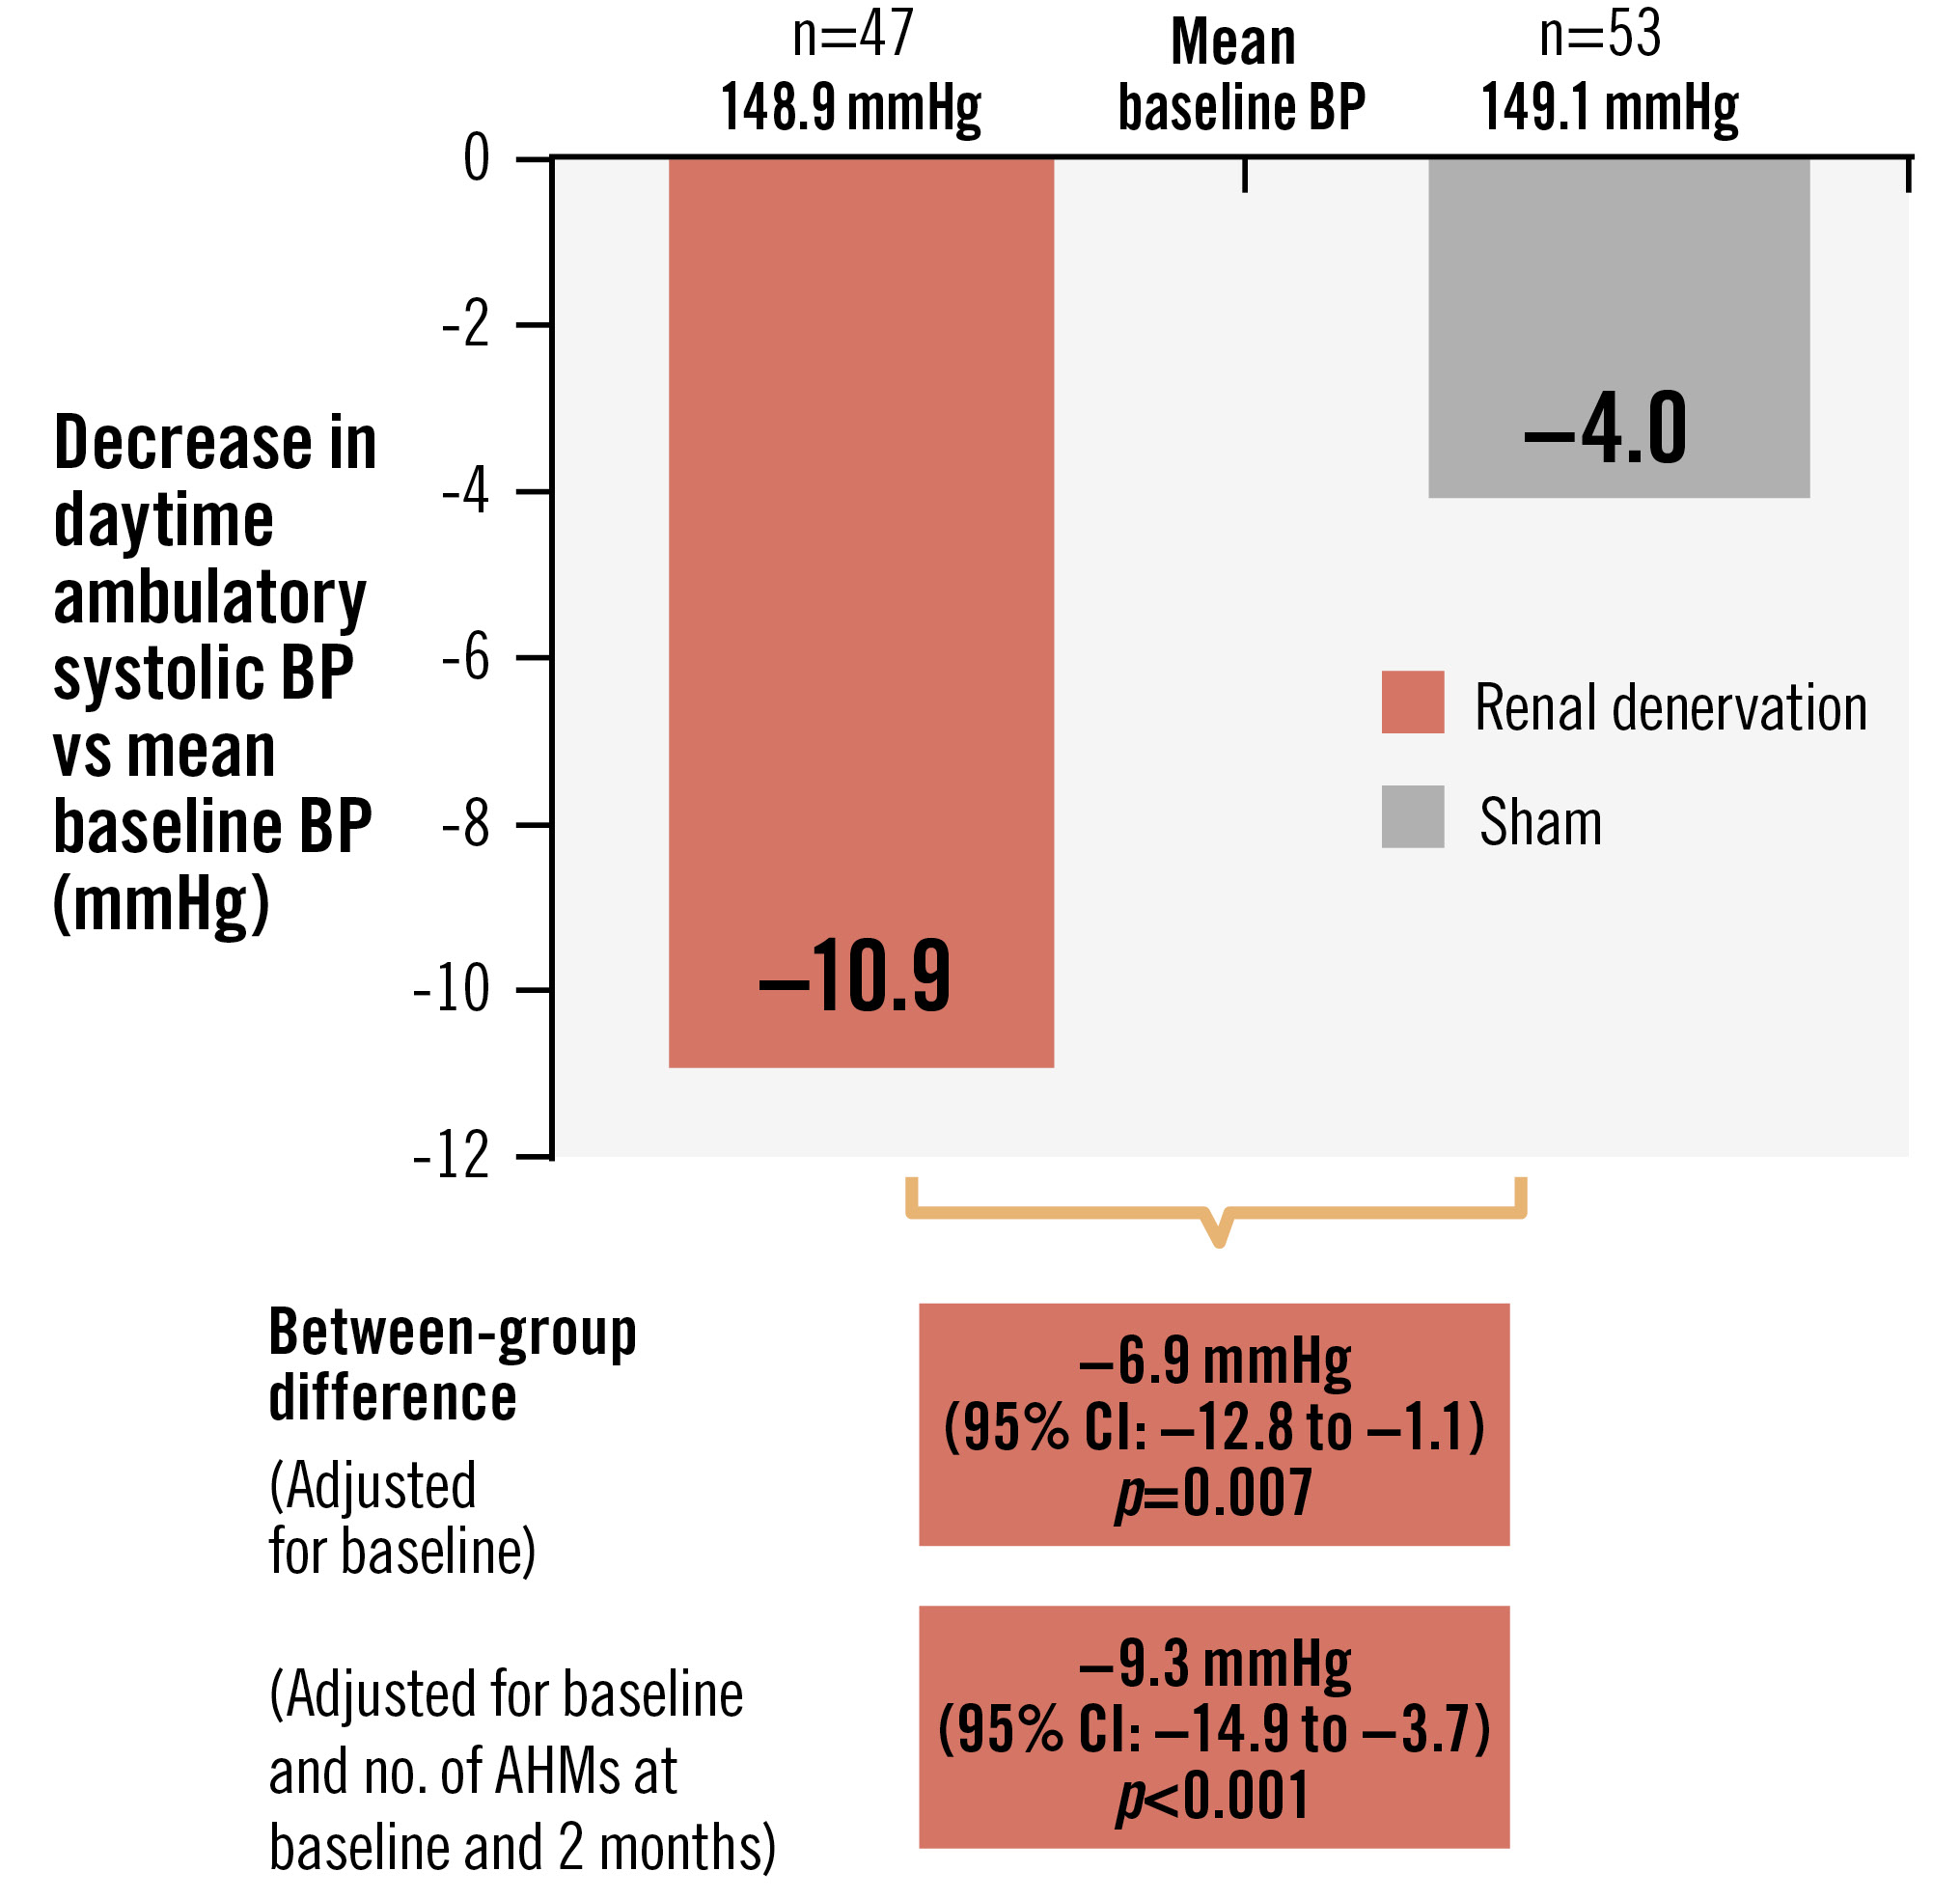
Central illustration. Change in daytime ambulatory systolic blood pressure between baseline and 2 months. AHM: antihypertensive medication; BP: blood pressure; CI: confidence interval
Table 1. ANCOVA changes between baseline and 2 months for ambulatory, office and home BP.
| uRDN | Sham control | Mean between-group difference adjusted for baseline value (95% CI) p-value | Mean between-group difference adjusted for baseline value and number of AHMs detected at baseline and 2 months (95% CI) p-value | |||||
|---|---|---|---|---|---|---|---|---|
| Baseline | 2 months | Difference (95% CI) | Baseline | 2 months | Difference (95% CI) | |||
| Daytime ambulatory SBP, mmHg | 148.9±11.1 | 138.0±15.3 | −10.9 (−15.5 to −6.3) | 149.1±10.4 | 145.1±16.8 | −4.0 (−8.0 to 0.0) | −6.9 (−12.8 to −1.1) p=0.007* | −9.3 (−14.9 to −3.7) p<0.001* |
| Daytime ambulatory DBP, mmHg | 92.7±6.3 | 86.1±10.9 (47) | −6.6 (−9.5 to −3.8) | 93.9±7.0 | 90.4±10.0 | −3.6 (−6.3 to −0.8) | −3.5 (−7.4 to 0.3) p=0.049* | −5.2 (−8.7 to −1.6) p=0.003* |
| Nighttime ambulatory SBP, mmHg | 131.3±16.2 | 122.4±17.2 | −8.9 (−13.7 to −4.1) | 133.7±16.0 | 130.4±18.8 | −3.3 (−8.8 to 2.3) | −6.9 (−13.4 to −0.3) p=0.01* | −9.1 (−15.5 to −2.6) p=0.002* |
| Nighttime ambulatory DBP, mmHg | 79.6±9.5 | 73.8±11.6 | −5.8 (−8.8 to −2.8) | 80.1±10.0 | 77.8±11.7 | −2.3 (−6.0 to 1.4) | −3.7 (−8.0 to 0.6) p=0.009* | −4.7 (−8.9 to −0.5) p=0.004* |
| 24-hr ambulatory SBP, mmHg | 142.1±12.1 | 131.8±14.9 | −10.3 (−14.6 to −6.0) | 143.0±11.4 | 139.2±16.8 | −3.8 (−8.2 to 0.5) | −6.8 (−12.6 to −1.1) p=0.005* | −9.2 (−14.7 to −3.7) p<0.001* |
| 24-hr ambulatory DBP, mmHg | 87.6±6.7 | 81.2±10.1 | −6.4 (−9.0 to −3.7) | 88.6±7.2 | 85.3±10.0 | −3.3 (−6.2 to −0.4) | −3.5 (−7.2 to 0.2) p=0.02* | −4.9 (−8.3 to −1.4) p=0.002* |
| Office SBP, mmHg | 156.5±15.5 | 145.3±20.9 | −11.2 (−16.9 to −5.5) | 151.8±15.5 | 150.7±20.8 | −1.0 (−7.0 to 5.0) | −7.9 (−15.7 to 0.0) p=0.008* | −10.1 (−17.4 to −2.8) p<0.001* |
| Office DBP, mmHg | 101.6±9.9 | 94.9±14.2 | −6.7 (−10.7 to −2.7) | 98.7±9.6 | 98.7±12.3 | 0.0 (−3.6 to 3.6) | −5.2 (−10.3 to −0.2) p=0.03* | −6.9 (−11.4 to −2.4) p=0.003* |
| Home SBP, mmHg | 151.3±17.6 | 142.8±19.0 | −8.5 (−13.4 to −3.6) | 150.3±16.1 | 147.4±17.8 | −2.9 (−5.7 to −0.1) | −5.4 (−10.7 to −0.2) p=0.04 | −6.4 (−11.5 to −1.2) p=0.02 |
| Home DBP, mmHg | 95.9±11.3 | 91.8±15.5 | −4.0 (−6.6 to −1.5) | 95.8±9.2 | 95.0±11.0 | −0.7 (−2.5 to 1.1) | −3.3 (−6.4 to −0.3) p=0.03 | −3.9 (−7.0 to −0.9) p=0.01 |
| Data at baseline and 2 months are displayed as mean±standard deviation. Differences are displayed as mean (95% confidence interval) with corresponding p-values for the between-group differences. Data were available for ambulatory BP (uRDN 47; sham 53), office BP (uRDN 46; sham 52), home BP (uRDN 44; sham 50). In the event that the change from baseline in either cohort is non-normal, the p-value (*) from a baseline-adjusted ANCOVA on the ranks is also provided. AHM: antihypertensive medication; ANCOVA: analysis of covariance; BP: blood pressure; CI: confidence interval; DBP: diastolic blood pressure; SBP: systolic blood pressure; uRDN: ultrasound renal denervation | ||||||||
Acknowledgements
The trial executive committee designed the protocol in conjunction with the sponsor. The sponsor was responsible for selection of clinical sites in collaboration with the executive committee, as well as collection, monitoring, and analysis of the data. The article was written by the lead author (V.J.M Zeijen) with significant contributions from the co-authors. All authors had access to all data, and the last author (J. Daemen) was responsible for the decision to submit the manuscript. C. McClure, an employee of NAMSA, was responsible for the statistical analyses/programming.
Funding
The RADIANCE-HTN TRIO Study was funded by Recor Medical (Palo Alto, CA, USA).
Conflict of interest statement
V.J.M. Zeijen received institutional grant/research support from Recor Medical. M. Azizi reports receiving grants from the European Horizon 2020 programme; receiving grants and non-financial support from Recor Medical, Idorsia, and Novartis; and receiving personal fees from Alnylam Pharmaceuticals, Cincor, Medtronic, AstraZeneca, and Novartis. A.J. Kirtane reports institutional funding to Columbia University and/or the Cardiovascular Research Foundation from Medtronic, Boston Scientific, Abbott, Abiomed, CSI, CathWorks, Siemens, Philips, and Recor Medical; in addition to research grants, this institutional funding includes fees paid to Columbia University and/or the Cardiovascular Research Foundation for speaking engagements and/or consulting; personal: consulting: Neurotronics; travel expenses/meals from Medtronic, Boston Scientific, Abbott, Abiomed, CSI, CathWorks, Siemens, Philips, Recor Medical, Chiesi, OpSens, Zoll, and Regeneron. C. McClure is an employee of NAMSA and a contractor for Recor Medical. J. Daemen received institutional grant/research support from Abbott, Boston Scientific, ACIST Medical, Medtronic, MicroPort, Pie Medical Imaging, and Recor Medical; and consultancy or speaker fees from Abbott, Abiomed, ACIST Medical, Boston Scientific, Cardialysis BV, CardiacBooster, Kaminari Medical, Recor Medical, PulseCath, Pie Medical Imaging, Sanofi, Siemens Healthineers, and Medtronic. B. Kably has no conflicts of interest to declare.
Supplementary data
To read the full content of this article, please download the PDF.