Abstract
Coronary computed tomographic angiography (CCTA) is becoming the first-line investigation for establishing the presence of coronary artery disease and, with fractional flow reserve (FFRCT), its haemodynamic significance. In patients without significant epicardial obstruction, its role is either to rule out atherosclerosis or to detect subclinical plaque that should be monitored for plaque progression/regression following prevention therapy and provide risk classification. Ischaemic non-obstructive coronary arteries are also expected to be assessed by non-invasive imaging, including CCTA. In patients with significant epicardial obstruction, CCTA can assist in planning revascularisation by determining the disease complexity, vessel size, lesion length and tissue composition of the atherosclerotic plaque, as well as the best fluoroscopic viewing angle; it may also help in selecting adjunctive percutaneous devices (e.g., rotational atherectomy) and in determining the best landing zone for stents or bypass grafts.
Introduction
During the nineties, coronary computed tomographic angiography (CCTA) emerged as a promising non-invasive imaging tool to diagnose coronary artery disease (CAD)1, and two decades later, it has gained prominence as a first-line investigation in diagnosis and decision-making (Central illustration, Supplementary Figure 1)12.
CAD phenotypes may be viewed as a pyramid of multiple layers of increasing anatomical complexity3. At the bottom are subjects with normal epicardial conductance vessels who have no atherosclerotic plaque and an excellent prognosis. Above them are patients with non-obstructive coronary plaque who have an increased risk of myocardial infarction (MI) and next, patients with progressive increases in plaque burden. Patients with normal coronary arteries or non-obstructive plaque may have structural or functional coronary microvascular dysfunction (CMD) that can lead to anginal symptoms with its two corollary syndromes (INOCA and ANOCA, i.e., ischaemia/angina with non-obstructive coronary arteries). Notably, “evidence of impaired coronary microvascular function should be present” with or without ischaemia4.
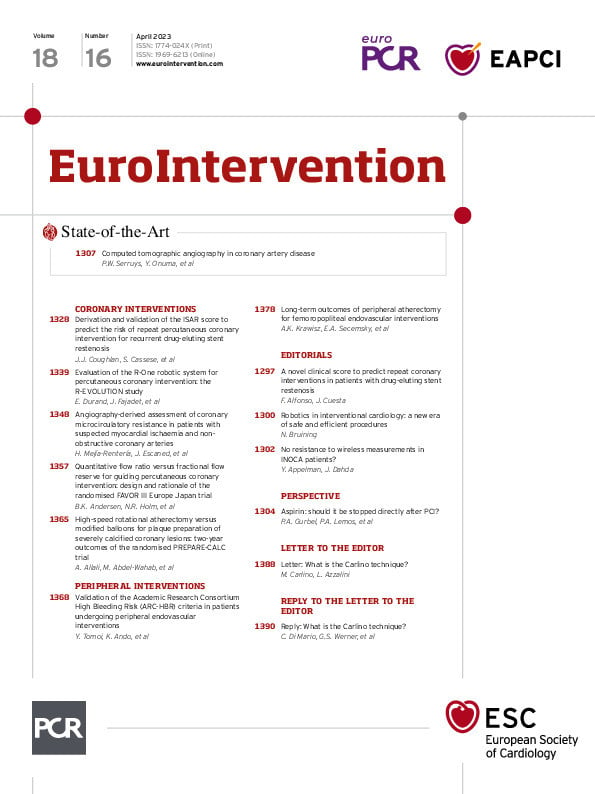
Central illustration. The role of CCTA in coronary artery disease: a diagnostic tool, decision maker and treatment planner. APS: axial plaque stress; CCTA: coronary computed tomographic angiography; CT: computed tomography; FFR: fractional flow reserve; LAD: left anterior descending; LM: left main; PCI: percutaneous coronary intervention; PET: positron emission tomography; WSS: wall shear stress
Pretest probability for obstructive CAD and diagnostic CCTA
The application of the pretest probability (PTP) for significant obstructive CAD (as determined by invasive coronary angiography [ICA] and fractional flow reserve [FFR]) based on age, sex, and the nature of symptoms underwent a major revision in the 2019 European Society of Cardiology (ESC) Guidelines for the diagnosis and management of chronic coronary syndromes (CCS)5.
The PROMISE (Prospective Multicenter Imaging Study for Evaluation of Chest Pain) trial showed that in patients with a PTP <15%, the annual risk of cardiovascular death or MI was <1%6. The SCOT-HEART (Scottish Computed Tomography of the Heart) trial confirmed that the 2019 ESC estimates of PTP based on ICA and FFR were broadly similar to the prevalence observed on CCTA in the trial cohort7, although it tended to underestimate the real prevalence, or alternatively, CCTA might overestimate the CAD (Supplementary Figure 2A). The rates of 5-year cardiac death or non-fatal MI were 4.1%, 1.5% and 1.4% in patients with a PTP >15%, 5-15% and <5%, respectively (p<0.001 between groups) (Supplementary Figure 2B).
On the other hand, the results of the Western Denmark Heart Registry, including 23,759 symptomatic patients, challenge the traditional dichotomous definition of CAD as “obstructive” or “non-obstructive” for identifying truly high-risk patients8. Major adverse cardiac events (MACE; MI, stroke, and all-cause death) at 4-year follow-up increased stepwise with both higher coronary artery calcium (CAC) scores and the number of vessels with obstructive disease detected by CCTA. Of note, when stratified into 5 groups according to CAC scores, the presence of obstructive CAD was not associated with a higher risk of MACE than the presence of non-obstructive CAD (NOCAD)8.
Previously, the term “known CAD” had been used to define patients with a significant obstructive stenosis (i.e., ≥50%). In the recent American College of Cardiology (ACC)/American Heart Association (AHA) Chest Pain Guideline, the term “known CAD” was applied to those patients with prior anatomical testing (ICA or CCTA) with identified non-obstructive atherosclerotic plaque and obstructive CAD9. It was recognised as a “departure from convention” to ensure that those with lesser degrees of stenosis, who do not require revascularisation but who would benefit from optimised prevention therapy, do not get overlooked.
Structured reporting system for CCTA
This year, the expert document 2022 Coronary Artery Disease-Reporting and Data System, or CAD-RADS 2.0, expanded on its first version, which was published in 2016 as a multi-society sponsored statement from the Society of Cardiovascular Computed Tomography (SCCT)/ACC/American College of Radiology (ACR)/North American Society of Cardiovascular Imaging (NASCI) to standardise the reporting system for patients undergoing CCTA and to guide the possible next steps in patient management10. One key update provided in the CAD-RADS 2.0 statement is the estimation of coronary plaque burden; this is due to the emerging data supporting its stronger prognostic value over merely the presence or absence of an anatomical stenosis. In addition, there was a focus on physiological assessments of lesion-specific ischaemia using CT-derived FFR (FFRCT) or CT perfusion (CTP).
The CAD-RADS score stratifies CAD stenosis severity as 0 (0%), 1 (1-24%), 2 (25-49%), 3 (50-69%), 4A (70-99% in 1 to 2 vessels), 4B (70-99% in 3 vessels or ≥50% in the left main), or 5 (100%). The additional description of P1 to P4 are used to indicate increasing categories of plaque burden. In the CONFIRM (Coronary CT Angiography Evaluation for Clinical Outcomes: An International Multicenter) registry, stratifying 5,039 patients without known CAD by CAD-RADS scores, a multivariable Cox model demonstrated that CAD-RADS scores were strongly associated with an elevated risk for death or MI, with hazard ratios (HR) ranging from 2.46 for CAD-RADS 1 to 6.09 for CAD-RADS 5, using CAD-RADS 0 as the reference group (p<0.0001 for all comparisons)11. The prognostic implications of the CAD-RADS reporting system might be of no surprise since the CAD-RADS score was designed to reflect CAD severity, therefore it is no wonder that it is associated with outcome.
The Coronary Artery Calcium Data and Reporting System (CAC-DRS) aimed at communicating the findings of CAC scanning on all non-contrast CT scans to facilitate clinical decision-making, with recommendations for subsequent patient management12. The CAC-DRS classified CAC based on Agatston scores as 0 (Agatston score 0), 1 (1-99), 2 (100-299), and 3 (≥300), as well as on visual assessment. In the SCOT-HEART trial assessing 1,769 patients, patients classified as CAC-DRS 3 were at an increased risk of fatal or non-fatal MI compared to CAC-DRS 0 patients (HR 9.41, 95% confidence interval [CI] 3.24-27.31; p<0.001)13.
Ultimately these structured reporting systems allow accurate communication of patient findings and convey prognosis, which may help provide guideline-based care directly from the CCTA findings.
Ruling out CAD
Prospective multicentre studies investigating the diagnostic accuracy of CCTA for detecting a narrowing in an epicardial vessel in patients with suspected but unproven CAD have reported sensitivities of 85%-99% and specificities of 64%-92% (Supplementary Table 1)1. In a meta-analysis reported by Knuuti et al, when anatomical coronary narrowing >50% on ICA was considered a reference standard, CCTA had a sensitivity of 97%, a specificity of 78%, and substantial positive and negative likelihood ratios (4.44 and 0.04, respectively)14 (Supplementary Figure 3). Recent technological advancements have improved the diagnostic accuracy for detecting a significant coronary artery stenosis (≥50%), even in patients with atrial fibrillation and/or high heart rates, and photon-counting CT or ultra-high spatial resolution CT (UHR-CT) may further boost image resolution with inherent spectral information (Supplementary Table 1)1516.
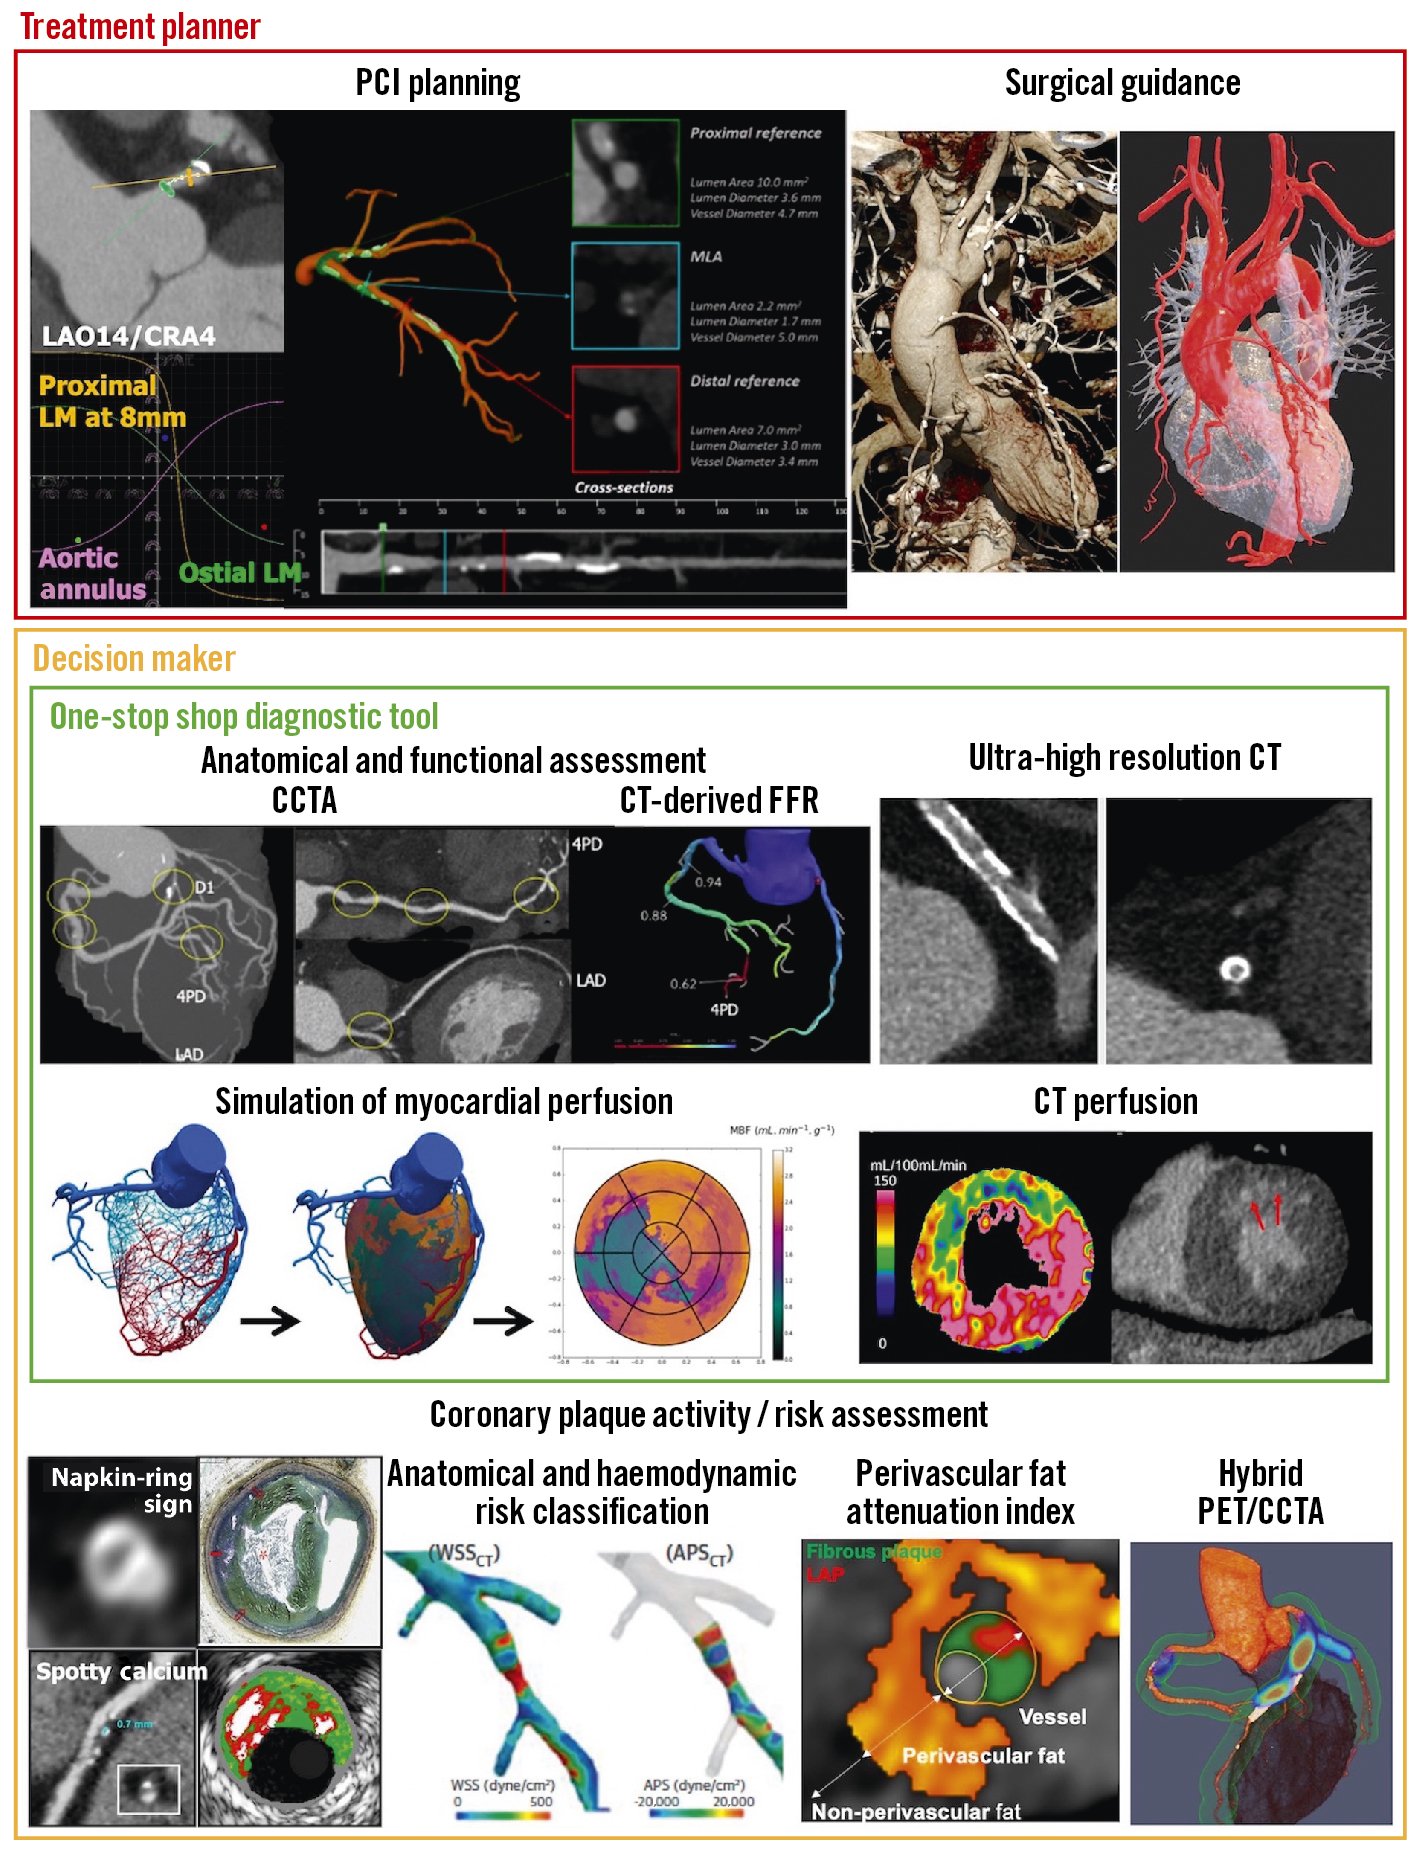
UHR-CT provides a resolution of 150-200 μm and allows improved visualisation of calcified, stented, or small-diameter vessels17 (Figure 1). Using a commercially available UHR-CT, a recent study of high-risk patients with severe CAD as well as very high calcium scores (mean CAC score 1,205) provided promising preliminary data demonstrating a high diagnostic accuracy with a specificity of 88% in a per-vessel analysis compared with ICA (Supplementary Table 1)15. FFRCT is helpful in improving the dismal specificity of standard CCTA but does not improve the sensitivity of the technique. With the advent of UHR-CT, a significant reduction in false-positive findings may be expected and supersedes the need for an additional functional evaluation such as FFRCT. Therefore, in this new era, the clinical role of FFRCT will have to be re-evaluated18.
Furthermore, accurate evaluation of even smaller vessels with a diameter ≤400 μm may, in the future, help contribute to our understanding of CMD (Supplementary Figure 4)18.
Despite its high diagnostic performance in large-scale trials, “the real-world performance of CCTA when interpreted by non-expert readers is less sanguine”19. In the PROMISE trial, including 4,347 patients, core laboratory and site interpretations were discordant in 16% of cases, with 80% (544 of 683) of these discordant interpretations in patients who had significant CAD (≥50% stenosis) by site but not by core laboratory interpretation20. Using data from the CREDENCE (Computed TomogRaphic Evaluation of Atherosclerotic DEtermiNants of Myocardial IsChEmia) trial, it was demonstrated that “Artificial intelligence (AI)-based evaluation of CCTA enables rapid and accurate identification and exclusion of high-grade stenosis, with a close agreement to blinded core lab-interpreted quantitative coronary angiography (QCA)” (intraclass correlation coefficient [ICC] 0.73 on a per-vessel basis; p<0.001)19.
An international, multicentre study including 9 cohorts of patients undergoing CCTA at 11 sites showed excellent or good agreement between deep learning and expert reader measurements for total plaque volume (ICC 0.964) and percentage diameter stenosis (ICC 0.879; both p<0.0001)21. When compared with intravascular ultrasound (IVUS), there was also excellent agreement for deep learning total plaque volume (ICC 0.949) and minimal lumen area (ICC 0.904). A deep learning-based total plaque volume of ≥238.5 mm3 was associated with an increased risk of MI (HR 5.36, 95% CI: 1.70-16.86; p=0.0042). In this aspect, a standardised classification of CCTA results using CAD-RADS/CAC-DRS serves as the basis for developing AI.
However, a technique that currently provides an isotropic spatial resolution of approximately 0.25-0.50 mm has limitations in determining stenosis grade. In 4 mm vessels, the identifiable increments of percentage diameter stenosis are 6%. For smaller vessels, these increments are even larger. We may wonder whether this limited degree of precision in measuring percentage stenosis can be overcome by artificial intelligence despite the abovementioned evidence. Therefore, the CAD-RADS score used a degree of precision that may be at variance with the true physical reality.
In a prospective cohort study of 250 patients presenting to the emergency department, troponin-guided CCTA was evaluated in patients with suspected acute coronary syndrome (ACS) but a high-sensitivity cardiac troponin I concentration below the sex-specific 99th percentile – thus, after excluding non-ST-segment elevation MI (NSTEMI)22. This approach to using cardiac troponin to select patients for downstream CCTA after NSTEMI has been ruled out has the major potential to improve patient outcomes by accurately diagnosing CAD and guiding preventative treatments (Figure 2).
Regarding the prognostic value derived from CCTA, in the SCOT-HEART trial, among the patients assigned to standard care plus CCTA, approximately half of the subsequent MI occurred among patients who had NOCAD23. In the PROMISE trial, the presence of high-risk plaque increased the rate of MACE (defined as death, MI, or unstable angina) among patients with NOCAD compared to patients without high-risk plaque24. The identification of high-risk non-obstructive plaque is a favourable additional benefit that comes with CCTA, which is missed by functional testing and not taken into account in the current PTP algorithm and may decisively lead to the use of preventative and aggressive pharmacological therapies1.
In patients with ischaemic or non-ischaemic cardiomyopathy, cardiac CT also provides information on chamber size, function, and morphology and rules out obstructive CAD. Late enhancement CT imaging to evaluate myocardial viability in selected patients who cannot undergo cardiac magnetic resonance (CMR) could be useful if it impacts the diagnosis and decision-making. The details and limitations are described in the SCCT consensus document25.
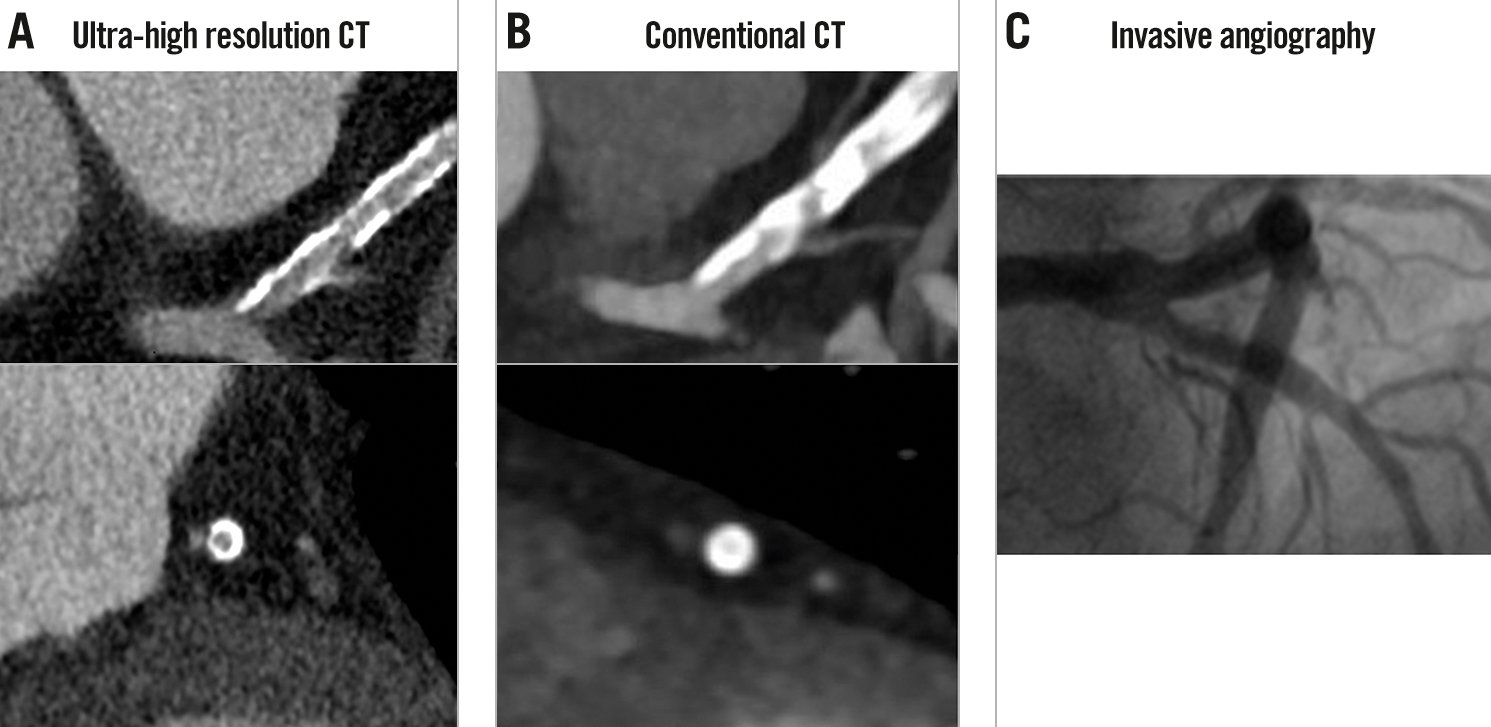
Figure 1. Comparison between ultra-high resolution CT and conventional CT. A) In ultra-high resolution CT in a patient with a calcium score >2,000, the presence of a significant stenosis in the proximal LAD can be ruled out despite extensive calcifications. B) A significant lesion cannot be ruled out on conventional CT due to the substantial blooming artefacts. C) ICA confirmed the absence of significant stenosis. Reproduced with permission from18. CT: computed tomography; ICA: invasive coronary angiography; LAD: left anterior descending
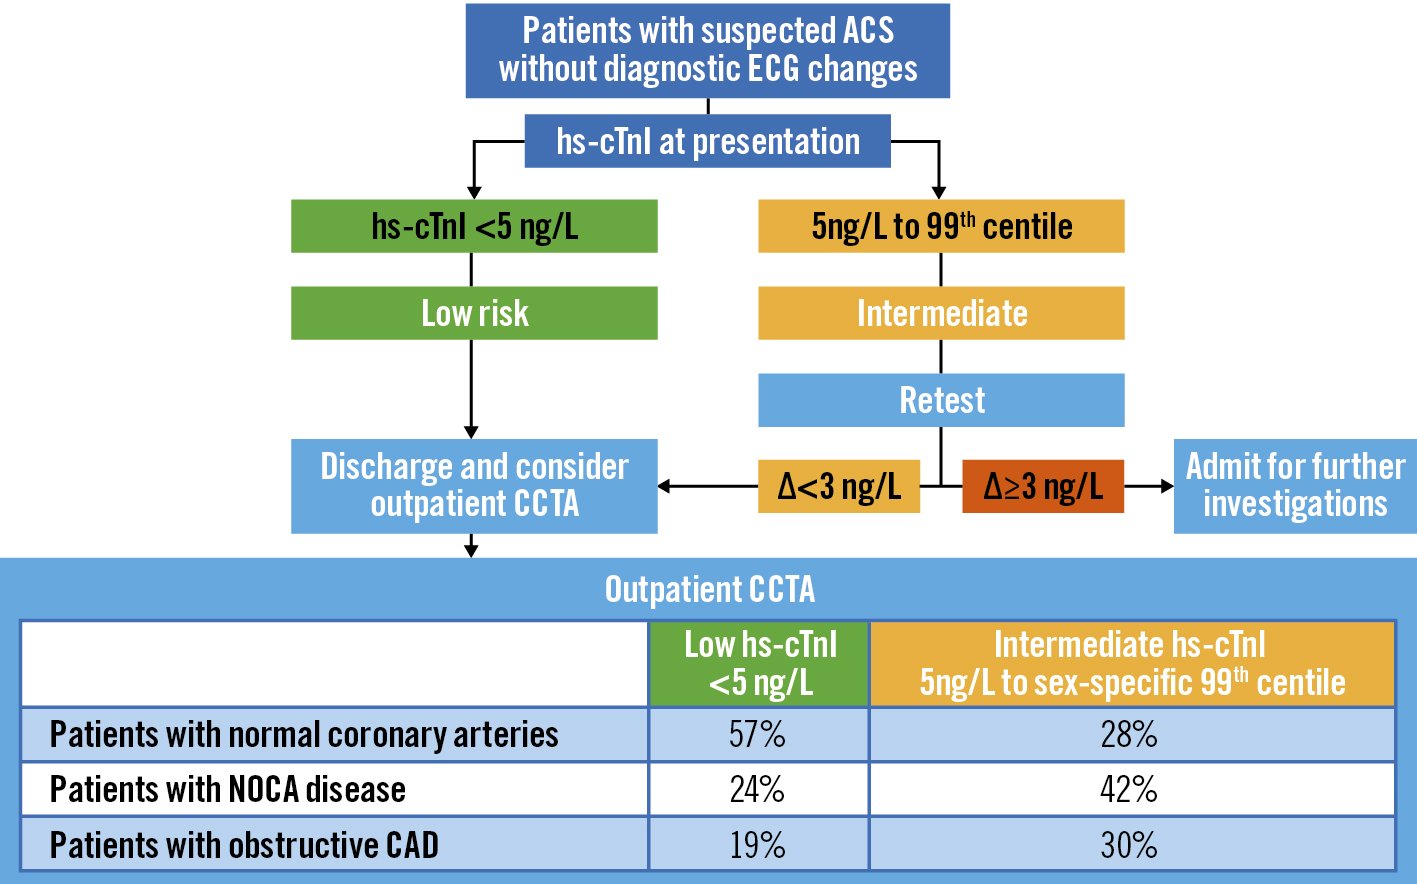
Figure 2. Troponin-guided CCTA. Reproduced with permission from22. ACS: acute coronary syndrome; CAD: coronary artery disease; CCTA: coronary computed tomographic angiography; ECG: electrocardiogram; hs-cTnI: high sensitivity cardiac troponin I concentrations; NOCA: non-obstructive coronary artery
Non-invasive functional imaging: FFRCT and myocardial perfusion imaging
Diagnostic strategies to accurately rule out patients who do not require further testing are needed to offset the potentially higher ICA utilisation after CCTA as the first-line diagnostic workup26. Thus, guidelines recommend second-line function testing if CCTA suggests CAD of uncertain functional significance5.
The prospective PACIFIC (Prospective Comparison of Cardiac PET/CT, SPECT/CT Perfusion Imaging and CT Coronary Angiography With Invasive Coronary Angiography) trial, including 208 patients with suspected CCS, showed that FFRCT “with adequate image quality of CCTA” had the largest area under the curve (AUC; 0.94) on a per-vessel comparison with CCTA alone (0.83), positron emission tomography (PET; 0.87), and single-photon emission computed tomography (SPECT; 0.70) when referenced to invasive FFR27. Adding SPECT or PET to CCTA alone improved the specificity, although, with a large loss in sensitivity (per-vessel: from 72% to 35% and 64%, respectively)26.
Findings from the Dan-NICAD 2 (Danish study of Non-Invasive testing in Coronary Artery Disease 2) trial28 were presented at the 2022 ESC congress. Among 1,732 patients with symptoms suggestive of CAD, 26% of patients had ≥50% stenosis on CCTA and were referred for both 3-Tesla (3T) CMR or rubidium (Rb)-PET. Invasive FFR identified functional significance (≤0.80) in 41.1% of those patients with ≥50% stenosis on CCTA. The result showed discrepancy between the advanced myocardial perfusion imaging (MPI) and invasive FFR with sensitivities of 59% for 3T CMR and 64% for Rb-PET (p=0.21), while specificities were 84% and 89% (p=0.08), respectively, with invasive FFR ≤0.80 as the reference standard.
FFRCT – unlike MPI with SPECT/PET – is based on standard CCTA images from which patient-specific 3-dimensional (3D) anatomical and physiological models are derived, without the need for additional testing, medication, or radiation. Application of computational fluid dynamics principles enables computation of a 3D pressure map providing a physiological assessment of CAD at each point of the coronary tree26, whereas MPI with SPECT/PET helps identify vessels with abnormal physiology but provides no pressure calculation, localisation of the pressure drop, nor characterisation of the physiological phenotype.
In the 2019 ESC Guidelines, CCTA with non-invasive functional imaging was given a class I level of evidence B recommendation as the initial test to diagnose CAD in symptomatic patients in whom obstructive CAD could not be excluded by clinical assessment alone5. In the recent ACC/AHA Chest Pain guidelines, CCTA received a class 2a recommendation for “determining atherosclerotic plaque burden and progression to obstructive CAD, and guiding therapeutic decision-making”. FFRCT was recommended (class 2a) down to the level of a 40% stenosis for the “diagnosis of vessel-specific ischaemia and to guide decision-making regarding the use of ICA”9. The forthcoming clinical use of CCTA as a “one-stop shop”, including anatomical and physiological assessment to diagnose patients with new-onset chest pain (Supplementary Figure 5), is also expected to serve as a decision-making tool.
The FORECAST (Fractional Flow Reserve Derived From Computed Tomography Coronary Angiography in the Assessment and Management of Stable Chest Pain) trial showed that a strategy of CCTA with selective FFRCT in patients with stable angina was comparable with standard clinical care pathways in terms of cost and clinical outcomes at 9-month follow-up, and while reducing the use of ICA, it had no impact on decreasing coronary revascularisation2930. The ADVANCE (Assessing Diagnostic Value of Non-invasive FFRCT in Coronary Care) Registry reported 1-year clinical outcomes from real-world practice and provided safety data in patients with a negative FFRCT for whom invasive evaluation was deferred. The results showed significantly lower rates of cardiovascular death or MI (0.20% vs 0.80%; relative risk [RR] 4.22, 95% CI: 1.28-13.95; p=0.01) with less revascularisation (5.60% vs 38.40%; RR 6.87, 95% CI: 5.59-8.45; p<0.001) in patients with an FFRCT>0.80 compared to patients with an FFRCT ≤0.8031. These abovementioned findings were further strengthened by a recent meta-analysis including five studies32. The 5-year follow-up of the NXT (Analysis of Coronary Blood Flow Using Coronary CT Angiography: Next steps) trial demonstrated that in patients with stable CAD, a positive FFRCT (≤0.80) was a predictor of long-term MACE (cardiac death, non-fatal MI, or unplanned revascularisation) (HR 5.5; p=0.006) and was superior to an anatomically significant stenosis (≥50%) on CCTA33.
Recently, there has been increasing interest in alternative, less demanding computational approaches that allow for on-site analysis. Comparisons of physiological models, computation time, and diagnostic performance between full-order and on-site CT-derived FFR are shown in Figure 3 and Supplementary Table 2.
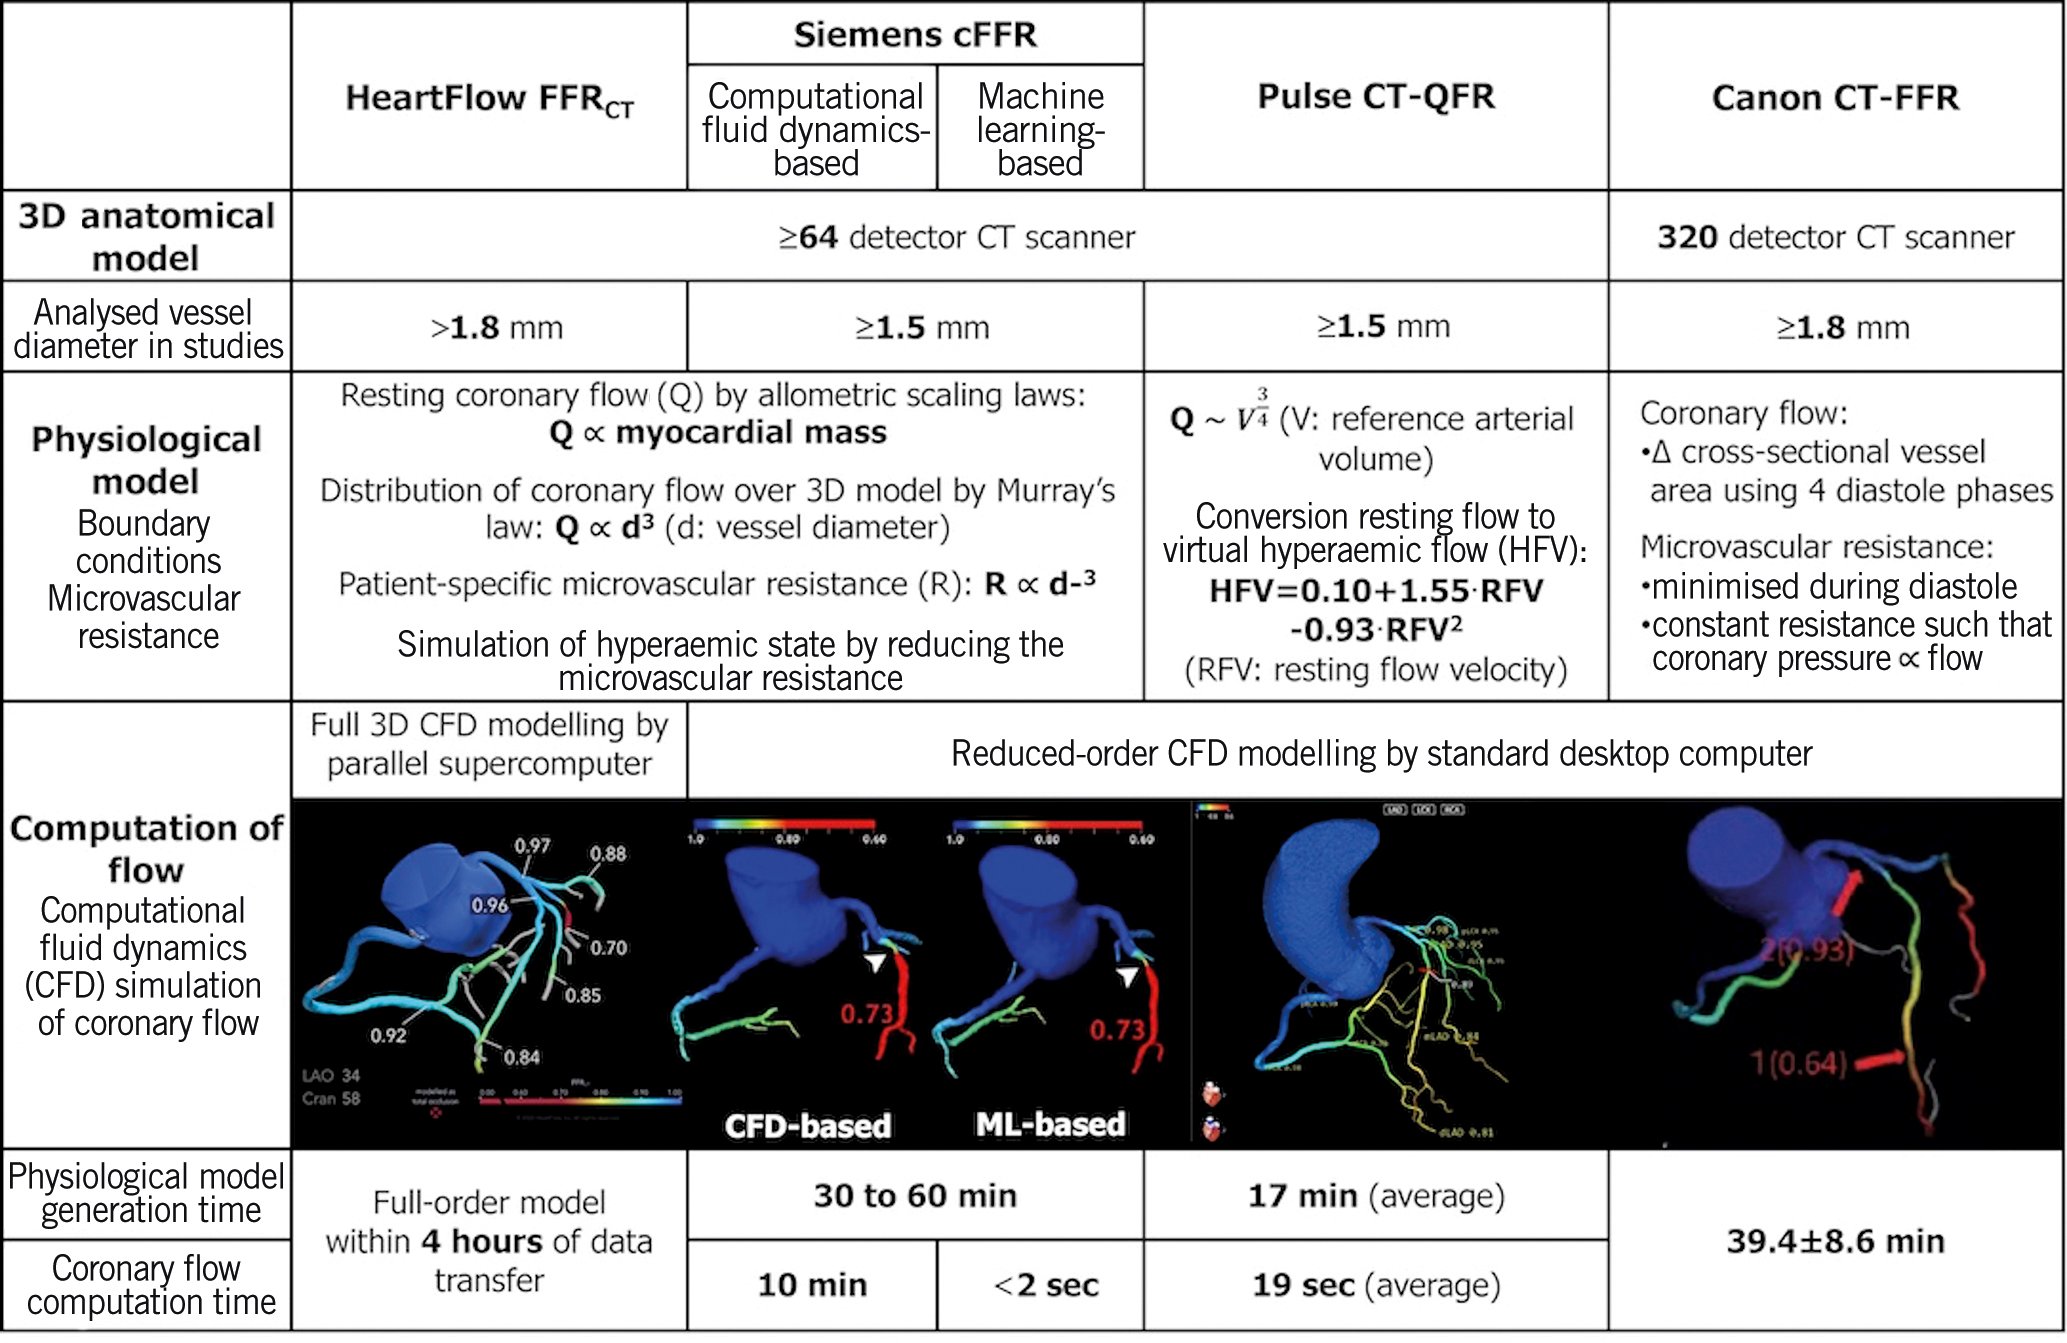
Figure 3. Comparison between full-order and on-site CT-derived FFR. Functional diagnostic performance of full-order and on-site CT-derived FFR is shown in Supplementary Table 2. Modified and reproduced with permission from90. 3D: three-dimensional; cFFR: computed fractional flow reserve: CT: computed tomography; FFR: fractional flow reserve; FFRCT: fractional flow reserve derived from coronary computed tomographic angiography; ML: machine learning; QFR: quantitative flow ratio
CT perfusion
FFRCT benefits from the fact that analyses can be performed straight from the CCTA acquisition without additional scanning and pharmacological stressors; however, its diagnostic value in patients with previous MI, stents or bypasses remains to be established2634. MPI including CTP remains a valuable alternative, although CTP is not used as a routine diagnostic tool in current clinical practice2535.
A meta-analysis of 54 articles and 5,330 patients indicated that CTP and its combined use with CCTA yielded a higher diagnostic performance (sensitivities 83% and 89%; specificities 79% and 81%, respectively) compared to CCTA alone, with an invasive FFR ≤0.80 as a standard reference36.
The two primary methods of acquisition are static CTP and dynamic CTP with rest CCTA scanning followed by pharmacological stress or vice versa37.
Static CTP acquires a single set of images during the first pass of contrast medium through the myocardium and during pharmacologically induced stress, providing a qualitative assessment – they are snapshots of myocardial iodine distribution and perfusion defects25. Perfusion defects are evaluated against baseline myocardial enhancement to determine reversibility and, hence, myocardial ischaemia, whereas an irreversible defect is indicative of infarcted tissue (e.g., scar tissue)38.
Dynamic CTP requires a 2nd/3rd-generation dual-source or wide-detector CT system for complete myocardial coverage in one or two acquisitions with a higher radiation exposure than the static perfusion imaging25. By dynamic CTP, absolute myocardial blood flow (MBF) can be calculated from the time-attenuation curves (TAC), which are generated from a serial measurement of the attenuation values in the myocardium after injection of contrast medium (Figure 4)38.

Figure 4. Dynamic myocardial perfusion imaging using dual-source CT and TAC. By dynamic CTP, absolute myocardial blood flow (MBF) can be calculated from the time-attenuation curves (TAC). Dynamic CTP showed reduced MBF in the LAD territory in both the (A) short-axis and (B) long-axis view (C,D) CT-delayed enhancement revealed a subendocardial infarction in the anterior wall within the reduced MBF area (red arrows). E) CCTA showed a high-grade stenosis in the LAD just proximal to the stent (red arrow). F) ICA revealed >90% stenosis (red arrow). Upper graph reproduced with permission from38. A-F) reproduced with permission from41. CT: computed tomography; CCTA: coronary computed tomographic angiography; CTP: computed tomography perfusion; ICA: invasive coronary angiography; LAD: left anterior descending artery
Static stress CTP
Although both technologies of CTP and FFRCT are based on CT imaging, allowing anatomical and functional – perfusion or physiology – evaluation within 1 modality, CTP assesses the effects of both epicardial and microvascular perturbation, which is a different level of the ischaemic cascade from FFRCT34. In the PERFECTION (PERfusion Versus Fractional Flow Reserve CT Derived In Suspected CoroNary) study, the AUC to detect flow-limiting stenoses with CCTA, CCTA+FFRCT, and CCTA+static stress-CTP were 0.89, 0.93, 0.92, respectively, in a vessel-based model, with significant additional values for CCTA+FFRCT and CCTA+static stress-CTP versus CCTA alone (p<0.001) but no difference between CCTA+FFRCT versus CCTA+static stress-CTP39.
The Core320 (Combined Non-invasive Coronary Angiography and Myocardial Perfusion Imaging Using 320 Detector Computed Tomography) study compared the prognostic value of a combined anatomical/functional assessment by non-invasive imaging versus a traditional approach, showing that 5-year MACE (cardiac death, MI, hospitalisation for chest pain or congestive heart failure, and late revascularisation)-free survival rates were greater among patients with normal findings of combined CCTA-CTP compared to ICA-SPECT: 85% vs 80% (95% CI for difference: 0.1-11.3)40.
Dynamic CTP
The AMPLIFiED (Assessment of Myocardial Perfusion Linked to Infarction and Fibrosis Explored With Dual-Source CT) study showed that adding dynamic CTP to CCTA significantly increased the AUC from 0.65 (95% CI: 0.57-0.72) to 0.74 (95% CI: 0.66-0.81; p=0.011) at a patient level, with decreased sensitivity (93% vs 72%; p<0.001), improved specificity (36% vs 75%; p<0.001), and improved accuracy (64% vs 74%; p<0.001) when a haemodynamically significant stenosis was defined as an FFR of <0.8 or >90% stenosis during ICA41 (Figure 4). Of note, the addition of dynamic CTP to CCTA significantly increased the AUC from 0.80 to 0.84 (p=0.041) in 2-vessel disease (VD), and from 0.65 to 0.73 (p=0.022) in 3VD, but not in 1VD (from 0.84 to 0.87; p=0.265).
In the international SPECIFIC (Dynamic Stress Perfusion CT for Detection of Inducible Myocardial Ischemia) study investigating the diagnostic performance of dynamic stress CTP by 3rd-generation dual-source CT in addition to CCTA, diagnostic accuracy improved with the addition of CTP in vessels with a stenosis between 50-69% from 44% (95% CI: 33-55%) to 71% (95% CI: 61-81%) when stratified by stenosis grading on CCTA. This suggests that routine performance of CTP would not be justified in populations with low disease prevalence but may benefit after a CCTA which shows obstructive disease42. The CRESCENT 2 (Comprehensive Cardiac CT Versus Exercise Testing in Suspected Coronary Artery Disease 2) trial showed a higher diagnostic yield of subsequent ICA with an ESC class I indication for revascularisation (88% vs 50%; p=0.017) when CTP was selectively performed in patients with obstructive disease on CCTA, in comparison to standard functional testing (95% of functional testing was exercise electrocardiogram [ECG]), without increasing the rate of ICA43.
Regardless of the CTP acquisition mode, the SCCT consensus document underlined the importance of patient selection and recommended adding CTP to CCTA when patients were at high atherosclerotic risk for obstructive CAD, including those with prior coronary intervention or significant calcification, or when there is a stenosis of indeterminate functional significance37. It also needs to be reassessed whether CTP with its associated radiation burden, in addition to CCTA, is still necessary when the use of UHR-CT, with a significant reduction in false-positive findings, will be more generalised in practice. Alternatives such as stress echocardiography or stress CMR perfusion imaging may be considered.
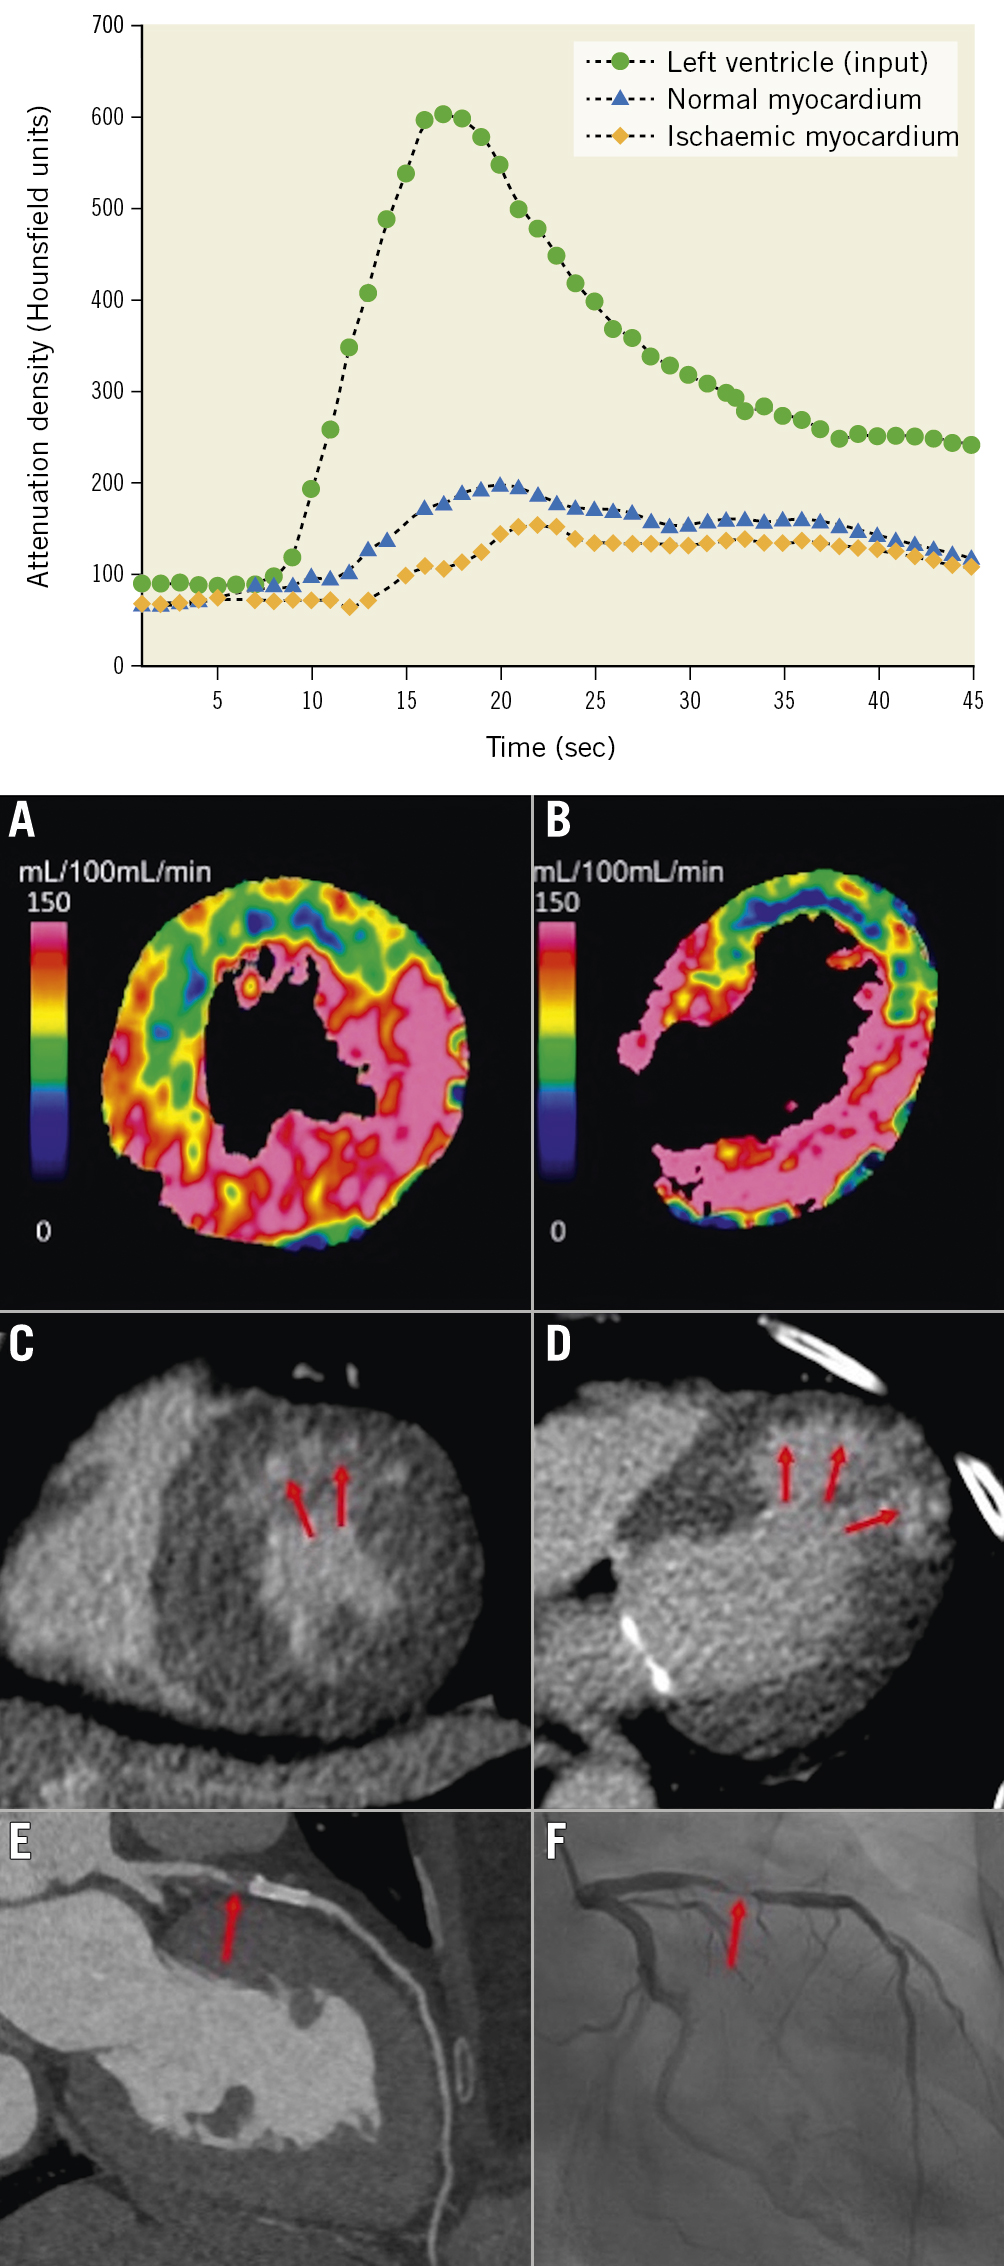
Figure 4. Dynamic myocardial perfusion imaging using dual-source CT and TAC. By dynamic CTP, absolute myocardial blood flow (MBF) can be calculated from the time-attenuation curves (TAC). Dynamic CTP showed reduced MBF in the LAD territory in both the (A) short-axis and (B) long-axis view (C,D) CT-delayed enhancement revealed a subendocardial infarction in the anterior wall within the reduced MBF area (red arrows). E) CCTA showed a high-grade stenosis in the LAD just proximal to the stent (red arrow). F) ICA revealed >90% stenosis (red arrow). Upper graph reproduced with permission from38. A-F) reproduced with permission from41. CT: computed tomography; CCTA: coronary computed tomographic angiography; CTP: computed tomography perfusion; ICA: invasive coronary angiography; LAD: left anterior descending artery
NOCAD and microvasculature dysfunction
Current explanations for INOCA reference either CMD or vasospastic angina, while in contrast, the recent US guidelines advocate ruling out the functional significance of diffuse atherosclerosis. Another independent explanation for INOCA is that it is related to the coronary lumen volume to myocardial mass ratio (V/M), measured non-invasively using CCTA. V/M provides an integrated measure of the balance between myocardial blood supply capacity and demand in vivo44 (Figure 5). In a post hoc analysis of the NXT trial including a total of 365 vessels in 202 patients with QCA stenosis ≤50%, multivariate logistic regression analysis, including percentage stenosis and quantitative plaque measures, demonstrated that V/M was an independent predictor of FFR ≤0.8045, since V/M measures the same phenomenon in the whole coronary tree while FFRCT documents an epicardial phenomenon. An attempt to establish a relationship between V/M, FFR, and FFRCT has been made; however, this is not a measure of microvascular function. In fact, a substudy of the PACIFIC trial, investigating 431 vessels in 152 patients, found no association between V/M and vessel-specific hyperaemic MBF or coronary flow reserve (CFR) among vessels with NOCAD on ICA (361 vessels)46.
Epicardial arteries, visualised by the “clinical angiographer", represent only 5% of the volume of the coronary tree, while pre-arterioles, arterioles, and capillaries represent 95% of the remaining coronary volume (Supplementary Figure 4). The epicardial arteries (>400 μm) are the conduit vessels and might be interrogated by FFR, instantaneous wave-free ratio (iFR), and other non-hyperaemic pressure ratios47. The pre-arterioles (100-400 μm) and arterioles (40-100 μm) are involved in the regulation of flow distribution and in metabolic control, and the capillaries (<10 μm) are exchange vessels48.
One approach to extend non-invasive physiological assessment from the epicardial coronary arteries to the microcirculation is to generate a synthetic tree following branching laws from the CCTA data down to the microvasculature. Recently, an algorithm for the generation of patient-specific cardiac vascular networks starting from segmented epicardial vessels down to the arterioles has been developed, with the potential to advance the non-invasive CCTA modelling of coronary flow, microvascular function, and myocardial perfusion4449. Papamanolis et al have described a computational model for simulating myocardial perfusion, i.e., blood flow from the anatomical end of the epicardial coronary arteries (400 μm) to the level of the capillaries (10 μm) (Figure 5)50. In this proof-of-concept paper, simulated MBF demonstrated favourable comparisons to [15O]H2O PET data in five patients with NOCAD and in one patient with severe obstructive disease for both resting and hyperaemic conditions.
These innovative approaches will need to be evaluated in larger cohorts of patients to determine whether flow-modelling techniques based on CCTA anatomical data can provide insight into MBF as proven for non-invasive assessment of FFR. If this is successful, then CCTA might provide insight into both epicardial and microvascular disease.
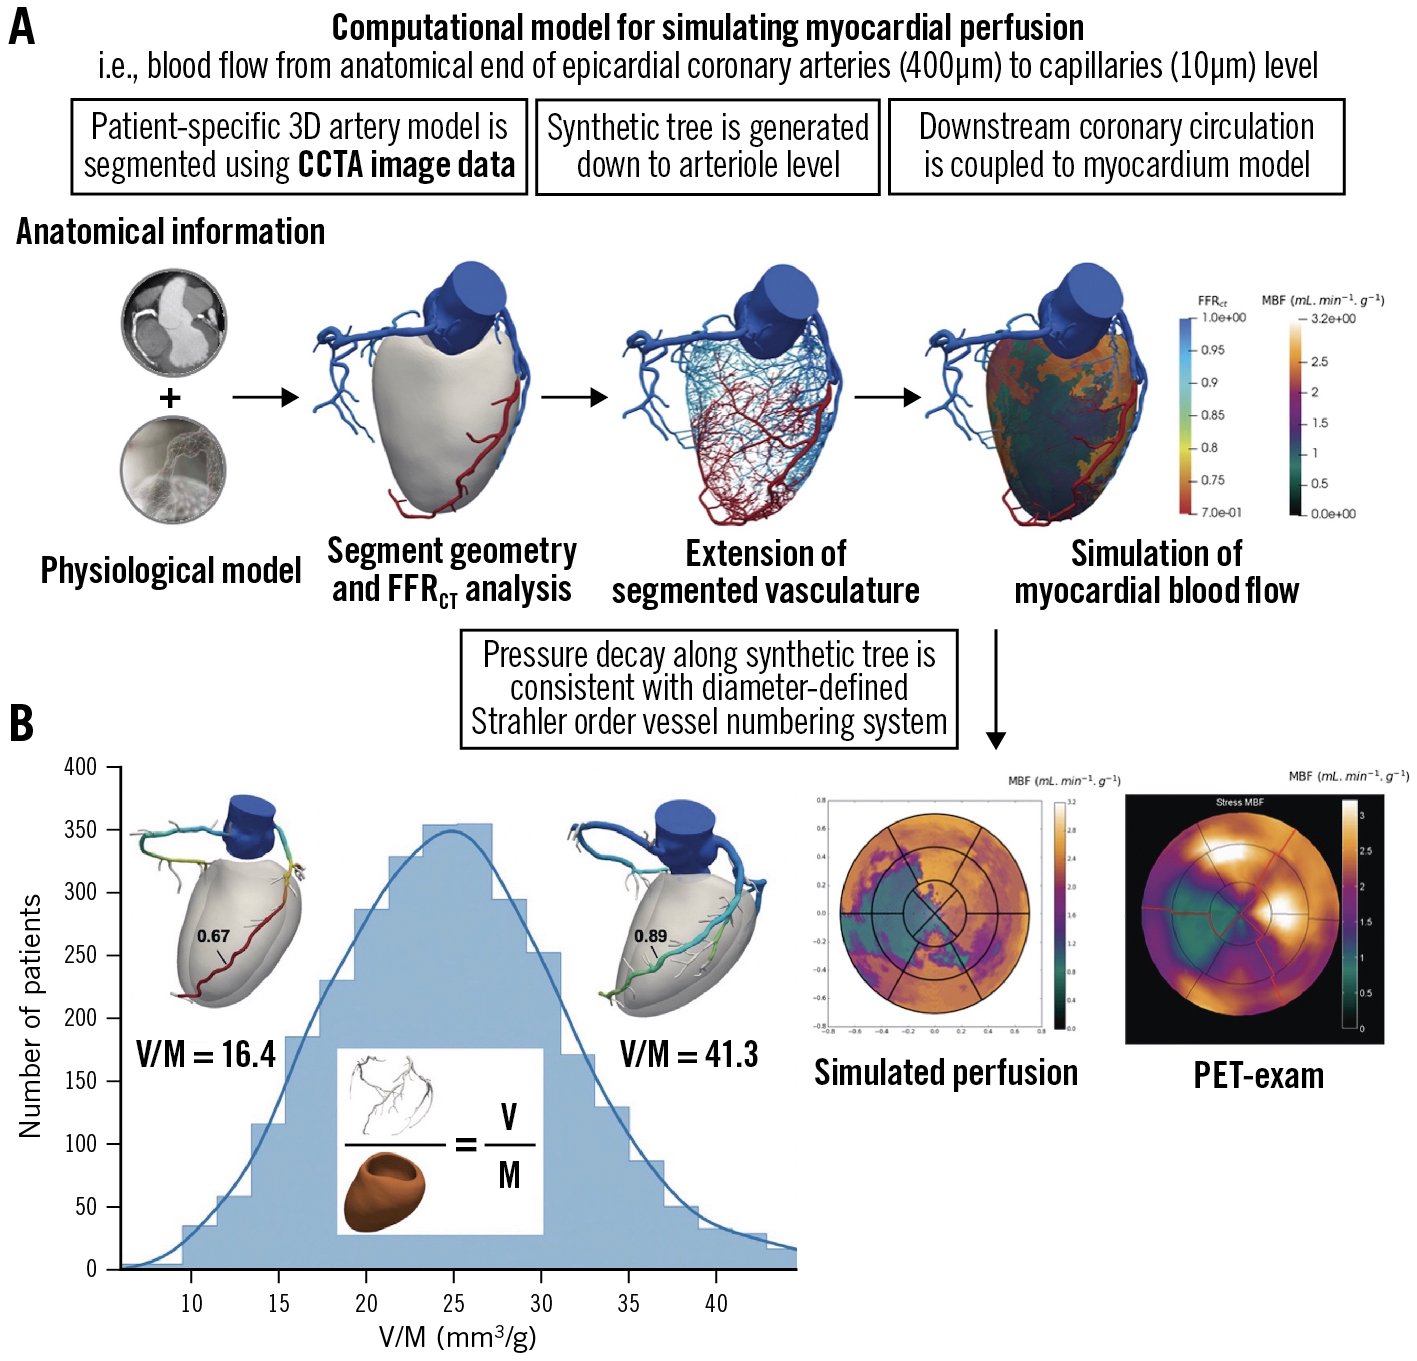
Figure 5. Simulation of myocardial perfusion and coronary lumen volume to myocardial mass ratio. A) Approach to extend non-invasive physiological assessment from epicardial coronary arteries to microcirculation50. B) Coronary lumen volume to myocardial mass ratio (V/M). Reproduced with permission from44. CCTA: coronary computed tomographic angiography; FFRCT: fractional flow reserve derived from coronary computed tomographic angiography; PET: positron emission tomography
Silent coronary atherosclerosis detected by CCTA
The goal of the clinician is to match the intensity of preventive strategies with an individual’s absolute risk of a future atherosclerotic cardiovascular disease event51. CCTA provides a comprehensive assessment of the entire coronary tree, including the presence of plaque, its morphology, and its extent52.
SCAPIS (Swedish Cardiopulmonary Bioimage Study) recruited 30,154 randomly invited individuals aged 50 to 64 years who were not known to have CAD and had high-quality CCTA, showing that silent coronary atherosclerosis was common (42.1%), significant stenosis (≥50%) was less common (5.2%), and more severe forms, such as left main, proximal left anterior descending artery or 3VD, were rarely found (1.9%) in a middle-aged population53. In addition, CCTA-detected atherosclerosis increased with an increasing CAC score: all those with CAC >400 had atherosclerosis, of whom 45.7% had significant stenosis; 5.5% of those with 0 CAC had atherosclerosis, of whom 0.4% had significant stenosis, with increasing prevalence at higher baseline risk. The ACC/AHA guidelines on the primary prevention of cardiovascular disease recommend (IIa) measuring the CAC score to guide the clinician-patient risk discussion – not as a screening test – “in adults at intermediate risk, if risk-based decisions for preventive interventions remain uncertain”, with the emphasis that the absence of CAC does not rule out non-calcified plaque, and that clinical judgment about risk should prevail51. Indeed, SCAPIS showed that in the population with 0 CAC, CCTA-detected atherosclerosis was present in 6.0% of patients with a strong family history of MI, 6.8% of those who were currently smokers, and 8.1% of those with diabetes53.
In 2015 – prior to the 2022 CAD-RADS 2.0 statement, which focuses on the estimation of coronary plaque burden in addition to the severity of stenosis due to its strong association with incident coronary heart disease events10 – the CT-adapted Leaman score (CT-LeSc), developed to quantify CCTA information about atherosclerotic burden (lesion localisation, degree of stenosis, and plaque composition), was validated as an independent long-term predictor of hard cardiac events54 (Figure 6). Patients with NOCAD and a CT-LeSc >5 had a similar risk of cardiovascular events when compared to patients with obstructive CAD (>50% stenosis) but a CT-LeSc <554. In the CONFIRM registry, the 5-year prognostic value of the CT-LeSc was significant in patients without obstructive stenosis55. The Leiden group slightly modified the Leaman score by adding the subcategory “mixed plaque”, in addition to calcified and non-calcified plaque56 (Figure 6). A higher Leiden CCTA risk score was associated with 5-year all-cause mortality or MI in the derivation (Leiden University Medical Center) and external validation cohort (the CONFIRM registry)156.
It is noteworthy that most ACSs are caused by unstable but non-obstructive atherosclerotic plaque which cannot be identified by current invasive or non-invasive diagnostic tests detecting coronary luminal stenosis or stress-induced myocardial ischaemia57. The CRISP-CT (Cardiovascular RISk Prediction using Computed Tomography) study validated the prognostic role of the perivascular fat attenuation index (FAI), the first non-invasive biomarker of CCTA-detected “coronary inflammation”, which is a driver of coronary atherosclerosis plaque formation and is a typical feature of plaque rupture, leading to ACS57. High perivascular FAI values (cut-off ≥−70.1 Hounsfield units [HU]) identify high-risk individuals with a 5- to 9-fold higher adjusted risk for cardiac death and, therefore, could guide early targeted primary prevention and intensive secondary prevention (Supplementary Figure 6A).
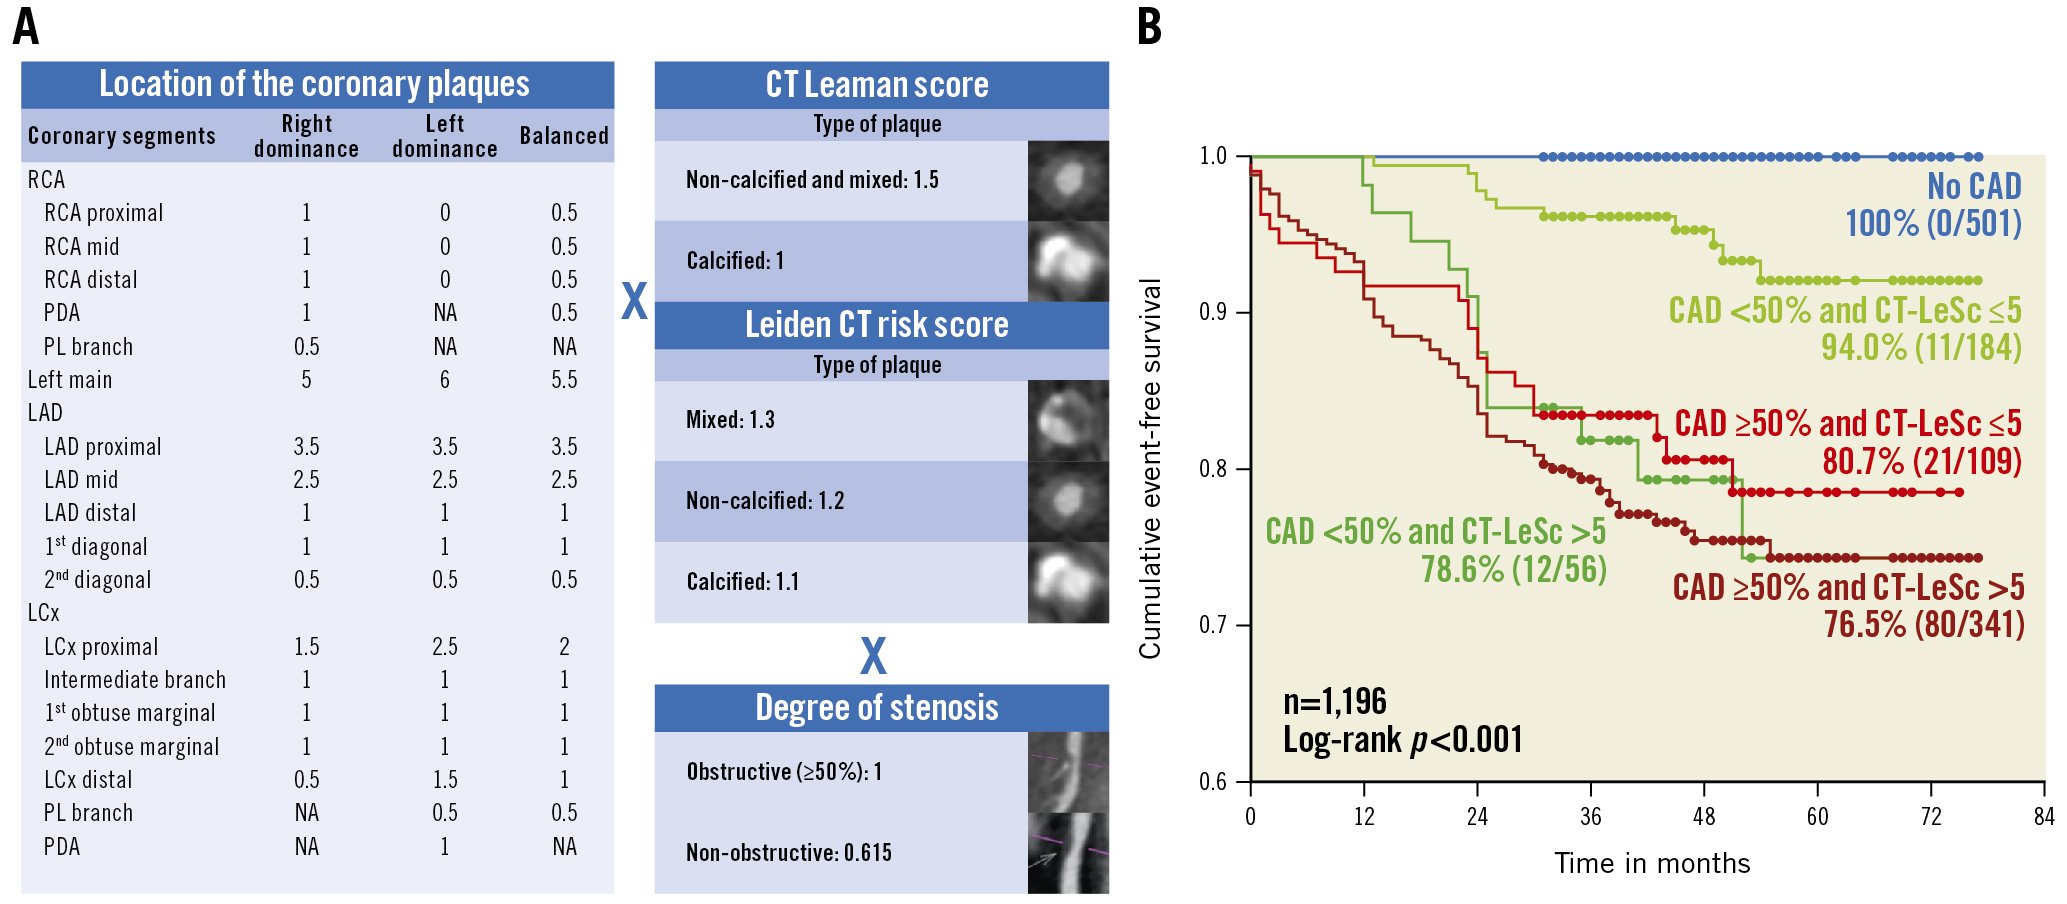
Figure 6. CT Leaman score and Leiden CT risk score. A) Both are calculated by weighting for plaque localisation according to proximality or distality in the coronary circulation×type of plaque×stenosis severity. B) Kaplan-Meier survival curves for hard cardiac events stratified by obstructive versus non-obstructive CAD and CT Leaman score (CT-LeSc). Reproduced with permission from54. CAD: coronary artery disease; CT: computed tomography; LAD: left anterior descending artery; LCx: left circumflex; PDA: posterior descending artery; PL: postero-lateral; RCA: right coronary artery
Hybrid CCTA and molecular PET
Moreover, analogous to the concept, 18F-sodium fluoride (18F-NaF) PET assesses atherosclerotic activity within the coronary arteries to complement the anatomical plaque imaging provided by CCTA (Figure 7). Kwiecinski et al demonstrated that patients with a coronary microcalcification activity (CMA) >1.56 had a >7-fold increase in MI, independent of CAC and patient and lesion characteristics (HR 7.1, 95% CI: 2.2-25.1; p=0.003)58. The authors suggested that these patients might therefore be candidates for aggressive medical therapies, such as proprotein convertase substilisin kexin type-9 (PCSK9) or interleukin 1-beta inhibition. Other PET tracers are now being investigated for macrophage specificity and power to discriminate high-risk lesions, to provide information about active macrophages and coronary thrombus formation59.
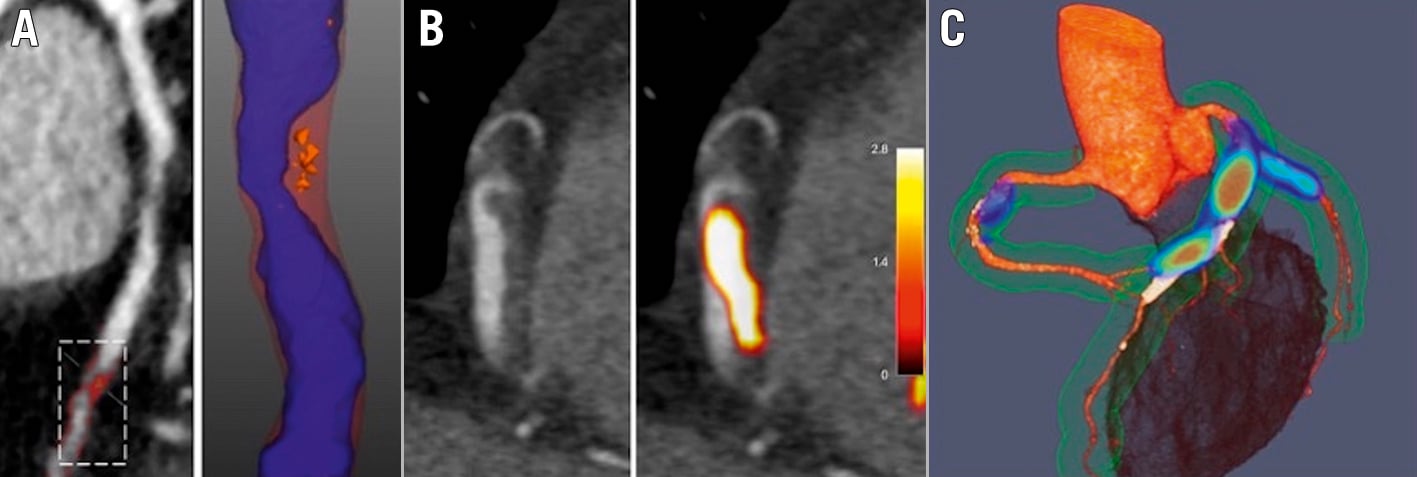
Figure 7. Advanced assessments of plaque type, plaque thrombosis and disease activity with CT and hybrid PET/CT. A) CCTA with regions of LAP (<30 HU, orange areas) B) CCTA showing a low-density area in the lumen of RCA in a patient with inferior STEMI. Hybrid PET/CT images demonstrate 18F-GP1 activity as acute thrombus in this region (yellow area). C) Hybrid PET/CT image after administration of 18F-fluoride. Coloured areas represent regions of increased calcification activity. CT: computed tomography; CCTA: coronary computed tomographic angiography; HU: Hounsfield units; LAP: low-attenuation plaque; PET: positron emission tomography; RCA: right coronary artery; STEMI: ST-elevation myocardial infarction
CCTA for characterising plaque and monitoring the effects of plaque-modifying treatment
Novel semiautomated plaque quantification technology has facilitated quicker assessments and large-scale investigations, which have excellent correlation with IVUS60. Currently, three vendors have gained U.S. Food and Drug Administration clearance for AI-based coronary soft plaque assessment technologies (Cleerly; Elucid; and HeartFlow).
The PARADIGM (Progression of AtheRosclerotic PlAque Determined by Computed TomoGraphic Angiography Imaging) multinational prospective registry included 1,255 patients with suspected or known CAD undergoing CCTA at an interscan interval of ≥2 years61. The results showed that statin therapy was associated with a slower progression of coronary atherosclerosis volume, with increased calcification and a reduction of high-risk plaque features. In a multinational cohort study of 857 patients who underwent CCTA two or more years apart, van Rosendael et al performed quantitative measurements of coronary plaques throughout the entire coronary tree62. The results suggested an association of statin use with a greater rate of transformation of coronary atherosclerosis toward high-density calcium, supporting the concept of reduced atherosclerotic risk with increased density of calcium.
In a multicentre, observational study including 467 patients, Shin et al explored the relationship between the intensity of lipid-lowering treatments and changes in coronary plaque volume, demonstrating that patients with low-density lipoprotein cholesterol (LDL-C) <70 mg/dl had significantly slower plaque progression over 3 years compared with those with an LDL-C persisting ≥70 mg/dl at follow-up (12.7±38.2 mm3 vs 44.2±73.6 mm3; p=0.014)63.
In addition to plaque volumetric changes as a surrogate marker of cardiovascular risk, the ROMICAT II (Rule Out Myocardial Ischemia/Infarction Using Computer Assisted Tomography II) trial showed the role of CCTA in the risk assessment of patients with high-risk plaque features64. While stenosis remained the strongest predictor of ACS in patients with acute chest pain, high-risk plaque (defined as positive remodelling [≥1.1], low-attenuation [<30 HU] area in plaque [LAP], napkin-ring sign, and spotty calcium) was associated with a 9-fold increase in the likelihood of ACS after adjusting for the presence of stenosis ≥50% and clinical risk assessment (Figure 8A). In the SCOT-HEART trial, which followed up 1,769 patients for 5 years, LAP burden was the strongest predictor of MI (adjusted HR 1.60, 95% CI: 1.10-2.34 per doubling; p=0.014), irrespective of cardiovascular risk score, CAC score, or coronary artery stenosis65. Patients with an LAP burden >4% concerning the total plaque burden were nearly 5 times more likely to have a subsequent MI (HR 4.65, 95% CI: 2.06-10.5; p<0.001). These results underscore the potential clinical interest of characterising the atherosclerotic burden, besides lumen stenosis, early in order to help identify patients with a higher risk of future cardiovascular events amenable to primary prevention66.
The EVAPORATE (Effect of Vascepa on Improving Coronary Atherosclerosis in People With High Triglycerides Taking Statin Therapy) trial evaluated coronary plaque characteristics using CCTA to assess icosapent ethyl (IPE) as an adjunct to statin therapy and showed that IPE resulted in significant regression of LAP volume over 18 months (−0.3±1.5 mm3 vs 0.9±1.7 mm3; p=0.006)67.
Patients with lipoprotein(a) [Lp(a)] concentrations, determined by the LPA gene for apolipoprotein(a) [apo(a)], higher than 150 nmol/l (approximately 60 mg/dl) comprise approximately 20% of the general population, and these patients are exposed to a greater risk of developing atherosclerotic cardiovascular disease and aortic stenosis68. The FOURIER (Further Cardiovascular Outcomes Research With PCSK9 Inhibition in Subjects With Elevated Risk) and ODYSSEY Outcomes (Evaluation of Cardiovascular Outcomes After an Acute Coronary Syndrome During Treatment With Alirocumab) trials showed that Lp(a) lowering by PCSK9 inhibitors was associated with a reduction in the rate of cardiovascular events in secondary prevention6970. Kaiser et al showed that high concentrations of Lp(a) were associated with the progression of LAP on CCTA in patients with advanced multivessel CAD despite guideline-based preventative therapies71. This observation put forward a potential mechanism for the association between Lp(a) and the residual risk of MI, supporting Lp(a) as a novel target for treatment in atherosclerosis.
Recently, the APOLLO trial demonstrated that SLN360, a short interfering RNA (siRNA) targeting apo(a) production, reduced plasma Lp(a) concentrations in a dose-dependent manner68. If coronary plaque regression can be achieved in primary prevention and in patients with NOCAD by using subcutaneous injections of non-coding microRNA, with the findings confirmed by CCTA, then a similar pharmacology strategy should be rolled out and disseminated for secondary prevention in patients with much more advanced disease, pre- and post-revascularisation.
Even among plaques with the same vulnerable features, haemodynamic forces acting on the plaque can affect the risk of rupture since plaques can rupture when internal plaque stress exceeds plaque strength72. The EMERALD (Exploring the Mechanism of Plaque Rupture in Acute Coronary Syndrome Using Coronary CT Angiography and Computational Fluid Dynamic) study suggested that the ability to predict the risk of ACS, and thereby optimise treatment for those at high risk, could be enhanced by the integration of the four following non-invasive haemodynamic parameters derived from CCTA, (with cut-off values): 1) FFRCT (0.80); 2) change in FFRCT across the lesion (ΔFFRCT, 0.06); 3) wall shear stress (154.7 dyn/cm2); and 4) axial plaque stress (1,606.6 dyn/cm2) (Figure 8B, Figure 8C)72. Anatomical and haemodynamic parameters derived from CCTA can help identify high-risk plaque, which can direct medical therapies.
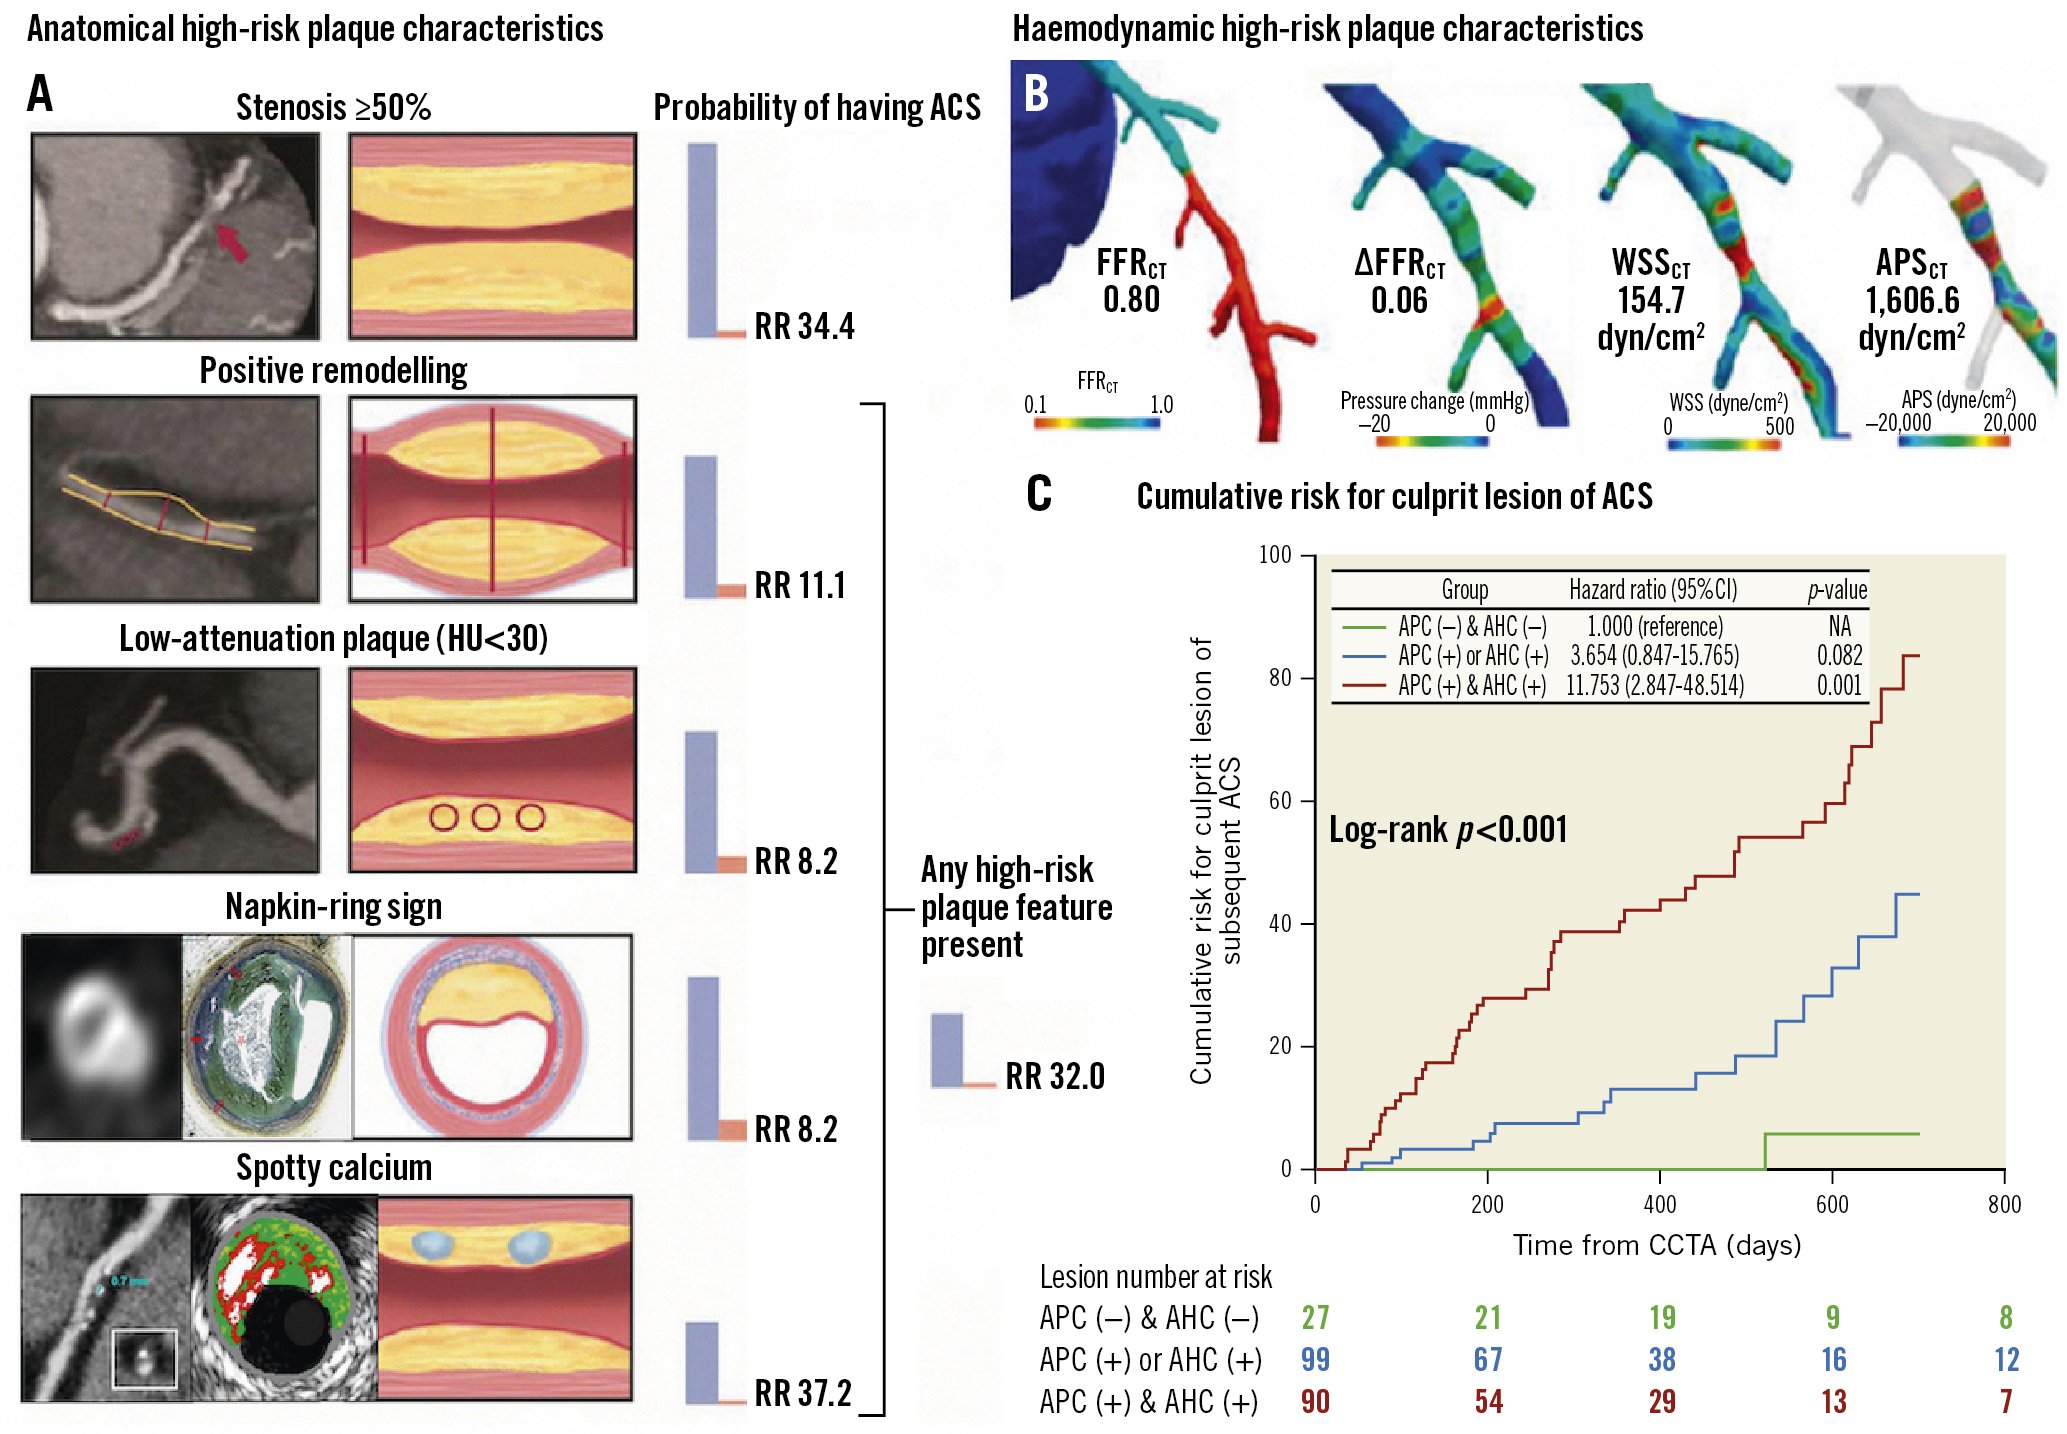
Figure 8. Anatomical and haemodynamic plaque characteristics derived from CCTA. A) Probability of having ACS according to adverse plaque characteristics (APC). B) Adverse haemodynamic characteristics (AHC) based on 4 haemodynamic parameters derived from CCTA. C) Lesions with both APC and AHC showed significantly higher risk compared with those without. Reproduced/modified with permission from (A)64, (B)16, and (C)72. ACS: acute coronary syndrome; APSCT: axial plaque stress derived from computed tomography; CCTA: coronary computed tomographic angiography; CI: confidence interval; FFRCT: fractional flow reserve derived from coronary computed tomographic angiography; HU: Hounsfield units; RR: relative risk; WSSCT: wall shear stress derived from computed tomography
Radiomics: detection of imaging biomarkers by AI
Quantitative imaging biomarkers that characterise tissue features – e.g., CAC (coronary artery calcium), LAP (low-attenuation plaque), FAI (fat attenuation index), and CMA (coronary microcalcification activity) – can be translated into histopathological concepts (e.g., LAP: lipid-rich plaque, necrotic core; FAI: inflamed perivascular fat), which can aid in the detection of vulnerable patients and provide objective decision-support tools in management pathways. In an era of machine learning and AI, it is increasingly feasible to extract quantitative biomarkers from non-invasive images that go beyond plain radiological morphology but yield information on disease state and tissue characterisation. These can ultimately monitor the aggressiveness of disease and assess the response to treatment73.
Radiomics, an emerging field in oncoradiology, is the process of extracting quantitative features from radiological examinations to create big data in order to identify novel imaging biomarkers not necessarily recognised by the human eye and brain but captured and classified by deep learning processes. Kolossváry et al demonstrated that CCTA-based radiomics has the potential to identify qualitative high-risk plaque features, e.g., napkin-ring sign, that, currently, only experts are capable of74.
A prospective case-control study, including 60 patients with acute MI who underwent CCTA within 48 hours of admission and before ICA, compared the radiomic parameters of peri-coronary adipose tissue (PCAT) in patients with acute MI with those with stable or no CAD75. The results showed the most important radiomic parameters for distinguishing patients with or without MI were texture- (i.e., the spatial distribution of voxel grey-level intensities) and geometry- (i.e., shape, size, or volume) based parameters, providing information that was not captured by PCAT attenuation. These findings suggest that CCTA radiomics may become the next tool for more precisely detecting imaging biomarkers and facilitating improved identification of vulnerable patients. There are admittedly many technical and post-processing challenges, including differences between machines, acquisition protocols, and reconstruction methods, that must be overcome before clinical application76.
PCI planning for functional obstructive CAD
CCTA as a “treatment planner” may facilitate, in advance or during percutaneous coronary intervention (PCI), the best fluoroscopic view with optimal exposure of the vessel to be treated (i.e., minimal foreshortening and overlap, maximal bifurcation angle), thereby reducing the number of exploratory injections of contrast medium and the amount of radiation needed to establish the optimal “working projection” for the procedure77. KoÄka et al have designed a CCTA-based method to define optimal viewing angles of both coronary ostia and coronary bifurcation78 (Figure 9). Collet et al described the potential of the online real-time integration of 3D CCTA and fluoroscopic images in the catheterisation laboratory to improve PCI77. Planner projection of CCTA, with the option of longitudinal rotation and cross-sectional scrolling with instantaneous delineation of the vessel and lumen area along the vessel to be treated, enables vessel and lumen sizes, lesion length, calcium burden, and areas of low HU attenuation prone to generate periprocedural complications to be examined non-invasively and simultaneously displayed with the ICA on the fluoroscopic screen. This helps in the selection of devices to be used (e.g., drug-coated balloon, rotational atherectomy, or lithotripsy) as well as stent diameter and length35 (Supplementary Figure 7). Furthermore, during PCI, CCTA provides “live” IVUS-like imaging of the atherosclerotic plaque (Supplementary Figure 6B, Supplementary Figure 6C). The optimisation of the angiographic information with plaque visualisation is likely to be translated into improved PCI techniques with complete plaque coverage, thereby improving clinical outcomes after PCI. This hypothesis is being tested in the ongoing P4 (Precise Procedural and PCI Plan; ClinicalTrials.gov: NCT05253677) randomised clinical trial comparing IVUS-guided PCI versus CT-guided PCI.
In a multicentre trial, randomising 400 patients with chronic total occlusions (CTO) to PCI with or without preprocedural CCTA, CTO PCI with CCTA guidance resulted in a higher success rate than those without (93.5% vs 84.0%; absolute difference 9.5%, 95% CI: 3.4-15.6%; p=0.003), which was attributed to the superior vessel tracking due to the greater understanding of the anatomical morphology of the occlusion from 3D information79.
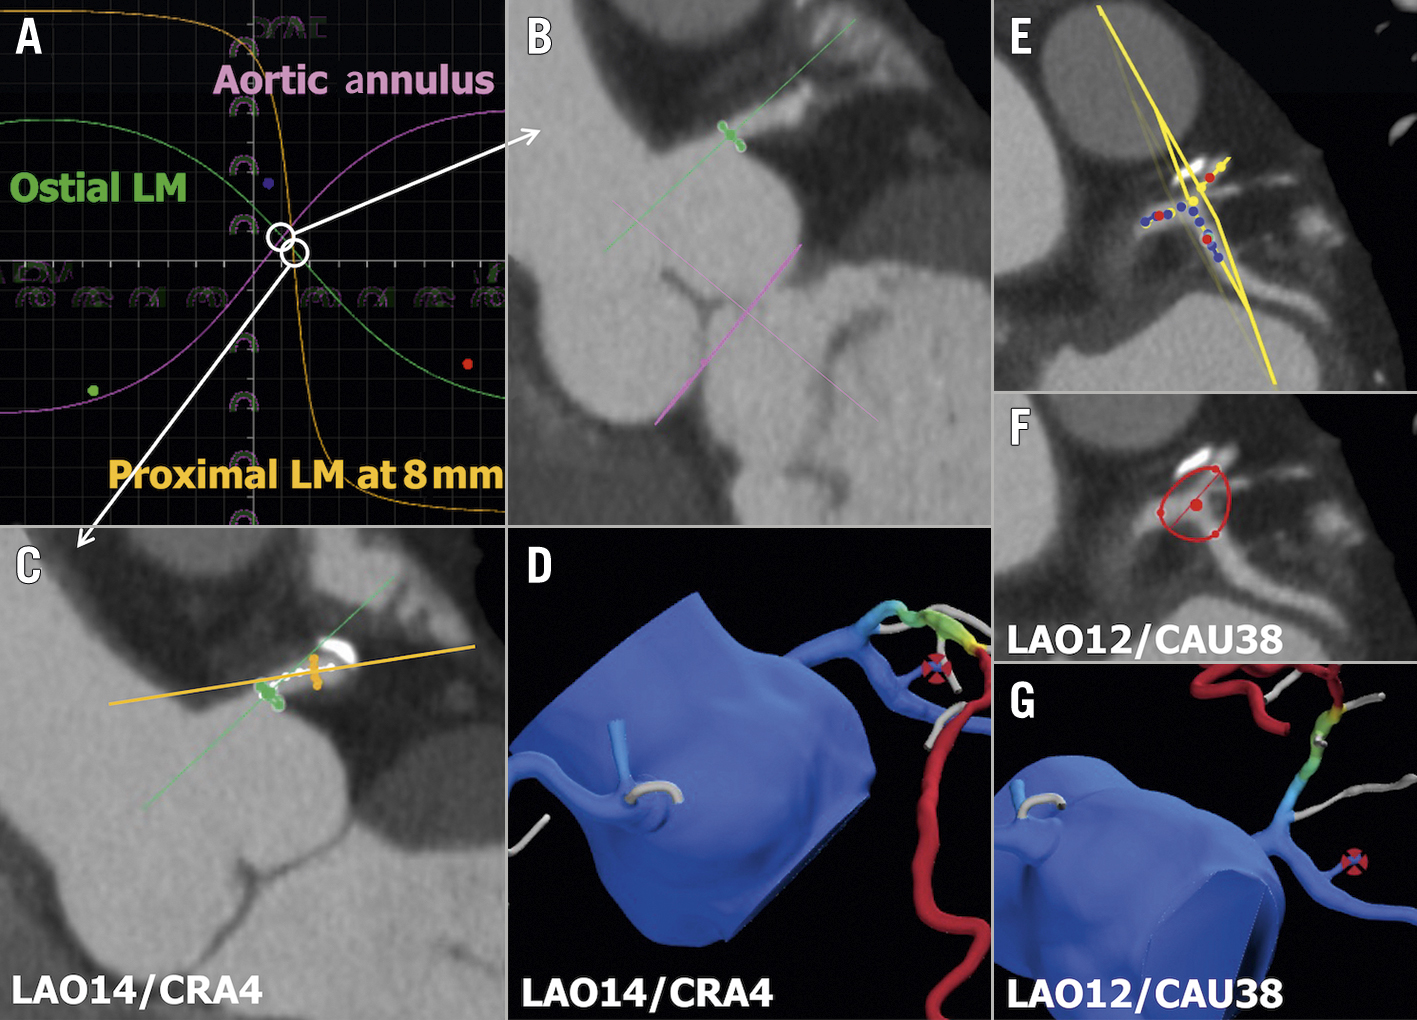
Figure 9. Optimal fluoroscopic viewing angle for ostial, stem, and bifurcation of LM. A,B) The optimal fluoroscopic angle for ostial left main (LM) is obtained by the intersection between the aortic annulus and the ostial LM optimal projection curves. A,C) The optimal fluoroscopic angle for the LM stem is obtained by the intersection between the ostial LM and proximal LM optimal projection curves. D) FFRCT view matching the optimal angle of panel C. E,F) The optimal fluoroscopic angle for LM bifurcation is obtained as the perpendicular angle to the “en face” view created by placing 3 dots in the LM, left descending artery (LAD), and left circumflex artery (LCx) 5 mm from the point of the bifurcation. G) FFRCT view matching the optimal angle of panel F. FFRCT: fractional flow reserve derived from coronary computed tomographic angiography
Post-PCI FFR as predicted from FFRCT: the “FFRCT Planner”
In focal, serial, or diffuse disease, a wire-based iFR/FFR pullback strategy in the catheterisation laboratory allows assessment after the initial stenting of the lesion(s). Residual significant pressure drop may guide the decision-making of subsequent stent placement in order to achieve post-PCI physiological values with favourable long-term prognosis80. The DEFINE PCI (Physiologic Assessment of Coronary Stenosis Following PCI) trial suggested that strategies based on this post-revascularisation physiology and completeness may help determine how to optimise revascularisation in individual patients81. The safety and effectiveness of this strategy to detect post-PCI ischaemia, normalise post-intervention physiology, and reduce clinical events will be prospectively evaluated in the DEFINE GPS (Distal Evaluation of Functional Performance With Intravascular Sensors to Assess the Narrowing Effect: Guided Physiologic Stenting; ClinicalTrials.gov: NCT04451044) trial. Furthermore, the advent of angiography-derived physiology provides post-PCI physiological assessment without the need for a pressure wire82.
Although these pressure wire and invasive intracoronary imaging strategies aiming at optimisation of the procedure have the obvious advantage of repeated evaluation, virtual post-PCI FFR values can now be non-invasively computed from pre-PCI using the “FFRCT Planner” in the planning phase. The latter is a novel interactive tool for the prediction of post-PCI FFR through the virtual stenting of coronary stenoses. Recent data from the P3 (Precise Percutaneous Coronary Intervention Plan) study supports the high accuracy and precision of the FFRCT Planner for predicting invasive post-PCI FFR values83. These results were independent of CAD complexity (i.e., diffuse lesions, high calcium burden) and image quality. The ability to predict post-PCI FFR might play an important role in patient selection and procedural planning, while achieving optimised post-PCI functional results, and, hence, improved outcomes.
Decision-making and surgical guidance in patients with complex CAD
The SYNTAX (Synergy Between Percutaneous Coronary Intervention With TAXUS and Cardiac Surgery) III REVOLUTION trial demonstrated that clinical decision-making between coronary artery bypass graft (CABG) and PCI based on CCTA had a high agreement (concordance of decision 93% and Cohen’s kappa 0.82) with the treatment decision derived from ICA in patients with 3VD with or without left main disease2.
The ongoing FASTTRACK CABG (ClinicalTrials.gov: NCT04142021) trial evaluates the feasibility and the safety of planning and executing CABG based solely on CCTA combined with FFRCT without knowledge of the anatomy defined by ICA. The “CCTA Planning and Operating Heart Team” decides the surgical strategy guided by the anatomical and functional SYNTAX score provided by CCTA and FFRCT (Figure 10). In addition, as a safety assessment, the residual anatomical and functional post-CABG SYNTAX score, based on 30-day CCTA, is calculated to evaluate the topographical adequacy of revascularisation with respect to surgical planning based on non-invasive imaging. In the future, it is plausible that CABG will be guided solely by non-invasive CCTA84, although it will require high-quality CCTA images and interpreters, validated by the central core lab in the initial implementation.
Following confirmation by the surgeon that the most complex CAD can undergo CABG without access to conventional ICA, it becomes evident that the interventional cardiologist should have no reluctance in intervening in patients whose stenotic lesion’s anatomy, functionality, and plaque composition are known by the operator in advance – even before entering the “catheterisation laboratory”, now primarily used as an “interventional suite”1.
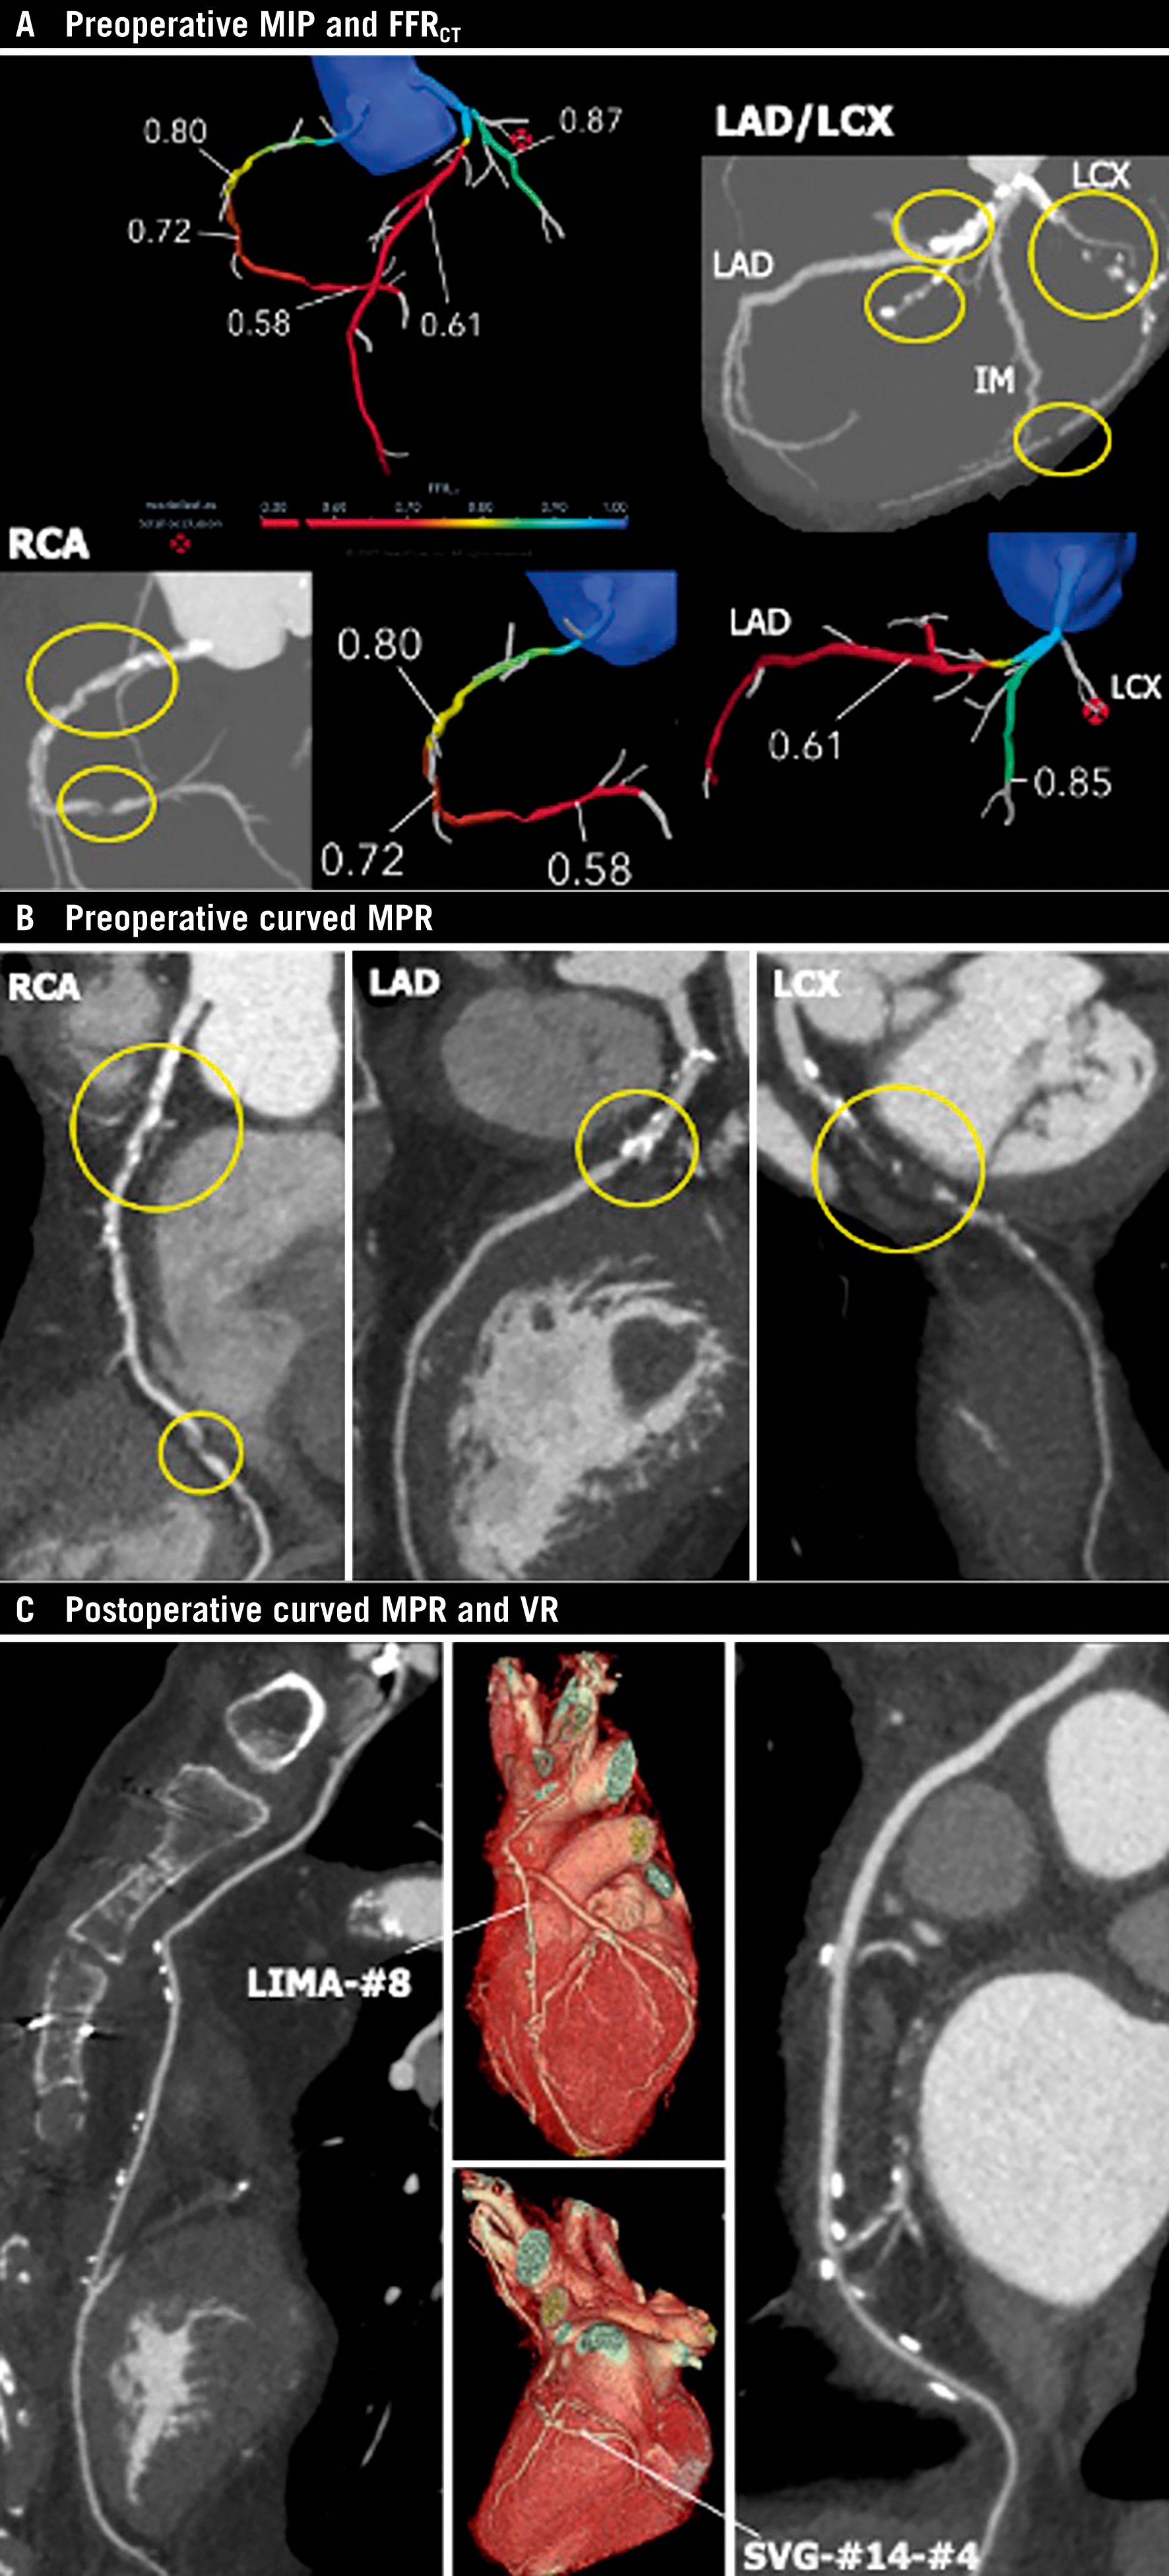
Figure 10. Anatomical and physiological assessment based on non-invasive imaging for planning and follow-up of CABG. A) Preoperative maximum intensity projection (MIP) images and FFRCT. B) Preoperative curved multiplanar reconstruction (MPR) images: yellow circles indicate significant stenoses. FFRCT indicates flow-limiting lesions at the proximal and distal RCA and proximal LAD, and total occlusion at the proximal LCx. C) Postoperative curved MPR and volume rendering (VR) images at 30-day follow-up. Left internal mammary artery (LIMA)-#8 and saphenous vein graft (SVG)-#14-#4 were patent. CABG: coronary artery bypass graft; FFRCT: fractional flow reserve derived from coronary computed tomographic angiography; LAD: left anterior descending artery; LCx: left circumflex artery; RCA: right coronary artery
Extended realities visualisation derived from CCTA as a preoperative planning tool and intraoperative support
Spatial data visualisations (i.e., virtual or augmented reality) of 3D cardiac structures reconstructed from CCTA are expected, as pre- and peri-operative imaging tools more accurately facilitate the execution of surgical planning. Since operative planning requires spatial and 3D thinking that is not achievable on flat, 2D computer screens in conventional practice, Sadeghi et al implemented a technique of immersive 3D virtual reality for preoperative planning in six patients undergoing conventional or minimally invasive cardiac surgery85.
Light objects called “holograms” derived from CCTA that are visualised using the mixed-reality technique (which allows an integration with the natural environment while maintaining direct interaction with both the digital and physical world) are expected to provide not only 3D surgical simulations during the planning phase, but also intraoperative support during CABG with real-world perception and touchless control (Moving image 1, Moving image 2).
Technical factors, optimal practical performance, and limitations of CCTA
The computation of FFR from CCTA requires coronary artery lumen segmentation methods to extract models from image data. This process is facilitated by subvoxel resolution techniques by which the spatial resolution of segmentation (approximately the size of a voxel: 0.25 mm) is able to exceed the voxel resolution (typically 0.5-0.7 mm) through subdividing the attenuation intensities within voxels and utilising machine learning to establish knowledge of the coronary artery lumen shapes and sizes across a large range of images and image features86. Thus, an assessment of the coronary artery geometry to generate a 3D finite element mesh can overcome the spatial resolution of the CCTA image.
Notably, in the PACIFIC trial, 83% of all vessels could be evaluated by FFRCT. This drop-out rate suggested that optimal use of FFRCT in clinical practice greatly depends on high-quality images resulting from adequate pre-scan medication and low heart rates, as well as high-quality scanners, whereas MPI with SPECT/PET is usually not impeded by variable heart rates27.
CCTA diagnostic reliability is highly dependent on image quality. Even when using the newest high-end scanners, it is vital to adhere to CCTA good practice guidelines. A target heart rate for CCTA set at less than 60 bpm is appropriate, but if it cannot be reached, scanning at a higher heart rate may be accepted, depending upon the scanner’s temporal resolution87. Beta blockers are considered the first-line medication for achieving short-term heart rate reduction by oral, intravenous or both routes of drug administration. Nitroglycerin should be administered to achieve vasodilation and in order to improve the diagnostic accuracy of CCTA and stenosis assessment. With prospectively ECG-triggered axial acquisition, the X-ray tube is activated only during a prespecified phase of the cardiac cycle with no table motion during this time interval, saving in radiation exposure compared to retrospective ECG gain (up to 90%)87. The reconstruction kernel is the algorithm to compute the CT values for the pixel. “Soft” kernels produce an image of lower noise and lower spatial resolution, while “sharp” kernels increase resolution, reducing metal artefact or calcium blooming and increasing edge definition, at the cost of higher image noise.
Artefacts including calcification and motion affect CCTA interpretability. Blooming of metallic stent struts obscure up to 55% of the lumen within the stented segment, depending on strut thickness, image acquisition, and reconstruction parameters25. Since FFRCT requires accurate anatomical models, these artefacts may limit accuracy88.
Plaque delineation and differentiation from the vessel wall and lumen on CCTA have not been achieved due to the limitations in the spatial resolution of current CT scanners, meaning that the vessel wall may be incorporated into non-calcified plaque volume89. In addition, increased density of adjacent calcified plaque may raise the density of contiguous low-attenuation high-risk plaque, due to the partial volume effect, leading to it being misclassified as fibrous plaque89. The plaque thresholds vary with lumen attenuation and reconstruction kernels. Currently no societal recommendation on how to identify plaques exist. Although promising outcome data are available, we have much more to learn for general utility in clinical practice.
Conclusions
Non-invasive coronary imaging by CCTA with functional assessment by FFRCT could become a cost-effective first-line patient pathway for the diagnosis of CAD. The adjunction of physiological epicardial conductance and myocardial resistance further boosts its diagnostic capacity. Decision-making between pharmacological treatment, PCI, and CABG based solely on non-invasive imaging may become a reality. NOCAD can be diagnosed by non-invasive imaging and become a privileged target for primary prevention based on lifestyle modification with/without aggressive pharmacological treatment.
Conflict of interest statement
P.W. Serruys has received consultancy fees from Philips/Volcano, SMT, Novartis, Xeltis, and Meril Life, outside of the submitted work. N. Kotoku has received a grant for studying overseas from the Fukuda Foundation for Medical Technology. B.L. Nørgaard has received an unrestricted institutional research grant from HeartFlow, outside of the submitted work. K. Nieman reports research support from the National Institutes of Health (NIH R01- HL141712; NIH R01 - HL146754); unrestricted institutional research support from Siemens Healthineers, Bayer, and HeartFlow, unrelated to this work; has consulted for Siemens Medical Solutions USA and Novartis; and has equity in Lumen Therapeutics. M.R. Dweck is supported by the British Heart Foundation (FS/SCRF/21/32010); is the recipient of the Sir Jules Thorn Award for Biomedical Research 2015 (15/JTA); has received speaker fees from Pfizer and Novartis; and reports consultancy fees from Novartis, Jupiter Bioventures, Beren, and Silence Therapeutics. J.J. Bax has received speaker fees from Abbott Vascular and Edwards Lifesciences; and his department has received unrestricted research grants from Abbott and Edwards Lifesciences. J. Knuuti has receivedconsultancy fees from GE Healthcare and AstraZeneca; and has received speaker fees from GE Healthcare, Bayer, Lundbeck, Merck and Pfizer, outside of the submitted work. C.A. Taylor is an employee and shareholder of HeartFlow. J.A. Leipsic has served as a consultant to Circle CVI and HeartFlow; holds stock options in Circle CVI and HeartFlow; and served on the speaker bureau of Philips. K. Kitagawa has received support from Bayer Yakuhin, Siemens Healthcare K.K., FUJIFILM Medical Co., and Pfizer; and speaker fees from GE Healthcare Japan, HeartFlow Japan, Ono Pharmaceutical Co., Otsuka Pharmaceutical Co., Eisai Co., FUJIFILM Toyama Chemical Co., Bayer Yakuhin, Plusman LLC, and Amgen. B. De Bruyne reports receiving consultancy fees from Boston Scientific and Abbott Vascular; research grants from Coroventis Research, Pie Medical Imaging, CathWorks, Boston Scientific, Siemens, HeartFlow, and Abbott Vascular; and owns equity in Siemens, GE Healthcare, Philips, HeartFlow, Edwards Lifesciences, Bayer, Sanofi, and Celyad. C. Collet has received research grants from GE Healthcare, Siemens, Coroventis Research, Medis Medical Imaging, Pie Medical Imaging, CathWorks, Boston Scientific, HeartFlow, and Abbott Vascular; and consultancy fees from HeartFlow, CryoTherapeutics, and Abbott Vascular. A. Zlahoda-Huzior is a former employee of MedApp. S. Tu reports research grants and consultancy fees from Pulse Medical outside of this submitted work. W. Wijns is supported by the Science Foundation Ireland Research Professorship Award (15/RP/2765). M.J. Budoff has received grant support from General Electric and the National Institutes of Health. The other authors have no conflicts of interest to declare.
Supplementary data
To read the full content of this article, please download the PDF.
Moving image 1. Preoperative holographic visualisation derived from CCTA as a preoperative planning tool and intraoperative support.
Moving image 2. Postoperative 3D digital model derived from CCTA.